Arabian American Development Company
1600 Hwy 6 S, Suite 240
Sugar Land, TX 77478
(409) 385-8300
May 19, 2010
United States Securities and Exchange Commission Via: CMRRR
Division of Corporate Finance
100 F Street, N.E.
Washington, D.C. 20549-4628
Attention: Messrs. H. Roger Schwall and Chris White
Re: Arabian American Development Company
Form 10-K for the Fiscal year Ended December 31, 2008
Filed March 16, 2009
Form 10-Q for the Fiscal Quarter Ended September 30, 2009
Filed November 6, 2009
Response letter dated January 8, 2010
File No. 1-33926
Dear Messrs. Schwall and White:
Please accept this letter as Arabian American Development Company’s (the “Company”) response to your letter dated May 7, 2010.
Form 10-K for the Fiscal Year Ended December 31, 2009
General
|
1.
|
Our comments with regard to the Form 10-K for the fiscal year ended December 31, 2009 are intended to apply to the Form 10-K for the fiscal year ended December 31, 2008, to the extent they are also relevant to such filing.
|
Response: We respectfully request that the staff allow us to implement all of the changes required to respond to its comments in an amendment to our 2009 Form 10-K and that the staff not require us to also amend our 2008 Form 10-K. In support of this request we would point out the following:
|
|
-
|
Form 8-K filed March 11, 2010, included the restated 2008 financial statements and has now been on file for more than two months. That Form 8-K included a statement that the Company’s previously issued 2008 financial statements, as included in its 2008 Form 10-K filed with the SEC on March 16, 2009, should no longer be relied upon.
|
|
|
-
|
The 2009 Form 10-K, which included the restated 2008 financial statements, has now been on file for two full months. That Form 10-K also included a statement (at page 38) to the effect that the 2008 financial statements had been restated, and that the 2008 financial statements, as included in the 2008 Form 10-K, should not be relied upon. Additionally, the 2008 Form 10-K is now 14 months old.
|
|
Messrs. H. Roger Schwall and Chris White
May 19, 2010
Page 2 of 17
|
-
|
In the 2009 Form 10-K we included disclosure (pages 21 and 22) about the unresolved staff comments on our 2008 Form 10-K. In the amended 2009 Form 10-K that we will file at such time as these comments are resolved, we will not remove this disclosure, but we will update it to indicate that the amended Form 10-K reflects revisions which have resolved the comments.
|
In light of the above, we believe that investors are well informed to no longer rely upon the 2008 Form 10-K, in fact are no longer relying on the 2008 Form 10-K, and that a formal amendment to the 2008 Form 10-K would have no affect on investors or other readers.
|
2.
|
Please refer to SEC Release No. 33-9089, Proxy Disclosure Enhancements, and provide us with a draft of enhanced disclosure that complies with the new rules. We may have further comments after reviewing your response.
|
Response: We respectfully note your comment and have attached a draft of a completely rewritten disclosure that we believe complies with SEC Release No. 33-9089 as shown in Attachment A.
Management’s Discussion and Analysis of Financial Condition and Results of Operations, page 29
Liquidity and Capital Resources, page 31
|
3.
|
We reissue comment 7 from our letter dated November 30, 2009 in relevant part. Please disclose in this section your sources of liquidity, including a description of all material terms of the revolving loan agreement and the term loan agreement described in Note 10 to your financial statements. In addition, we note your disclosure at page 38 regarding payments due within three years that relate to contractual obligations. Please disclose your anticipated source of funds for such payments.
|
Response: We respectfully note your comment and will include a description of our revolving loan and term loan agreement described in Note 10 to our financial statements in our amended Form 10-K for the year ended December 31, 2009, as shown in Attachment B. With regard to your comment concerning page 38, we will add the following disclosure underneath the table:
“The anticipated source of funds for payments due within three years that relate to contractual obligations is from a combination of continuing operations and long-term debt refinancing.”
Directors and Executive Officers of the Registrant, page 46
|
4.
|
Please enhance your disclosure so that it includes all of the information required by Item 401 of Regulation S-K. For example, in many of the biographical sketches, information is missing as to specific titles held, specific names of organizations, and exact periods during which the titles were held.
|
Response: We respectfully note your comment and have enhanced our disclosure regarding the Company’s directors and executive officers in our amended Form 10-K for the year ended December 31, 2009 as follows:
Messrs. H. Roger Schwall and Chris White
May 19, 2010
Page 3 of 17
PART III
Item 10. Directors and Executive Officers of the Registrant
The following sets forth the name and age of each director of the Company as of December 31, 2009, the date of his election as a director and all other positions and offices with the Company held by him.
|
Name; Current Positions Held
|
Age
|
Director since
|
Term expires at Annual meeting in
|
|
Hatem El Khalidi
Co-founder and retired President & CEO of the Company
|
85
|
1968
|
2010
|
|
Nicholas N. Carter ………………………………………….
President, Chief Executive Officer of the Company since July 2009, President of the Petrochemical Company since 1987, Member of AMAK Board
|
62
|
2004
|
2011
|
|
Robert E. Kennedy ………………………………………….
Chairman of the Audit and Compensation Committees; Member of Nominating Committee and AMAK Board
|
65
|
2007
|
2012
|
|
Ghazi Sultan
Chairman of the Nominating Committee; Member of Compensation and Audit Committees and AMAK Board
|
73
|
1993
|
2010
|
|
Allen P. McKee
Member of the Audit, Compensation and Nominating Committees and AMAK Board
|
68
|
2009
|
2012
|
|
Mohammed Al Omair
Member of Audit, Compensation and Nominating Committees
|
66
|
2007
|
2011
|
|
Charles W. Goehringer, Jr.
General Counsel
|
51
|
2007
|
2011
|
Mr. Hatem El Khalidi, received a Bachelors Degree in Chemistry from the American University of Beirut in 1946 and a Masters of Science Degree in Geology from Michigan State University in 1950. He was co-founder of the Company in 1967 and served as President from 1975 through June 2009 and Chief Executive Officer of the Company from February 1994 through June 2009. From 1950-55, he was with Geophysical Services, Inc. (later Texas Instruments), Dallas, TX and United Gas Company in Shreveport, LA. From 1956-60, Mr. El Khalidi was Chief Geologist with Yemen Development Corp. seeking oil and mineral concessions in Yemen. From 1960-69, he was a geological consultant with Dallas Resources, operating out of Beirut. Mr. El Khalidi originally discovered the Al Masane ore deposits in 1968 and was granted an exploration license in 1971 and development has been under his direct supervision throughout the life of the project until transferred to AMAK in 2008.
Mr. Nicholas N. Carter, a U.S. citizen and the President and Chief Executive Officer of the Company since July 2009, is a 1975 graduate of Lamar University with a Bachelor of Business Administration Degree in Accounting. Mr. Carter has been a Certified Public Accountant since 1977. He worked at the Sabine River
Messrs. H. Roger Schwall and Chris White
May 19, 2010
Page 4 of 17
Authority of Texas as a Project Accountant from 1973 to 1975. From 1975 to 1977 he was a Staff Accountant with Wathen, DeShong and Company, CPA's. In 1977 he joined South Hampton asController. His job titles with the Company include 1979, Facility Manager at TOCCO, 1982, Treasurer of TOCCO, 1987, President of South Hampton. In 2007 he added the title of Executive Vice President of Arabian American Development Co. in addition to the petrochemical duties. He was named to his current position in 2009 and retains the petrochemical duties. Mr. Carter also serves as a Director and President of Pioche Ely Valley Mines, Inc. of which the Company owns 55% of the outstanding stock. Mr. Carter was appointed to the Board of AMAK in February 2009.
Mr. Robert Kennedy, a U.S. citizen, is the President of Robert E. Kennedy and Associates, a consulting firm assisting various entities with transportation and project development issues in Europe and the Middle East. He has over thirty years experience in the oil and petrochemical industry and retired as General Manager for Supply, Logistics, and Procurement from Chevron Chemical in 2000. During his employment with Chevron he was instrumental in developing the Aromax project in Jubail, Saudi Arabia. Mr. Kennedy holds a Bachelors of Science Degree in Chemical Engineering from the University of Iowa and attended the Masters of Business Administration program of American University. Mr. Kennedy was appointed to the Board of AMAK in 2009. We believe that this experience, as well as his leadership abilities, brings valuable experience and skill to our board of directors.
Mr. Ghazi Sultan, a Saudi citizen, received Bachelor of Science Degrees in Geology and Chemistry from the University of Cairo in 1958. He received a Masters of Science Degree in Geology from the University of Texas in 1964. From 1965-1988, Mr. Sultan served in various Saudi Arabian governmental posts for the Ministry of Petroleum and Minerals, including Director of the Geology Department, Director General of Mineral Resources, Assistant Deputy Minister, and finally as Deputy Minister for Mineral Resources. Mr. Sultan previously served as a member of the Board of Directors of Petromin, the Jeddah Refinery, and King Fahad University of Petroleum and Minerals. He is currently a member of the Board of AMAK. During his career, Mr. Sultan supervised, assisted and negotiated contracts on behalf of the Ministry of Petroleum and Mineral resources with the United States Geological Survey, BRGM of France, Rio – UK Tinto Zinc, British Steel – UK, Roan Selection Trust – UK, Min-Atom – France, Preussag – Germany, Arabian Drilling – Saudi Arabia, and Saudi Sudanese Mission for Red Sea Mining. We believe that his knowledge of the mining industry and manner of conducting business in Saudi Arabia provide a critical resource and skill set to our board of directors.
Mr. Allen P. McKee, a US citizen, appointed to the board in 2009 and subsequently elected to serve until 2012, has an extensive background in investment evaluation and management as well as international finance. He has been an advisor to Fal Holdings Arabia Co. Ltd., Riyadh, since its inception in 1977. Mr. McKee served as president of Montgomery Associates Inc. from 1975-2000, a firm focusing on both venture-stage companies and real property investments. From 1974-78 he was an advisor to companies seeking funding through the International Finance Corp (World Bank Group) and regional development banks. From 1971-74, Mr. McKee served as vice president of Union International (Union Bank’s international venture subsidiary) and previously was investment officer with BankAmerica International Financial Corp. From 1967-70 he was area relations officer on the headquarters staff overseeing the Middle East banking group at Bank of America. He holds a Bachelor of Arts Degree in Economics from the University of Michigan (1964) and a Masters of Business Administration Degree in Finance from the University of California, Berkeley (1971). Mr. McKee served as a naval officer in the US Pacific Fleet from 1964-67. He was appointed to the Board of AMAK in 2009 and serves on the audit, nominations and compensation committees of the Company, chairing the latter. We believe that his knowledge of the Middle East and finance and accounting provide a critical resource and skill set to our board of directors.
Mr. Charles W. Goehringer, Jr., a U.S. citizen and partner of the law firm of Germer Gertz, L.L.P. in Beaumont, Texas, serves as corporate counsel for the Company. From 1981-1987, Mr. Goehringer worked for Gulf States Utilities Company as a mechanical engineer and unit superintendent. From 1987-1995, Mr. Goehringer worked for Quantum Chemical Company as a mechanical engineer and maintenance superintendent. He next worked as an attorney for the law firm of Mehaffy Weber, P.C. from 1995-2000. From 2000 to the present, Mr. Goehringer has been employed as an attorney with the law firm of Germer Gertz, L.L.P. Mr. Goehringer holds a Bachelor of Science Degree in Mechanical Engineering from Lamar
Messrs. H. Roger Schwall and Chris White
May 19, 2010
Page 5 of 17
University, a Masters of Business Administration Degree from Colorado University, and a Doctor of Jurisprudence from South Texas College of Law. Mr. Goehringer also serves as a Director of Pioche ElyValley Mines, Inc. of which the Company owns 55% of the outstanding stock. We believe that his knowledge of the industry and finance provide a critical resource and skill set to our board of directors.
Mr. Mohammed O. Al Omair, a Saudi citizen, resides in Riyadh, Saudi Arabia, and previously served as Senior Vice President & Deputy Chief Executive Officer for Fal Holdings Arabia Co. Ltd. Prior to his service with Fal, he held a senior position with the Gulf Cooperation Counsel (GCC), a six-nation organization of Arab nations in the region. He holds a Bachelor of Arts Degree in Political Science and a Master of Public Administration from the University of Washington. We believe that this experience, as well as his leadership abilities, brings valuable experience and skill to our board of directors.
The Nominating Committee solicits recommendations for potential Board candidates from a number of sources including members of the Board, officers of the Company, individuals personally known to the members of the Board and third-party research. In addition, the Committee will consider candidates submitted by stockholders when submitted in accordance with the procedure described in the Company’s annual proxy statement. The Committee will consider all candidates identified through the processes above and will evaluate each of them on the same basis.
The Board of Directors of the Company has an Audit Committee which is composed of Ghazi Sultan, Mohammed Al Omair, Robert Kennedy and Allen McKee. The Board has determined that each of the members of the Audit Committee meets the Securities and Exchange Commission and Nasdaq Stock Market standards for independence. The Board has also determined that Allen McKee meets the Securities and Exchange Commission criteria of an “audit committee financial expert.”
The following sets forth the name and age of each executive officer of the Company as of December 31, 2009, the date of his appointment and all other positions and offices with the Company held by him.
|
Name
|
Positions
|
Age
|
Appointed
|
|
Nicholas N. Carter
|
President, Chief Executive Officer and Director/President - TOCCO
|
62
|
2009/1987
|
|
Mark Williamson
|
Vice President of Marketing - TOCCO
|
54
|
1996
|
|
Connie Cook
|
Chief Accounting Officer, Secretary, Treasurer/Secretary, Treasurer - TOCCO
|
46
|
2008/2004
|
Each executive officer of the Company serves for a term extending until his successor is elected and qualified.
Please refer to the director discussion above for Mr. Carter’s business experience.
Mr. Mark Williamson is a U.S. Citizen and has been Vice President of Marketing for TOCCO since 1995. Mr. Williamson is a graduate of Sam Houston State University with a BBA in Marketing. Mr. Williamson has been with TOCCO since 1987 and has over 28 years within the petrochemical industry. Before TOCCO, Mr. Williamson spent 5 years with Ashland Chemicals as Sales and Marketing Representative and Branch Manager.
Ms. Connie Cook, a U.S. citizen, received her BBA Degree in Accounting from Lamar University in 1991 and is a CPA. She was the Accounting Manager of TOCCO from 1991-96. She has been the Controller of TOCCO from 1996 to the present and was the Assistant Secretary of TOCCO from 1992-2004. In 2004 Ms. Cook became the Secretary/Treasurer of TOCCO and continues to hold those titles. She was the Assistant Secretary of the Company from 2007-08. In 2008 Ms. Cook became the Secretary/Treasurer of the Company and continues to hold those titles.
Messrs. H. Roger Schwall and Chris White
May 19, 2010
Page 6 of 17
There are no family relationships among our directors and executive officers.
Executive Compensation, page 48
|
5.
|
Please enhance your disclosure so that it includes all of the information required by Item 402 of Regulation S-K. For example:
|
|
|
●
|
You state on page 51 that “In 2009 the Company’s executives received no award based upon 2008 performance.” However, there are awards shown in the “Bonus” column of the Summary Compensation Table. Please explain.
|
Response: We revised the Summary Compensation Table shown in Attachment A in response to this comment to separate South Hampton’s profit sharing program from the Executive Cash Bonus Program. The 2009 awards shown in the “Profit Sharing” column of the revised Summary Compensation Table for Nicholas N. Carter, Connie J. Cook, Mark D. Williamson, Gerardo Maldonado and Marvin Kaufman represent monies paid from South Hampton’s profit sharing plan during 2009, which was available to all South Hampton employees. The 2009 awards shown in the “Bonus” column of the revised Summary Compensation Table for Nicholas N. Carter, Connie J. Cook and Mark D. Williamson represent bonuses totaling $130,000 paid during the first quarter of 2010 under the Executive Cash Bonus Plan. As reflected in the revised Summary Compensation Table, none of the Company’s executives received bonuses under the Executive Cash Bonus Plan, stock grants or stock options in 2009 based upon their 2008 performance, although they along with the other South Hampton employees participated in the South Hampton profit sharing program for 2008. Awards for 2008 shown in the “Restricted Stock Award(s)” column of the revised Summary Compensation Table for Nicholas N. Carter, Connie J. Cook and Mark D. Williamson reflect grants of restricted stock based on the Company’s performance in 2007 that were not issued until the first quarter of 2008.
|
|
●
|
Discuss in your Compensation Discussion and Analysis the grant of the option for 200,000 shares to Mr. El-Khalidi, which is stated in the 2009 Grants of Plan-Based Awards table to have occurred on July 2, 2009. Explain the rationale for this grant.
|
Response: As background, the Board of Directors of the Company adopted the following resolution on October 10, 1995:
|
|
“2. Regarding the accrued retainers of Hatem El-Khalidi, currently about $400,000, which are demand loans to the Company, El-Khalidi shall have the option [the “1995 Option”] to convert any part of these loans outstanding at any time prior to the repayment of these loans into common shares of the Company, at the price of One ($1.00) US dollar per share.” (the “1995 Resolution”)
|
On July 2, 2009, the Board of Directors of the Company discussed the fact that since the Company subsequently paid Mr. El-Khalidi all of the accrued retainers referenced in the 1995 Resolution, the 1995 Option expired by its own terms, and in order to ensure there is no confusion regarding termination of the 1995 Option, the Board adopted the following resolution:
Messrs. H. Roger Schwall and Chris White
May 19, 2010
Page 7 of 17
| |
“RESOLVED that the Option granted by the Company to Hatem El-Khalidi pursuant to the 1995 Resolution is hereby officially terminated in all respects and shall be removed from the Company’s books and records.”
|
The Board of Directors then considered Mr. El-Khalidi’s efforts related to the Al Masane mining project in southwestern Saudi Arabia in conjunction with his retirement as CEO of the Company on June 30, 2009. The Board determined that the Company should issue two options to purchase a total of 400,000 shares to Mr. El-Khalidi, tied to the performance of AMAK.
The rationale for the grant of these two options was based on the fact that virtually all of Mr. El-Khalidi’s career was spent working on the mining project in Saudi Arabia under difficult conditions and the Board believed a substantial award was justified in light of his relatively low salary of $72,000 per annum. However, in order to link the value of that award to the ultimate success of the Saudi Arabia mining project which had been Mr. Khalidi’s focus, the Board of Directors made the options contingent upon the occurrence of the following conditions which are explicitly tied to the performance of AMAK: (i) the first option for 200,000 shares cannot be exercised until such time as the first shipment of ore from the mining project is transported for commercial sale by AMAK and the option terminates if not exercised by June 30, 2012, and (ii) the second option for 200,000 shares cannot be exercised until such time as the Company receives its first cash dividend distribution from AMAK and the option terminates if not exercised by June 30, 2019.
|
|
●
|
We note your statement on page 50 that “The Company includes an annual cash bonus as part of its compensation program because it believes this element of compensation helps to motivate management to achieve key individual and operational objectives by rewarding the achievement of these objectives.” Similarly, on page 52, you state there is “a significant portion of total compensation reflecting a risk aspect tied to long-term and short-term financial and strategic goals.” However, your discussion of “Performance Metrics” on page 52 appears to indicate that the process of determining awards is “subjective” and done after the fact, without pre-established performance metrics. Please explain. Also, your discussion of “Performance Metrics” is limited to the year 2009; accordingly, please add an explanation of the “long-term . . . financial and strategic goals.”
|
Response: We have revised the Compensation Discussion and Analysis section to better describe the process used by the Compensation Committee to determine awards. Please refer to Attachment A. In addition, the Compensation Committee is in the process of requesting proposals from various compensation consultants in the Houston, Texas area for assistance with goal setting and compensation allocation.
Summary Compensation Table, page 53
|
6.
|
You state at page 51 that for 2009 performance, $130,000 in cash and 65,000 in options were awarded and will be paid in the first quarter of 2010. Please advise why the cash portion is not reflected in the Summary Compensation Table with respect to bonus payments earned in 2009. See Item 402(c)(2)(iv) of Regulation S-K.
|
Messrs. H. Roger Schwall and Chris White
May 19, 2010
Page 8 of 17
Response: Pursuant to Item 402(c)(2)(iv) of Regulation S-K, the dollar value of the cash bonuses awarded in 2009, but paid or issued in 2010 will be reflected in the Summary Compensation Table in the amended Form 10-K for the fiscal year ended December 31, 2009.
Review, Approval or Ratification of Transactions with Management and Others, page 60
|
7.
|
Please disclose the standards to be applied by your board when determining whether to approve or ratify related party transactions. See Item 404(b)(1)(ii) of Regulation S-K.
|
Response: Paragraph 18 of the Company’s Amended and Restated Audit Committee Charter, adopted on February 13, 2004, provides: “The Audit Committee, to the extent it deems necessary or appropriate, shall . . . [r]eview and, if appropriate, approve all related party transactions.” See Attachment C-1. At present, the Audit Committee does not have a formal written policy addressing related party transactions. However, in the past, the Audit Committee has handled related party transactions in accordance with the policy outlined in Attachment C-2, which will be placed in front of the Board for adoption at the next scheduled meeting.
Financial Statements
Note 8 – Investment in AMAK, page F-21
|
8.
|
We note your response to prior comment 9 in our letter dated February 23, 2010. Please provide to us your detailed impairment analysis of the assets contributed to AMAK prepared in accordance with ASC 360.10.35-21(f) (SFAS 144, paragraph 8(f)) at the time of the contribution. Your analysis should include the assumptions incorporated by you about the use of the assets and information regarding all other available information used by you in the analysis. Please discuss how your assumptions were determined and how they are consistent with those assumptions used by you to negotiate your joint venture arrangement. If a range was estimated for possible cash flows, tell us how you considered the likelihood of various possible outcomes. We expect that your estimates included cash flows associated with future expenditures necessary to develop the properties, including any interest payments that would be capitalized.
|
We note that depending upon the resolution of the next comment, we would expect you to evaluate impairment in your investment on a regular basis in accordance with the guidance of ASC 325.20.35-2 or 323.10.35-31 and 32 (APB 18), paragraphs 6(a) or 6(b) and 19(h)), as appropriate, ASC 970.323.35-12 (SOP 78-9, p. 20), and related accounting literature.
Response: The assets were contributed to the joint venture on December 30, 2008. In connection therewith an impairment analysis was performed (in actuality, due to the one day gap between the date the assets were contributed and our December 31, 2008 year end, the impairment analysis for the contributed assets was performed at the same time and in conjunction with the general impairment analyses performed as of December 31, 2008). The general impairment analysis found that due to the ongoing creation and organization of the joint venture, and the continuing positive value of the projected cash flow estimates from the project, the assets had actually increased in value rather than suffering an impairment.
Messrs. H. Roger Schwall and Chris White
May 19, 2010
Page 9 of 17
For general background information purposes, in 1994 and 1996 we retained Davy International Canada Ltd. (“Davy”) to review and update the Al Masane Feasibility Study that was prepared by Watts, Griffis and McQuat (“WGM”) in 1982 (excluding the mining portion of the project). The results of Davy’s reviews are contained in the following reports:
|
-
|
Arabian Shield Development Company, Al Masane Project, Saudi Arabia, Feasibility Study for a 2000 TPD Concentrator and Related Infrastructure, Davy Project No. 1313, April 1994; and
|
|
-
|
Arabian Shield Development Company, Al Masane Project, Capital Cost Estimate Update for Concentrator and Related Facilities, Davy Project No. 1432, March 1996.
|
WGM’s reviews are contained in the following reports:
|
-
|
Volumes 1 and 2, Feasibility Study – Al Masane Project – For Arabian Shield Development Company and National Mining Company, WGM, August 27, 1982;
|
|
-
|
Review of the 1982 Feasibility Study – Al Masane Project – For Arabian Shield Development Company and National Mining Company, WGM, September 26, 1984;
|
|
-
|
Review of Feasibility Study – Al Masane Project – For Arabian Shield Development Company and National Mining Company, WGM, February 20, 1989;
|
|
-
|
Feasibility Study on the Al Masane Project for Arabian Shield Development Company, July 22, 1994; and
|
|
-
|
Al Masane project, Mine Capital and Operating Cost Update, 1st Quarter 1996, WGM, April 1, 1996.
|
In April 2005 we retained SNC Lavalin Engineers & Constructors Inc. to update the capital and operating cost estimates for the Al Masane Project based on the engineering design work previously performed by Davy and WGM. SNC Lavalin determined that the estimated capital cost for development of the underground mine, a 2000 TPD concentrator, site access road, site power distribution, water pipeline, administration, service and camp buildings, and a tailing storage facility would be approximately $115,800,000. SNC Lavalin also estimated the extra cost associated with construction of a gold recovery circuit using cyanide leach to be $6,750,000. SNC Lavalin further determined that the total estimated operating cost for the project including a gold recovery circuit was $60.01 per ton with a level of accuracy of ± 15 percent.
In 2008 we retained Molinari & Associates Inc. to prepare cash flows and internal rate of return projections. Molinari used ore reserve estimates prepared by WGM in the July 22, 1994 Feasibility Study referenced above. Molinari developed a base case and four additional cash flow projections using the following assumptions:
|
-
|
Base Case: Production of 700,000 tpa for 11 years; capital investment increased to $139.5 million to allow for current tight machinery supply; and average metal 2007 YTD metal prices.
|
|
-
|
Scenarios 1-4: Production was increased to 840,000 tonnes during year 5 and further to 1,000,000 tonnes during year 9.
|
Messrs. H. Roger Schwall and Chris White
May 19, 2010
Page 10 of 17
Using discount rates of 5, 10 and 15 percent, Molinari determined Net Present Values of the project ranging from $258 million to more than $1 billion. A partial copy of the SNC Lavalin August 2005 Update of Feasibility Study and Molinari Cash Flow Projections are provided in Attachment D.
During this time in 2008, we believed that while the discount rates used by Molinari were on the low side, the overall profitability of the mining project was positive, even with metal prices at very low levels due to the economic situation in the world at the time. All of these factors were taken into account when the impairment analysis was performed.
Your comment made reference to ASC 360.10.35-21(f) SFAS 144, paragraph 8(f), which refers to assets which are disposed of or are likely to be disposed of. However, the Company noted, and notes, that paragraph 27 of SFAS 144 provides that “A long-lived asset to be disposed of other than by sale (for example, by abandonment, in an exchange measured based on the recorded amount of the nonmonetary asset relinquished, or in a distribution to owners in a spinoff) shall continue to be classified as held and used until it is disposed of. Paragraphs 7–26 shall apply while the asset is classified as held and used.” Since the assets were to be “disposed of” in the formation of the AMAK joint venture, which was to be “an exchange measured based on the recorded amount of the nonmonetary asset relinquished,” we believed that this instruction of paragraph 27 applied, and we performed the impairment assessment using the method specified in paragraphs 10 through 24 of SFAS 144. The carrying amount of the Saudi Arabian mining assets was significantly below both (i) the undiscounted net cash flow estimates set forth in the Molinari estimates, and (ii) the value of the assets implied by the terms for the formation of AMAK; therefore we concluded that there was no impairment.
With reserve calculations remaining relatively consistent over time, and production costs remaining very near where they were in the previous studies, the only variable in the cash flow projections for the asset was the price of metals on the world market. The Company consistently had Molinari review projected cash flow based upon changing metal prices and any other changes in costs or reserves which we became aware of over time. The negotiation with the joint venture partners was based upon this basic information, and the fact that the Company simply did not have the financial resources to develop this asset to the point of operation without such partners’ contributions of cash, local knowledge and expertise. Our discussions with consultants in the mining industry suggest that a mining project would likely be profitable for 5-7 years out of any 10 year period. This was proven correct in the decade of 2000 to 2010 as world metal prices sunk to low points in the 2000-2002 era and again for a short period in 2008. This being the case, the likelihood of negative cash flows for the project was considered to be in the 30-40 percent range. During negotiations with the partners, we believed that with sufficient capital, the likelihood of success was in the 60-70 percent range. The cash flow estimates and worksheet showing estimated costs, including interest costs, have been displayed on our web site continuously since early 2008.
As discussed in our response to comment 9 below, we believe that it is proper to continue to account for our investment in AMAK on the cost method. This will confirm to you that we have, and will continue to, evaluate the investment for impairment on a regular basis in accordance with the guidance in ASC 353-20-35-2 (APB No. 18, paragraph 6(a)), and that we will also consider the guidance in ASC 970.323.35-12 (SOP 78-9, paragraph 20).
Messrs. H. Roger Schwall and Chris White
May 19, 2010
Page 11 of 17
|
9.
|
We note your responses to prior comments 10 and 11 in our letter dated February 23, 2010. Please provide to us a more detailed analysis of how you applied the provisions of ASC 323.10.05 and ASC 323.10.15 (APB 18, paragraphs 16 and 17) when you determined that you should not record your share of AMAK’s losses for the period of December 31, 2008 through August 2009, and that you should discontinue using the
|
equity method of accounting beginning in August 2009. We note that your 41% interest results in a presumption that you have the ability to exercise significant influence over AMAK. In this regard, please discuss with greater detail how you considered the guidance provided at ASC 323.10.15 (FIN 35); including the examples presented in paragraph ASC 323.10.15-10 (FIN 35, paragraph 4). Tell us the efforts you have made to obtain financial information from AMAK and what access you have or could obtain to AMAK’s books and records as a result of your 41% ownership and four members on AMAK’s Board of Directors.
We note that if access is available to you and equity method accounting is appropriate, you would be expected to have audited financial statements prepared for AMAK’s operations in accordance with US GAAP upon which to base your equity method accounting, whether for the period from formation of AMAK through August 2009 or for all periods, even if this requires doing so at your own cost. Equity method accounting would also necessitate disclosures in accordance with Regulation S-X, Rules 3-09 and 4-08(g). Please provide support for your assertion that AMAK meets the definition of a foreign business.
We also note that if cost method accounting was appropriately applied, it would be inappropriate to include mineral reserve and related disclosures regarding AMAK’s assets and operations in your Form 10-K, given your lack of significant influence over those assets and operations. In addition, if cost method accounting was appropriately applied, disclosures should be provided addressing why the company is not able to exert significant influence over AMAK’s operations and how, and the expected period over which, the company will be able to recover its investment.
Response:
AMAK’s Classification as a Foreign Business. As we explained to you during our May 10, 2010 conference call, we believe that AMAK meets the definition of a foreign business under Section 6110.3 of the Division of Corporation Finance Financial Reporting Manual for the following reasons:
|
|
-
|
all of AMAK’s assets and operations are in Saudi Arabia
|
|
|
-
|
as set forth below, at all times at least 50%, and now more than 50%, of the common stock of AMAK was held by foreign businesses or individuals
|
Messrs. H. Roger Schwall and Chris White
May 19, 2010
Page 12 of 17
|
Stockholder
|
Original ownership
|
Ownership since August 2009
|
Nature and location of stockholder
|
|
Arabian American Development Company
|
50%
|
41%
|
U.S. corporation
|
|
Mr. Mohammed Aballala(a)
|
16%
|
18.88%
|
Saudi citizen
|
|
Thamarat Najran Co. Ltd. (a)
|
4%
|
4.72%
|
Saudi corporation
|
|
Al-Sha’er Trading, manufacturing and Contracting Company
|
10%
|
11.80%
|
Saudi corporation
|
|
His Royal Highness Prince Nawaf Bin Mishel Bin Saud Al Saud
|
8%
|
9.44%
|
Saudi citizen and member of the Saudi royal family
|
|
Mr. Ibraheem Bin Ali Bin Hussain Musallam (b)
|
5%
|
5.90%
|
Saudi citizen
|
|
Mr. Majed Bin Ali Bin Hussain Musallam (b)
|
5%
|
5.90%
|
Saudi citizen
|
|
Mr. Amer Bin Ali Bin Amer Babtain
|
2%
|
2.36%
|
Saudi citizen
|
(a) Mr. Mohammed Aballala is the majority stockholder of Thamarat Najran Co. Ltd.
(b) Mr. Ibrahim Bin Ali Bin Hussain Musallam and Mr. Majed Bin Ali Bin Hussain Musallam are brothers.
|
|
-
|
as set forth below, the majority of the members of AMAK’s board of directors are not resident in, or citizens of, the United States
|
|
Name of director
|
Citizenship and residence
|
|
Directors appointed by Arabian American Development Company
|
|
|
Nicholas Carter
|
United States
|
|
Ghazi Sultan
|
Saudi Arabia
|
|
Robert Kennedy
|
United States
|
|
Allen McKee
|
United States
|
|
Directors appointed by Saudi investors
|
|
|
Dr. Talal Al Shair (a)
|
Saudi Arabia
|
|
Ibrahim Musallam
|
Saudi Arabia
|
|
Mohammed Aballala
|
Saudi Arabia
|
|
Ayman Al-Shibl
|
Saudi Arabia
|
(a) Dr. Shair is the chairman of the board of AMAK, and under AMAK’s by-laws casts a ninth, tie breaking vote in cases where the vote of the eight directors is tied.
Status of August 2009 Amendments to AMAK Documents
As we discussed with you on the phone on May 19, 2010, we want to be sure that you understand the status, under Saudi law, of the amendments to AMAK’s Articles of Association and by-laws that were agreed to among the stockholders in August 2009.
Although all of the amendments were agreed to by all of the stockholders of AMAK, under Saudi law the amendments will not become official until adopted until they are approved by the Ministry of Commerce of Saudi Arabia. That approval process requires that (i) the amendments be approved by AMAK’s stockholders at a special (extraordinary) stockholders’ meeting attended by representatives of the Ministry of Commerce, (ii) AMAK publishes a notice of the amendments which allows stockholders to file formal objections to the proposed amendments, and (iii) the Ministry of Commerce then review and approve the amendments, including the
Messrs. H. Roger Schwall and Chris White
May 19, 2010
Page 13 of 17
consideration of any objections raised by AMAK stockholders. AMAK has scheduled a stockholders’ meeting for June 2010 at which the approval of the amendments will be voted upon. Although these official requirements for the adoption of the amendments have not yet been completed, the Company believes that the amendments will be approved, and the Company and the Saudi investors have since August 2009 been conducting the affairs of AMAK pursuant to the proposed amendments.
In particular, we believe that it is highly unlikely that the Saudi authorities would object to amendments to AMAK’s governing documents in light of the facts that (i) all of the stockholders agreed to the amendments in August 2009, and thus will vote to approve the amendments at the required extraordinary meeting, and (ii) the amendments increase (rather than decrease) the ownership of the Saudi investors, and limit the period during which the foreign investor (our company), rather than the Saudi investors, has the right to appoint directors.
We intend to expand Note 8, as illustrated in Attachment F, to more fully describe the status of the amendments.
Application of Equity Accounting From December 31, 2008 to August 2009
As we explained to the staff in our phone call on May 10th, in applying the equity method of accounting for the period from December 31, 2008, until August 2009, at the time the Company prepared its 2009 financial statements (March 2010) the Company made its best estimate of AMAK’s net income or loss for that period, stated under U.S. generally accepted accounting principles (“U.S. GAAP”). In making that estimate, the Company relied on its knowledge of the activities and operations that had taken place at AMAK for the period December 31, 2008, to August 2009.
As disclosed in Note 8 to our 2009 financial statements, during the period from December 2008 until August 2009 we were aware that AMAK’s activities “during that period were the construction of facilities to begin the commercial development of the interests.” Accordingly, we concluded that virtually all of AMAK’s expenditures during that period were likely to be of the type capitalizable under U.S. GAAP and that our share of AMAK’s net income or loss for that period would be immaterial.
In May 2010 we received a draft of AMAK’s 2009 and 2008 financial statements prepared under generally accepted accounting principles in Saudi Arabia (“Saudi GAAP”) and stated in Saudi Riyals (“SR”). The financial statements were being audited by Deloitte & Touche Saudi Arabia under generally accepted auditing standards in Saudi Arabia (“Saudi GAAS”). Those draft financial statements indicate the following:
|
|
-
|
during the year ended December 31, 2009, there were under Saudi GAAP no items of income or expense. The draft financial statements state that “The Company has not yet commenced its commercial operations. The Company is not reporting a statement of income as no material expenses of a revenue nature were incurred during the period.”
|
|
|
-
|
for the year ended December 31, 2008, the only item of income or expense was an accrual for Zakat taxes of SR 1,965,000 (approximately $525,000). (We discuss below how we intend to account for our 50% share of this expense.) The Zakat tax is an “alms tax” (a tithe tax) levied upon Saudi corporations and individuals “of sufficient means.” The tax is not calculated on income, but rather is based on “wealth” as defined in the statutes with wealth derived from different types of assets taxed at different rates, and its
|
Messrs. H. Roger Schwall and Chris White
May 19, 2010
Page 14 of 17
| |
-
|
assessment derives from the Islamic laws requiring those of sufficient means to tithe. There was no Zakat tax for 2009 as AMAK’s “wealth,” as defined, was negative. Additionally, the Zakat tax is only assessed on the “wealth” attributable to the portion of a corporation owned by Saudi shareholders.
|
The draft financial statements indicate that during 2009 AMAK capitalized expenditures of approximately SR 116 million (approximately $30,972,000) as additions to property and equipment. The accounting policy stated in the draft financial statements is as follows:
“Pre-operating expenses consist of the incorporation costs incurred in setting up the Company and exploration costs. Incorporation costs are amortized using the straight line method over a period of 7 years. Exploration costs are expensed in the period incurred until a mine is identified as having economical development potential. Pre-operating costs incurred on mines that have economical development potential are deferred net of proceeds from the sale of any production during the development period and then amortized over the shorter of the expected life of the mine or a period of seven years. If a mine is no longer considered economical, the accumulated project costs are charged to the statement of income in the year in which the determination is made.”
With the exception of the accounting for the incorporation costs, we believe that the accounting policy stated above is similar to accounting that would be acceptable under U.S. GAAP. The organizational costs for AMAK, which would have to be expensed under U.S. GAAP, were mostly those incurred and contributed by our Company, and as we disclosed in Note 2 to our 2009 financial statements, we restated our 2008 financial statements to record in that year our 50% of those organizational costs.
You asked us to discuss the possibility that there were some costs of an administrative nature at AMAK that could not be capitalized under U.S. GAAP. To our knowledge, all of the employees at AMAK, except for a bookkeeper, have been directly involved in the development of the mine, and thus their salaries would be capitalized. In addition, we are not aware of any material expenditures for outside services in 2009 that did not relate to the mine development. With respect to AMAK’s accounting function, as we indicated to you in our prior letter, in 2009 AMAK’s accounting function consisted of one bookkeeper who functioned as a bill payer and check writer. While the costs associated with this function should be expensed under U.S. GAAP, we do not believe the costs for this one individual would be material.
Accordingly, we believe that we had a reasonable basis in March 2010 for our estimate that for the period December 31, 2008, to August 2009 our share of AMAK’s net income or loss would not be material, and we believe the additional information that has become available to us subsequent to the issuance of our 2009 financial statements supports our conclusion.
As discussed above, when we received the draft 2009 financial statements, we first learned that there had been a 2008 accrual for Zakat taxes of $525,000. We intend to record a charge for our 50% share of this ($262,500) in the second quarter of 2010 on the basis that our receipt of this information in that period (which information was not available when the 2008 financial statements were issued) causes us to revise our original estimate of our share of AMAK’s 2008 net income or loss. The notes to the financial statements for that Form 10-Q will include appropriate disclosures regarding the nature and effect of the revision of this estimate.
Messrs. H. Roger Schwall and Chris White
May 19, 2010
Page 15 of 17
August 2009 Change to the Cost Method of Accounting
As we discussed with you, we believe that our change in August 2009 from the equity method of accounting to the cost method of accounting is supported by both FIN 35, paragraph 4(d) and FIN 35, paragraph 4(c).
FIN 35, paragraph 4(d). Under paragraph 4(d) of FIN 35, the presumption that a holder of more than a 20% voting interest has significant influence is overcome if “The investor needs or wants more financial information to apply the equity method than is available to the investee's other shareholders (for example, the investor wants quarterly financial information from an investee that publicly reports only annually), tries to obtain that information, and fails.”
In addition, paragraph 4 of FIN 35 indicates that “It may be necessary to evaluate the facts and circumstances for a period of time before reaching a judgment.”
We explained to you that the by-laws (both the original by-laws and the by-laws as amended) of AMAK:
|
|
-
|
provide that the auditor shall audit the financial statements of AMAK and shall present the financial statements to AMAK’s annual meeting (Article 45); and
|
|
|
-
|
provide that the annual meeting shall be held within the first six months of the year (Article 33).
|
Thus, effectively the by-laws require that the audited financial statements for each December 31 fiscal year prepared under Saudi GAAP and audited under Saudi GAAS, be issued on or before June 30 of the following year.
The by-laws of AMAK do not provide our Company, either through our representatives on AMAK’s board, or as a stockholder of AMAK, the right to access the accounting or other financial records of AMAK.
As we explained, prior to this time our efforts and requests to have AMAK produce the financial statements (i.e., unaudited quarterly and audited annual financial statements prepared under U.S. GAAP and audited under U.S. GAAS) that we would need to apply the equity method of accounting have been informal and have not been responded to.
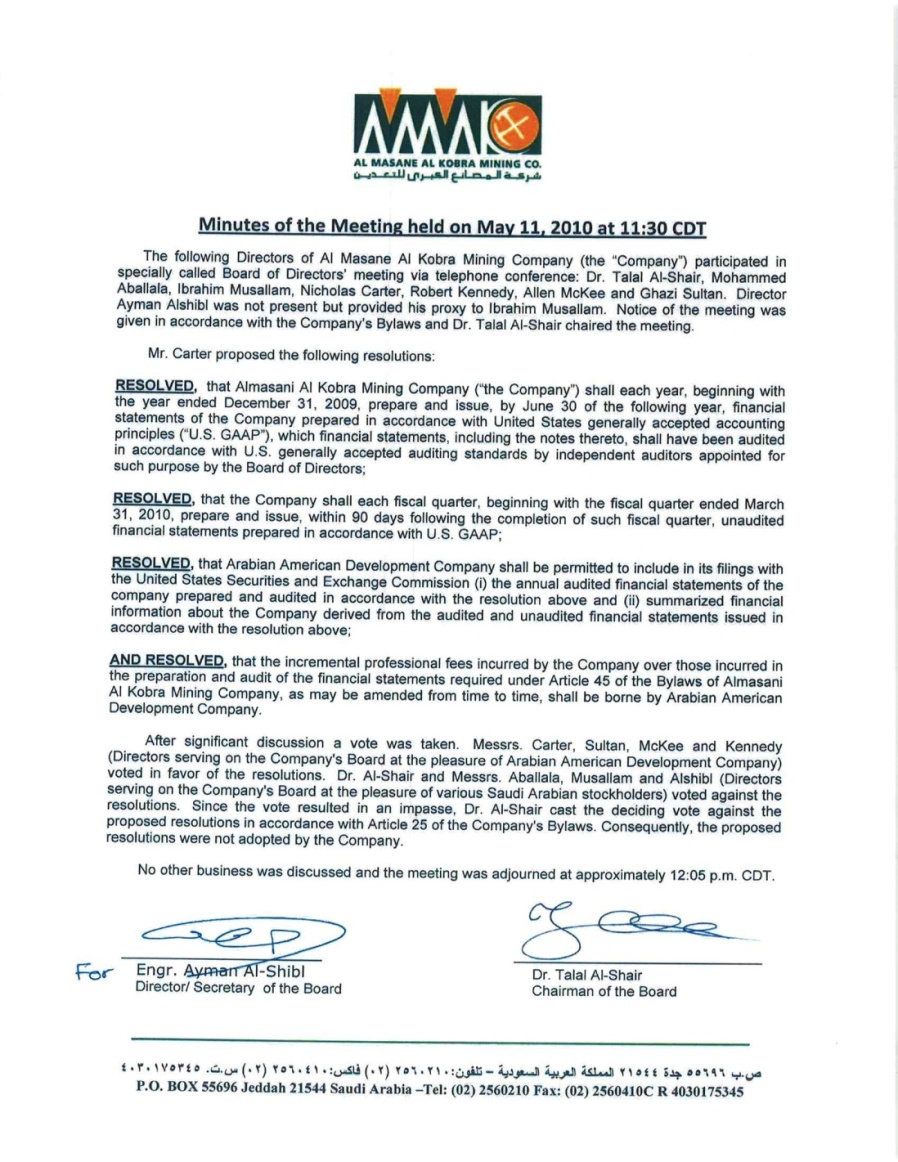
However, on May 11, 2010, our members of AMAK’s board of directors called for a meeting of the AMAK board, and at that meeting put forward the following resolutions:
RESOLVED, that Almasani Al Kobra Mining Company (“the Company”) shall each year, beginning with the year ended December 31, 2009, prepare and issue, by June 30 of the following year, financial statements of the Company prepared in accordance with United States generally accepted accounting principles (“U.S. GAAP”), which financial statements, including the notes thereto, shall have been audited in accordance with U.S. generally accepted auditing standards by independent auditors appointed for such purpose by the Board of Directors;
RESOLVED, that the Company shall each fiscal quarter, beginning with the fiscal quarter ended March 31, 2010, prepare and issue, within 90 days following
Messrs. H. Roger Schwall and Chris White
May 19, 2010
Page 16 of 17
the completion of such fiscal quarter, unaudited financial statements prepared in accordance with U.S. GAAP;
RESOLVED, that Arabian American Development Company shall be permitted to include in its filings with the United States Securities and Exchange Commission (i) the annual audited financial statements of the Company prepared and audited in accordance with the resolution above and (ii) summarized financial information about the Company derived from the audited and unaudited financial statements issued in accordance with the resolution above;
AND RESOLVED, that the incremental professional fees incurred by the Company over those incurred in the preparation and audit of the financial statements required under Article 45 of the Bylaws of Almasani Al Kobra Mining Company, as may be amended from time to time, shall be borne by Arabian American Development Company.
The four directors appointed by us voted in favor of these resolutions while the four directors appointed by the Saudi stockholders voted against the resolutions. Under AMAK’s by-laws, a ninth tie breaking vote was then granted to the chairman of the AMAK directors, Dr. Talal Al Shair, who voted against the resolutions. The resolutions were thus defeated. A copy of the minutes of this meeting, signed by the Chairman and Secretary of the Board of AMAK, are attached as Attachment E.
FIN 35, paragraph 4(c). Paragraph 4(c) of FIN 35 provides that the presumption that a holder of more than a 20% voting interest has significant influence would be overcome if “Majority ownership of the investee is concentrated among a small group of shareholders who operate the investee without regard to the views of the investor.”
As we explained to you on May 10th, we believe that these circumstances exist. Due to the unique business, regulatory and cultural environments in Saudi Arabia, we have found that we are totally dependent on the efforts of the Saudi investors to move the development of the mining project forward through regulatory and financing processes. As a result, we have found that it is unwise to openly disagree with the Saudi investors when they have expressed a unified view as to a course of action.
We describe to you the following examples of this:
|
|
-
|
when the AMAK Board selected an auditor, we believed that either Moore Stephens, because it was the Travis Wolff affiliate, or KPMG, because of its experience auditing mining operations, would be the best choices. Notwithstanding, the Saudi directors selected Deloitte due to prior experience with that firm without even a formal vote on the Moore Stephens or KPMG firms.
|
|
|
-
|
AMAK had contracted with a Chinese firm for the construction of certain underground facilities preparatory to the production of ore. While that firm was selected, the Saudi directors believed that it should work under the direction of a Saudi general contractor, and took that course of action notwithstanding our stated position that the Chinese firm was well qualified to do the work and did not need a supervising general contractor.
|
We noted to you that we had found another company which cited such factors in supporting its use of the cost accounting method where it held a voting interest in excess of 20%. Specifically, Celanese Corporation states on page 92 of its 2009 Form 10-K that:
Messrs. H. Roger Schwall and Chris White
May 19, 2010
Page 17 of 17
“Certain investments where the Company owns greater than a 20% ownership interest are accounted for under the cost method of accounting because the Company cannot exercise significant influence over these entities. The Company determined that it cannot exercise significant influence over these entities due to local government investment in and influence over these entities, limitations on the Company’s involvement in the day-to-day operations and the present inability of the entities to provide timely financial information prepared in accordance with US GAAP.”
As the result of the facts and circumstances described above, we believe that it was proper to change from the equity method to the cost method to account for our investment in AMAK in August 2009.
Conclusion regarding the use of the cost method. As a result of the above, we believe that the conditions of paragraph 4(d) of FIN 35 are present. We also believe, as we discussed with you, that the condition of paragraph 4(d) of FIN 35 is generally determinative that equity method accounting cannot be applied, and you did not object to that position.
Changes to Item 1 – Business
In accordance with your request, we have revisited the nature of the disclosures regarding AMAK contained in Part I, Item 1 of our 2009 Form 10-K and we are making appropriate revisions to reflect the fact that we lack any significant influence over the operations of AMAK and that we are dependent on the efforts of the Saudi investors for the success of the project.
Changes to Note 8 to the Financial Statements
In order to more clearly state the rational for our change to the cost method of accounting in August 2009 (based on the facts available to us the time our 2009 financial statements were originally issued and without reference to subsequent events), we plan to make small changes to Note 8 to our financial statements. A draft of those changes is attached as Attachment F.
The Company hereby acknowledges that it is responsible for the adequacy and accuracy of the disclosure in the filing; that SEC staff comments or changes to disclosure in response to staff comments do not foreclose the SEC from taking any action with respect to the filing; and the Company may not assert staff comments as a defense in any proceeding initiated by the SEC or any person under the federal securities laws of the United States.
Thank you for your consideration.
Sincerely,
/s/ Connie Cook
Connie Cook
Chief Accounting Officer
ATTACHMENT A
(Response to SEC Question No. 2)
Item 11. Executive Compensation
Report of the Compensation Committee
The Compensation Committee has reviewed and discussed with management the following Compensation Discussion and Analysis. Based on such review and discussion, the Compensation Committee has recommended to the Board of Directors that the following Compensation Discussion and Analysis be included in the Form 10-K for the year ended December 31, 2009.
Members of the Compensation Committee
Allen P. McKee, Chairman
Robert Kennedy
Ghazi Sultan
Mohammed Al-Omair
Compensation Discussion and Analysis
Introduction
This discussion presents the principles underlying our executive officer compensation program. Our goal in this discussion is to provide the reasons why we award compensation as we do and to place in perspective the data presented in the tables that follow this discussion. The focus is primarily on compensation of our executive officers for the fiscal year ended December 31, 2009, but some historical and forward-looking information is provided to put such year’s compensation information in context. The information presented herein relates to Nicholas N. Carter, our Chief Executive Officer since July 1, 2009, Connie Cook, our Chief Accounting Officer, Mark Williamson, our Vice-President of Marketing, and our two other most highly compensated employees, who are sometimes referred to in this Form 10-K as our “Executives.” For purposes of this discussion, we did not include Mr. El-Khalidi as an Executive due to his retirement from the Chief Executive Officer position on June 30, 2009.
It is the intent of the Board that the salaries and other compensation of the executives of the Company will be recommended to the Board for action at least once annually and will be based upon competitive salaries and financial performance of the Company. The Compensation Committee has overall responsibility for the approval, evaluation and oversight of all of the Company’s compensation plans. The Committee’s primary purpose is to assist the Company’s Board in the discharge of its fiduciary responsibilities relating to fair and competitive compensation. The Compensation Committee meets in the fourth quarter of each year to review the compensation program and to determine compensation levels for the ensuing fiscal year and at other times as required.
Objectives of the Compensation Programs
The compensation programs of the Company are designed to attract and retain qualified individuals upon whom the sustained progress, growth, profitability, and value of the Company depend. It is the plan of the Board that through the Compensation Committee, the Company will develop and implement compensation policies, plans and programs to further these goals by rewarding executives for positive financial performance. Management provides recommendations regarding executive compensation to the Compensation Committee. The Company’s executive compensation program is intended to align the interests of its management team with those of its shareholders by motivating the Executives to achieve strong financial and operating results for the Company, which it believes closely correlates to long–term shareholder value. In addition, the Company’s program is designed to achieve the following objectives:
|
|
• attract and retain talented Executives by providing reasonable total compensation levels competitive with that of executives holding comparable positions in similarly situated organizations;
|
• provide total compensation that is justified by individual performance;
|
|
• provide performance–based compensation that balances rewards for short–term and long–term results and is tied to both individual and the Company’s performance; and
|
|
|
• encourage the long–term commitment of our Executives to the Company and its shareholders’ long–term interests.
|
What the Compensation Programs are Designed to Reward
The compensation programs are designed to reward performance that contributes to the achievement of the Company’s business strategy on both a short–term and long–term basis. In addition, the Company rewards qualities that it believes help achieve its strategy such as teamwork; individual performance in light of general economic and industry specific conditions; performance that supports the Company’s core values; resourcefulness; the ability to manage existing assets; the ability to explore new avenues to increase profits, level of job responsibility; and tenure. The Company does not currently engage any consultant related to executive and/or director compensation matters, although the Company is currently soliciting proposals from various compensation consultants located in the Houston, Texas area for assistance in 2010 and future years.
Elements of the Company’s Compensation Program and Why It Pays Each Element
To accomplish its objectives, the Company seeks to offer a total direct compensation program to its Executives that, when valued in its entirety, serves to attract, motivate and retain executives with the character, experience and professional accomplishments required for the Company’s growth and development. The Company’s compensation program is comprised of four elements:
• base salary;
• incentive compensation;
• stock option plan; and
• benefits.
Base Salary.
We pay our Executives a base salary, which we review and determine annually. We believe that a competitive base salary is a necessary element of any compensation program. We believe that attractive base salaries can motivate and reward the Executives for their overall performance. Base salaries are established in part based on the particular executive’s position, responsibility, experience, skills and expected contributions during the coming year and such individual’s performance during the prior year. We also have sought to align base compensation levels comparable to our competitors and other companies of similar size. We do not view base salaries as primarily serving our objective of paying for performance, but in attracting and retaining the most qualified executives necessary to run the Company’s business. The base salaries of our Executives have been subject to a standard cost of living increase annually over the past several years at the same rate as other Petrochemical Segment employees. In 2009, we gave all employees of the Company, including the Executives, a 4 percent cost of living adjustment. In addition, Mr. Carter’s annual salary was increased to $250,000 effective July 1, 2009, due to his promotion to Chief Executive Officer.
Cash Incentive Bonuses.
The primary objective of our annual cash incentive bonus program is to motivate and reward our Executives for meeting our short-term objectives using a pay-for-performance program with objectively determinable performance goals. Executives are eligible to receive a cash incentive bonus under the 2009 Executive Cash Bonus Plan (“CBP”), which was recommended and adopted by the Compensation Committee. The objectives of the CBP are to align the interests of the Executives with the Company’s annual performance goals. The CBP focuses on rewarding executives for the achievement of annual financial objectives with competitive financial incentives, and provides a systemic plan for establishing definitive performance goals. The Company’s performance goals are based on growth in income before tax expense (“IBT”). Executives will be awarded cash bonus compensation based on the Company’s annual results in this area. Target awards and weightings may be modified by the Compensation Committee during the plan year based upon a shift in focus or changing industry standards, or any other factors that the Compensation Committee deems appropriate. The Compensation Committee has the authority to administer the CBP and has the final decision on any discrepancies in interpretation of the CBP.
The amount of money, if any, in the CBP will be calculated based on the overall level of achievement with respect to IBT. Any awards are paid after completion of the Company’s audited financial statements for the applicable year. Participants will not be entitled to receive an award unless they are employed by the Company at the end of the applicable plan year and at the time the award is paid by the Company.
The performance objective for earning an award under the CBP relates to the Company’s IBT. The Company’s IBT is required to exceed $10 million (the “Threshold Amount”) in order for funds to be allocated to the CBP. The amount allocated to the CBP is approximately 1.0 percent of IBT which is based primarily on historical levels of cash bonuses given to Executives since 2005 (the “base year”). The Compensation Committee then typically allocates approximately 40-50 percent of the CBP, if any, as a cash bonus award to the Chief Executive Officer. The Chief Executive Officer then submits recommendations to the Compensation Committee regarding division of the remainder of the CBP between the other Executives as cash bonus awards.
For the fiscal year ended December 31, 2009, the amount allocated to the CBP was $130,000, which was paid to our Executives as cash bonuses in the first quarter of calendar year 2010.
Equity Compensation.
We believe that stock options are an important long-term incentive for our Executives and that our stock option program has been effective in aligning executive interests with those of our stockholders. We review our equity compensation plans annually. The Executives are eligible for annual stock option grants based on targeted levels. These options are intended to produce value for each Executive if (i) our stockholders derive significant sustained value and (ii) the Executive remains employed with us.
In 2009 the Company did not have any program, plan or obligation under which it was required to grant equity compensation to any Executive on specified dates or upon the achievement of certain performance goals. The Company’s 2008 Stock Option Plan for Key Employees governs discretionary stock option grants to Executives. The authority to make equity grants to Executives rests with the Compensation Committee, although, as noted, the Compensation Committee does consider the recommendations of our Chief Executive Officer in setting the compensation of our other Executives. No stock option grants were awarded during the year ended December 31, 2009. Stock options were awarded during the first quarter of 2010 based on 2009 results and the results of an informal peer group analysis conducted by the Compensation Committee. Stock option awards vest over time, whereby, in each case, 100% percent of the award will vest two years from the date of grant and the options expire seven years from the date of grant.
As noted previously, on June 30, 2009, Mr. El-Khalidi retired as Chief Executive Officer of the Company. On July 2, 2009, the Board of Directors considered Mr. El-Khalidi’s efforts related to the Al Masane mining project in southwestern Saudi Arabia in conjunction with his retirement. The Board determined
that the Company should issue two options to purchase a total of 400,000 shares to Mr. El-Khalidi, tied to the performance of AMAK. The rationale for the grant of these two options was based on the fact that virtually all of Mr. El-Khalidi’s career was spent working on the mining project in Saudi Arabia under difficult conditions and the Board believed a substantial award was justified in light of his relatively low salary of $72,000 per annum. To achieve a linkage of the value of the award to the ultimate success of the Saudi Arabian mining project, the Board of Directors made the options contingent upon the occurrence of the following conditions which are explicitly tied to the performance of AMAK: (i) the first option for 200,000 shares cannot be exercised until such time as the first shipment of ore from the mining project is transported for commercial sale by AMAK and the option terminates if not exercised by June 30, 2012, and (ii) the second option for 200,000 shares cannot be exercised until such time as the Company receives its first cash dividend distribution from AMAK and the option terminates if not exercised by June 30, 2019.
Perquisites.
The Company provides benefits to all employees that it believes are standard in the industry. These benefits consist of a group medical and dental insurance program for employees and their qualified dependents, group life insurance for employees and their spouses, accidental death and dismemberment coverage for employees, a Company sponsored cafeteria plan and a 401(k) employee savings and investment plan. The Company matches employee deferral amounts, including amounts deferred by named executive officers, up to a total of 6% of the employee’s eligible salary, excluding annual cash bonuses, subject to certain regulatory limitations. Our use of perquisites as an element of compensation is very limited. We do not view perquisites as a significant element of our comprehensive compensation structure.
The Compensation Committee Process
Compensation Committee meetings typically involve a preliminary discussion with our Chief Executive Officer prior to the Compensation Committee deliberating without any members of management present. For compensation decisions, including decisions regarding the grant of stock options relating to executive officers (other than our Chief Executive Officer); the Compensation Committee considers the recommendations of our Chief Executive Officer and includes him in its discussions.
Peer Group
As noted, the Compensation Committee utilized a small peer group of similarly sized companies as a reference for determining competitive total compensation packages for our Executives. For 2009 compensation, this peer group consisted of the following companies:
Crosstex
Global Partners
Rentech
KMG Chemical
Syntroleum
Penford Corp
Adams Resources & Energy Inc.
Synthesis Energy
American Pacific Corporation
Sulphco Inc.
Sterling Chemicals Inc.
Regulatory Considerations
We account for the equity compensation expense for our employees under the rules of Financial Accounting Standards Board (FASB) Accounting Standards Codification (ASC) Topic 718 (“ASC 718”), which requires us to estimate and record an expense for each award of equity compensation over the service period of the award. Accounting rules also require us to record cash compensation as an expense at the time the obligation is accrued.
Employment Arrangements
The Company has not entered into definitive employment agreements with any of its executive officers. All executive officers serve at the discretion of the Board with no fixed term of employment.
Cash and Other Compensation
South Hampton’s profit sharing program is available to all employees based upon South Hampton’s quarterly performance. Since South Hampton is located about an hour north of a larger petrochemical sector, competition for qualified, intelligent, conscientious employees is high. Base pay for employees is typically about 20% less than larger facilities; however, the profit sharing program allows South Hampton to compensate employees with additional pay when profits are sound. It also enables South Hampton the ability to forego payments during times of economic slowdown. There is no set formula for calculating profit sharing as it is based upon several factors including profit, cash flow, expectations and special cash needs of South Hampton and the Company.
The following table, which should be read in conjunction with the explanations provided above, sets forth summary compensation information for the year ended December 31, 2009 for the Company’s (i) Chief Executive Officer, (ii) Chief Accounting Officer, and (iii) each of the Company’s three most highly compensated executives other than the Chief Executive Officer and the Chief Accounting Officer who were serving as executive officers of the Company as of December 31, 2009.
2009 Summary Compensation Table
|
Name and
Principal Position
|
Year
|
|
Salary
($)
|
|
|
Bonus
($)(1)
|
|
|
Profit Sharing
($)
|
|
|
Restricted
Stock
Award(s)
($)
|
|
|
Option Award(s)
($)(2)
|
|
|
All Other
Compensation
($) (3)(4)(5)
|
|
|
Total ($)
|
|
|
Hatem El Khalidi
President and Chief
Executive Officer until June 30, 2009, Director
|
2009
|
|
$ |
36,000 |
|
|
$ |
31,500 |
|
|
|
-- |
|
|
|
-- |
|
|
$ |
186,288 |
|
|
$ |
40,000 |
|
|
$ |
293,788 |
|
|
2008
|
|
$ |
72,000 |
|
|
|
-- |
|
|
|
-- |
|
|
|
-- |
|
|
|
-- |
|
|
$ |
8,000 |
|
|
$ |
80,000 |
|
|
2007
|
|
$ |
72,000 |
|
|
|
-- |
|
|
|
-- |
|
|
|
-- |
|
|
|
-- |
|
|
$ |
8,000 |
|
|
$ |
80,000 |
|
|
Nicholas N. Carter President and Chief
Executive Officer since July 1, 2009; previously
Executive Vice President and Chief Operating Officer
|
2009
|
|
$ |
234,837 |
|
|
$ |
60,000 |
|
|
$ |
42,552 |
|
|
|
-- |
|
|
|
-- |
|
|
$ |
14,090 |
|
|
$ |
351,479 |
|
|
2008
|
|
$ |
209,918 |
|
|
|
-- |
|
|
$ |
28,665 |
|
|
$ |
99,800 |
|
|
|
-- |
|
|
$ |
12,595 |
|
|
$ |
350,978 |
|
|
2007
|
|
$ |
172,059 |
|
|
$ |
50,000 |
|
|
$ |
46,506 |
|
|
$ |
66,000 |
|
|
|
-- |
|
|
$ |
10,324 |
|
|
$ |
344,889 |
|
|
Connie J. Cook
Chief Accounting Officer
|
2009
|
|
$ |
142,208 |
|
|
$ |
30,000 |
|
|
$ |
32,715 |
|
|
|
-- |
|
|
|
-- |
|
|
$ |
8,533 |
|
|
$ |
213,456 |
|
|
2008
|
|
$ |
133,009 |
|
|
|
-- |
|
|
$ |
26,143 |
|
|
$ |
49,900 |
|
|
|
-- |
|
|
$ |
7,981 |
|
|
$ |
217,033 |
|
|
2007
|
|
$ |
108,500 |
|
|
$ |
25,000 |
|
|
$ |
45,085 |
|
|
$ |
33,000 |
|
|
|
-- |
|
|
$ |
6,510 |
|
|
$ |
218,095 |
|
|
Mark D. Williamson
Vice President of Marketing, Petrochemical Company
|
2009
|
|
$ |
227,500 |
|
|
$ |
40,000 |
|
|
$ |
32,652 |
|
|
|
-- |
|
|
|
-- |
|
|
$ |
13,650 |
|
|
$ |
313,802 |
|
|
2008
|
|
$ |
240,705 |
|
|
|
-- |
|
|
$ |
26,143 |
|
|
$ |
49,900 |
|
|
|
-- |
|
|
$ |
14,442 |
|
|
$ |
331,190 |
|
|
2007
|
|
$ |
190,393 |
|
|
$ |
25,000 |
|
|
$ |
45,023 |
|
|
|
-- |
|
|
|
-- |
|
|
$ |
11,424 |
|
|
$ |
271,840 |
|
|
Gerardo Maldonado,
Account Representative,
Petrochemical
Company
|
2009
|
|
$ |
192,543 |
|
|
|
-- |
|
|
$ |
24,437 |
|
|
|
-- |
|
|
|
-- |
|
|
$ |
11,553 |
|
|
$ |
228,533 |
|
|
2008
|
|
$ |
179,158 |
|
|
|
-- |
|
|
$ |
14,640 |
|
|
|
-- |
|
|
|
-- |
|
|
$ |
10,749 |
|
|
$ |
204,547 |
|
|
2007
|
|
$ |
142,443 |
|
|
|
-- |
|
|
$ |
24,327 |
|
|
|
-- |
|
|
|
-- |
|
|
$ |
8,546 |
|
|
$ |
175,316 |
|
|
Marvin Kaufman
Manager of
Manufacturing,
Petrochemical
Company
|
2009
|
|
$ |
130,532 |
|
|
|
-- |
|
|
$ |
21,910 |
|
|
|
-- |
|
|
|
-- |
|
|
$ |
7,832 |
|
|
$ |
160,274 |
|
|
2008
|
|
$ |
122,603 |
|
|
|
-- |
|
|
$ |
13,110 |
|
|
|
-- |
|
|
|
-- |
|
|
$ |
7,356 |
|
|
$ |
143,069 |
|
|
2007
|
|
$ |
112,534 |
|
|
|
-- |
|
|
$ |
21,526 |
|
|
|
-- |
|
|
|
-- |
|
|
$ |
6,752 |
|
|
$ |
140,812 |
|
|
(1)
|
Includes $31,500, $0 and $0 in retirement bonus compensation for the fiscal years ended December 31, 2009, 2008, and 2007, respectively, that was deferred at the election of Mr. El Khalidi. All present deferred compensation owing to Mr. El Khalidi aggregating $31,500 is considered, and future deferred compensation owing to Mr. El Khalidi, if any, will be considered payable to Mr. El Khalidi on demand.
|
|
(2)
|
Restricted stock option awards include the aggregate grant date fair value of such awards granted in the fiscal year indicated computed in accordance with ASC 718. For a discussion of the assumptions we made in valuing the stock and option awards, see “Note B (17)—Significant Accounting Policies—Stock-Based Compensation” and “Note (H)—Stock-Based Compensation” in the notes to our consolidated financial statements contained in our Annual Report on Form 10-K for the fiscal year ended December 31, 2009.
|
|
(3)
|
Includes $4,000, $8,000, and $8,000 in termination benefits for each of the fiscal years ended December 31, 2009, 2008, and 2007, respectively, that was accrued for Mr. El Khalidi in accordance with Saudi Arabian employment laws. The total amount of accrued termination benefits due to Mr. El Khalidi as of December 31, 2009, was $42,878.
|
|
(4)
|
Includes $36,000, $0, and $0 in accrued retirement benefits for each of the fiscal years ended December 31, 2009, 2008, and 2007, respectively, that was deferred at the election of Mr. El Khalidi. The total amount of accrued retirement benefits due to Mr. El Khalidi as of December 31, 2009, was $36,000.
|
|
(5)
|
Includes amounts as shown for Executives that were contributed on the employee’s behalf into the Company’s 401(k) plan. Mr. El-Khalidi did not participate in the Company’s 401(k) plan.
|
| |
|
| |
|
Grants of Plan-Based Awards
The following table presents information concerning plan-based awards granted to each of the named executive officers during 2009.
| |
|
Estimated Future Payouts Under Non-Equity Incentive Plan Awards
|
Estimated Future Payouts under Equity Incentive Plan Awards
|
|
|
|
|
|
|
|
|
|
|
|
|
Name
|
Grant
Date
|
Threshold
($)
|
Target
($)
|
Maximum
($)
|
Threshold
(#)
|
Target
(#)
|
Maximum
(#)
|
All Other Stock Awards: Number of Shares of Stock or
Units (#)
|
|
All Other Options Awards: Number of Securities
(#)(1)
|
|
|
Exercise Price of Options ($/sh)
|
|
|
Closing Market Price on Date of Option Grant ($/sh)
|
|
Grant Date Fair Value of Stock Awards
|
|
Hatem
El Khalidi
|
07/02/09
|
|
|
|
|
|
|
|
|
|
200,000
|
|
|
$
|
3.40
|
|
|
$
|
3.40
|
|
|
|
Hatem
El Khalidi
|
07/02/09
|
|
|
|
|
|
|
|
|
|
200,000
|
|
|
$
|
3.40
|
|
|
$
|
3.40
|
|
|
_________________________
|
(1)
|
Represents conditional stock option grants made on July 2, 2009 as follows: (a) an option to purchase 200,000 shares of the Company’s common stock with an exercise price equal to the closing sale price of such a share as reported on the Nasdaq National Market System on July 2, 2009, provided that said option may not be exercised until such time as the first shipment of ore from the Al Masane mining project is transported for commercial sale by AMAK, and further that said option terminates and is immediately forfeited if not exercised on or before June 30, 2012; and (b) an option to purchase 200,000 shares of the Company’s common stock with an exercise price equal to the closing sale price of such a share as reported on the Nasdaq Stock Market on July 2, 2009, provided that said option may not be exercised until such time as the Company receives its first cash dividend distribution from AMAK, and further that said option terminates and is immediately forfeited if not exercised on or before June 30, 2019.
|
Outstanding Equity Awards at 2009 Fiscal Year-End
The following table presents information concerning outstanding equity awards held by the named executive officers as of December 31, 2009.
| |
|
Option awards
|
Stock awards
|
|
Name
|
|
Number of Securities Underlying Unexercised Options
(#) Exercisable
|
|
|
Number of Securities Underlying Unexercised Options
(#) Unexercisable
|
|
|
Equity incentive plan awards: number of securities underlying unexercised unearned options
(#)
|
|
|
Option exercise price
($)
|
|
Option Expiration date
|
Number of Shares or units of stock that have not vested
(#)
|
Market value of shares or unites of stock that have not vested
(#)
|
Equity incentive plan awards: number of unearned shares, units or other rights that have not vested (#)
|
Equity incentive plan awards: market or payout value of unearned shares, units or other rights that have not vested
($)
|
|
Hatem
El Khalidi
|
|
|
--
|
|
|
|
200,000
|
|
|
|
--
|
|
|
$
|
3.40
|
|
06/30/12
|
|
|
|
|
|
Hatem
El Khalidi
|
|
|
--
|
|
|
|
200,000
|
|
|
|
--
|
|
|
$
|
3.40
|
|
06/30/19
|
|
|
|
|
Director Compensation
The following table provides a summary of compensation paid to members of our Board during the year ended December 31, 2009.
2009 Non-Employee Director Compensation
|
Name
|
|
Fees Earned or
Paid in Cash
($)(1)
|
|
|
Stock Awards
($)(2)
|
|
|
Option
Awards
($)(3)
|
|
|
Total
($)
|
|
| |
|
|
|
|
|
|
|
|
|
|
|
|
|
Robert Kennedy
|
|
$
|
74,000
|
|
|
$
|
10,200
|
|
|
$
|
9,730
|
|
|
$
|
93,930
|
|
|
Ghazi Sultan
|
|
|
10,000
|
|
|
|
10,200
|
|
|
|
9,730
|
|
|
|
29,930
|
|
|
Mohammed Al Omair
|
|
|
25,000
|
|
|
|
10,200
|
|
|
|
9,730
|
|
|
|
44,930
|
|
|
Ibrahim Al-Moneef (resigned April 2009)
|
|
|
--
|
|
|
|
--
|
|
|
|
9,730
|
|
|
|
9,730
|
|
|
Charles Goehringer, Jr.
|
|
|
10,000
|
|
|
|
10,200
|
|
|
|
9,730
|
|
|
|
29,930
|
|
|
Allen McKee (appointed April 2009)
|
|
|
2,500
|
|
|
|
--
|
|
|
|
--
|
|
|
|
2,500
|
|
____________________________
|
(1)
|
Includes committee fees for 2008 in the amount of $70,000, subsidiary board fees for 2008 in the amount of $5,000, subsidiary board fees for 2009 in the amount of $36,000 and per diem amounts for 2009 in the amount of $10,500.
|
|
(2)
|
Represents 3,000 shares of restricted stock granted to each non-employee director for 2008 Board service at $3.40 per share based upon the closing price of the Company’s common stock on the grant date of September 1, 2009.
|
|
(3)
|
Represents 7,000 shares of stock options granted to each non-employee director for 2008 Board service at an exercise price of $1.39 per share based upon the closing price of the Company’s common stock on the grant date of January 2, 2009.
|
General
A director who is one of our employees receives no additional compensation for his service as a director or as a member of a committee of the Board. A director who is not one of our employees (a non-employee director) receives compensation for his or her services as described in the following paragraphs per the current policy and upon recommendation by the Compensation Committee and approval by the Board. Directors are reimbursed for reasonable expenses incurred in connection with attendance at Board and Committee meetings.
Equity Compensation
The 2009 directors’ fees policy as recommended by the Compensation Committee proposed the grant of 3,000 shares of restricted stock and 7,000 shares in options to be awarded in the first quarter of 2010 to non-employee directors who had attended at least 75% of all called meetings in 2009 and were serving in full capacity on December 31, 2009. This grant is to be prorated based upon time of service. This grant was approved on January 28, 2010 by the Board of Directors and will be recognized on that date.
Committee Compensation
The 2009 directors’ fees policy as recommended by the Compensation Committee proposed cash payments for members of the Audit Committee in the amount of $15,000, the Compensation Committee in the amount of $5,000, and the Nominating Committee in the amount of $5,000. These amounts are to be prorated based upon time of service. These payments were approved by the Board on January 28, 2010, and approximately $92,000 was accrued as directors’ compensation expense for 2009.
Subsidiary Board Compensation
The 2009 directors’ fees policy as recommended by the Compensation Committee proposed cash payments for members of the subsidiary boards of the Company in the amount of $5,000 for U.S. subsidiaries and $5,000 for AMAK’s Board. These amounts are to be prorated based upon time of service. These payments were approved by the Board on January 28, 2010, and approximately $6,900 was accrued as directors’ compensation expense for 2009. In addition, Robert Kennedy was paid $36,000 in 2009 for serving on the Board of TOCCO.
Per Diem Compensation
The 2009 directors’ fees policy allowed per diem payments of $500 per day for non-employee directors who travel to conduct Board business. Approximately $10,500 was paid for directors’ compensation expense related to per diem in 2009.
Potential Payments Upon Termination or Change in Control
There are no potential payments owed to our executives based upon termination of employment or change in control of the Company.
Compensation Committee Interlocks and Insider Participation
No member of the Compensation Committee is or has been an executive officer of our Company or had any relationships requiring disclosure by us under the SEC’s rules requiring disclosure of certain relationships and related-party transactions. None of our executive officers served as a director or a member of a compensation committee (or other committee serving an equivalent function) of any other entity, the executive officers of which served as a director or member of the Compensation Committee during the fiscal year ended December 31, 2009.
ATTACHMENT B
(Response to SEC Question No. 3)
Credit Agreement
On May 25, 2006, our wholly-owned subsidiary South Hampton entered into a Credit Agreement, as amended, with Bank of America. We were in compliance with all of our financial covenants as of December 31, 2009 under the Credit Agreement. All of our obligations under the Credit Agreement are fully and unconditionally secured pursuant to a perfected first priority security interest on all of South Hampton’s assets. As of December 31, 2009, the Credit Agreement provided for an aggregate principal amount of up to $32 million available through the following facilities: (i) $18 million revolving credit facility which includes a $3 million sublimit for use in the hedging program and a sublimit of $9 million for the issuance of standby or commercial letters of credit; and (ii) $14 million term loan (advanced as a $10 million loan and a $4 million loan). The revolving credit facility matures on June 30, 2011 and term loan matures on October 31, 2018.
Under the terms of the Credit Agreement, accrued and unpaid interest is due and payable in arrears on the first business day of each month on any outstanding borrowings at the lower of: (i) the higher of the federal funds rate plus 0.50% or the prime rate plus applicable margin, or (ii) the rate equal to the British Bankers Association LIBOR plus the applicable margin. The applicable margin is determined from TOCCO’s most recent compliance certificate and current financials based on the following:
|
Level
|
Leverage Ratio
|
Applicable Margin for Base Rate Loans
|
Applicable Margin for LIBOR Loans
|
Applicable Margin for Commitment Fee
|
|
I
|
Greater than or equal to 1.5:1.0
|
(0.50%)
|
2.00%
|
0.25%
|
|
II
|
Less than 1.5:1.0 but greater than or equal to 1.0:1.0
|
(0.75%)
|
1.75%
|
0.25%
|
|
III
|
Less than 1.0:1.0
|
(1.00%)
|
1.50%
|
0.25%
|
We entered into an interest rate swap agreement in March 2008 with respect to the $10.0 million floating rate term loan under the credit facility. The Company receives credit for payments of interest made on the term loan based upon LIBOR and pays Bank of America an interest rate of 5.83% less the credit on the interest rate swap. The swap agreement terminates on December 15, 2017. Our average floating interest rate on debt outstanding under our credit facility at December 31, 2009, was 3.0%. The Credit Agreement includes customary representations and warranties made by us to Bank of America.
The Credit Agreement contains customary, affirmative and negative covenants requiring us to take certain actions and restricting us from taking others. Such covenants include but are not limited to:
|
●
|
Delivery of financial statements and SEC filings;
|
| |
|
|
●
|
Maintenance of properties and insurance;
|
| |
|
|
●
|
Compliance with laws;
|
| |
|
|
●
|
Receipt of guarantees from any new subsidiary to guarantee and secure obligations;
|
| |
|
|
●
|
Prohibiting the disposition of assets and changing material lines of business;
|
| |
|
|
●
|
Changing its method of accounting or policies;
|
| |
|
|
●
|
Restricting certain payments, including dividends;
|
| |
|
|
●
|
Use of loan proceeds only for certain purposes;
|
| |
|
|
●
|
Payment of all insurance and eminent domain proceeds to Bank of America;
|
| |
|
|
●
|
Limiting the occurrence of liens, certain investments, and/or subsidiary indebtedness (subject to certain exceptions);
|
| |
|
|
●
|
Payment on demand of all reasonable costs, expenses and fees incurred by Bank of America; and
|
| |
|
|
●
|
Restricting extension of credit other than for certain permitted exceptions;
|
In addition the Credit Agreement contains certain financial covenants, which include but are not limited to:
|
●
|
Maintaining a minimum EBITDA of $8.5 million at end of each trailing four fiscal quarter period;
|
| |
|
|
●
|
Maintaining a maximum leverage ratio of 2.0:1.0 measured at end of each fiscal quarter;
|
| |
|
|
●
|
Prohibition of unfinanced capital expenditures in excess of $4.0 million for trailing four fiscal quarter period; and
|
| |
|
|
●
|
Limitations on dividends paid to the parent company of 30% of EDITDA.
|
The Credit Agreement contains standard default triggers, which include but are not limited to:
|
●
|
failure to pay principal, interest or other amounts due and payable;
|
| |
|
|
●
|
failure to maintain compliance with the financial covenants and other covenants contained in the Restated Credit Agreement;
|
| |
|
|
●
|
default on certain of our other indebtedness;
|
| |
|
|
●
|
breach of a representation or warranty;
|
| |
|
|
●
|
the existence of bankruptcy or insolvency proceedings;
|
| |
|
|
●
|
the entry of certain judgments against South Hampton and its subsidiaries;
|
| |
|
|
●
|
the invalidity of any loan document; and
|
| |
|
|
●
|
upon a change of control.
|
Upon the occurrence of any event of default Bank of America may take certain actions including declaring any outstanding amount due and payable.
ATTACHMENT C-1
(Response to SEC Question No. 7)
ARABIAN AMERICAN DEVELOPMENT COMPANY
AMENDED AND RESTATED AUDIT COMMITTEE CHARTER
(Adopted February 13, 2004)
General
The Board of Directors (“Board”) of Arabian American Development Company (the “Company”) has established a committee of the Board known as the Audit Committee (the “Audit Committee”). The purpose of this Amended and Restated Audit Committee Charter (the “Charter”) is to specify the governance and the powers and responsibilities of the Audit Committee.
Audit Committee’s Purpose
The Audit Committee is appointed by the Board to assist the Board in monitoring (1) the integrity of the financial statements of the Company, (2) the independent auditor’s qualifications and independence, (3) the compliance by the Company with legal and regulatory requirements, (4) the Company’s accounting and financial reporting processes and audits of the Company’s financial statements and (5) related party transactions.
The Audit Committee shall prepare or cause the preparation of the report required by the rules of the Securities and Exchange Commission (the “Commission”) to be included in the Company’s annual proxy statement.
Audit Committee Membership
The Audit Committee shall consist of no fewer than two members. All members of the Audit Committee shall meet the independence and experience requirements of The Nasdaq Stock Market, Section 10A(m)(3) of the Securities Exchange Act of 1934 (the “Exchange Act”) and the rules and regulations of the Commission. At least one member of the Audit Committee shall be an “audit committee financial expert” as defined by the rules and regulations of the Commission. All members of the Audit Committee shall be “financially literate” and have a working familiarity with basic finance and accounting practices. The Chairperson and members of the Audit Committee shall be appointed by the Board, and shall serve for a period of one year or until such time as his or her successor has been duly named or until such member’s earlier resignation, death or removal. Audit Committee members may be removed (with or without a cause) and replaced by the Board.
Meetings
The Audit Committee shall meet as often as it determines is necessary to carry out its duties and responsibilities. A quorum of the Audit Committee will consist of at least 50% of the members of the Audit Committee. The Audit Committee may request any officer or employee of the Company or the Company’s outside counsel or independent auditor to attend a meeting of the Committee or to meet with any members of, or consultants to, the Committee.
The Chairperson of the Audit Committee shall designate a person who need not be a member thereof to act as Secretary and minutes of its proceedings shall be kept in minute books provided for that purpose. The agenda of each meeting will be prepared by the Secretary of the Company and, whenever reasonably practicable, circulated to each member prior to each meeting.
Committee Authority and Responsibilities
The Audit Committee shall have the sole authority to appoint or replace the independent auditor (subject, if applicable, to shareholder ratification). The Audit Committee shall be solely and directly responsible for the compensation and oversight of the work of the independent auditor (including resolution of disagreements between management and the independent auditor regarding financial reporting) for the
purpose of preparing or issuing an audit report or related work, and shall have sole power to approve all audit engagement fees and terms. The independent auditor shall report directly to the Audit Committee.
The Audit Committee shall preapprove all auditing services and permitted non-audit services (including the fees and terms thereof) to be performed for the Company by its independent auditor, subject to the de minimis exceptions for non-audit services described in Section 10A(i)(1)(B) of the Exchange Act which are approved by the Audit Committee prior to the completion of the audit. The Audit Committee may form and delegate authority to subcommittees consisting of one or more members when appropriate, including the authority to grant preapprovals of audit and permitted non-audit services, provided that decisions of such subcommittee to grant preapprovals shall be presented to the full Audit Committee at its next scheduled meeting.
The Audit Committee shall have the authority without prior Board approval, to the extent it deems necessary or appropriate, to retain (and approve compensation of) independent legal, accounting or other advisors. The Company shall provide for appropriate funding, as determined by the Audit Committee, for payment of compensation to the independent auditor for the purpose of rendering or issuing an audit report, for payment of compensation to any advisors employed by the Audit Committee and for payment of ordinary administrative expenses of the Audit Committee that are necessary or appropriate in carrying out its duties.
The Audit Committee, to the extent it deems necessary or appropriate, shall also:
|
1.
|
Review and discuss with management and the independent auditor the annual audited financial statements, including disclosures made in management’s discussion and analysis, and recommend to the Board whether the audited financial statements should be included in the Company’s Form 10-K.
|
|
2.
|
Review and discuss with management and the independent auditor the Company’s quarterly financial statements, including disclosures made in management’s discussion and analysis, prior to the filing of its Form 10-Q, including the results of the independent auditor’s review of the quarterly financial statements.
|
|
3.
|
Discuss with management and the independent auditor (and review any related analysis prepared by management and/or the independent auditor) significant financial reporting issues and judgments made in connection with the preparation of the Company’s financial statements, including any significant changes, or alternatives considered, in the Company’s selection or application of accounting principles, any major issues as to the adequacy of the Company’s internal controls and any special steps adopted in light of material control deficiencies.
|
|
4.
|
Review and discuss quarterly reports from the independent auditors on:
|
|
(a)
|
All critical accounting policies and practices to be used.
|
|
(b)
|
All alternative treatments of financial information within generally accepted accounting principles that have been discussed with management, ramifications of the use of such alternative disclosures and treatments and the treatment preferred by the independent auditor.
|
|
(c)
|
Other material written communications between the independent auditor and management, such as any management letter or schedule of unadjusted differences.
|
|
5.
|
Discuss with management and the independent auditor the effect of regulatory and accounting initiatives as well as off-balance sheet structures on the Company’s financial statements.
|
|
6.
|
Discuss with the independent auditor the matters required to be discussed by Statement on Auditing Standards No. 61 relating to the conduct of the audit.
|
|
7.
|
Review disclosures made to the Audit Committee by the Company’s Chief Executive Officer and Chief Financial Officer during their certification process for the Form 10-K and Form 10-Q about any significant deficiencies in the design or operation of internal controls or material weaknesses therein and any fraud involving management or other employees who have a significant role in the Company’s internal controls. Review and discuss any significant changes in internal controls with the Chief Financial Officer and Chief Executive Officer.
|
|
8.
|
Review and evaluate the lead partner of the independent auditor team.
|
|
9.
|
Obtain and review a report from the independent auditor at least annually regarding (a) the independent auditor’s internal quality-control procedures, (b) any material issues raised by the most recent internal quality-control review, or peer review, of the firm, or by any inquiry or investigation by governmental or professional authorities within the preceding five years respecting one or more independent audits carried out by the firm, (c) any steps taken to deal with any such issues and (d) all relationships between the independent auditor and the Company. Evaluate the qualifications, performance, objectivity and independence of the independent auditor, including considering whether the auditor’s quality controls are adequate and the provision of permitted non-audit services is compatible with maintaining the auditor’s objectivity and independence, taking into account the opinions of management and internal auditors. The Audit Committee shall present its conclusions with respect to the independent auditor to the Board.
|
|
10.
|
Ensure the rotation of the audit partners as required by applicable laws and regulations.
|
|
11.
|
Discuss with the national office of the independent auditor issues on which they were consulted by the Company’s audit team and matters of audit quality and consistency.
|
|
12.
|
Meet with the independent auditor prior to the audit to discuss the planning and staffing of the audit.
|
|
13.
|
Obtain from the independent auditor assurance that Section 10A(b) of the Exchange Act (relating to illegal acts) has not been implicated.
|
|
14.
|
Obtain reports from management and the independent auditor that the Company and its affiliated entities are in conformity with applicable legal requirements and the Company’s Code of Ethics. Review reports and disclosures of insider and related party transactions. Advise the Board with respect to the Company’s policies and procedures regarding compliance with applicable laws and regulations and with the Company’s Code of Ethics.
|
|
15.
|
Establish procedures for the receipt, retention and treatment of complaints received by the Company regarding accounting, internal accounting controls or auditing matters and the confidential, anonymous submission by employees of concerns regarding questionable accounting or auditing matters.
|
|
16.
|
Discuss with management and the independent auditor any correspondence with regulators or governmental agencies and any published reports which raise material issues regarding the Company’s financial statements or accounting policies.
|
|
17.
|
Discuss with the Company’s outside counsel, to the extent deemed appropriate, legal matters that may have a material impact on the financial statements or the Company’s compliance policies.
|
|
18.
|
Review and, if appropriate, approve all related party transactions.
|
Limitation of Audit Committee’s Role
While the Audit Committee has the responsibilities and powers set forth in this Charter, it is not the duty of the Audit Committee to (i) plan or conduct audits or (ii) determine that the Company’s financial statements
and disclosures are complete and accurate and are in accordance with generally accepted accounting principles and applicable rules and regulations or fairly present the Company’s financial condition, results of operations and cash flow. These are the responsibilities of management and/or the independent auditor. Further, management is responsible for implementing adequate internal accounting and disclosure controls and procedures and for preparing the Company’s financial statements.
ATTACHMENT C-2
(Response to SEC Question No. 7)
“Related Party Transactions Policy
On May ___, 2010, the Board of Directors of Arabian American Development Company (the "Company") adopted the following policy with regard to Related Party Transactions, as defined below.
Policy
Related Party Transactions, which are limited to those described in this policy, shall be subject to the approval or ratification by the Audit Committee of the Board of Directors (the “AC”) in accordance with this Policy.
Background
Pursuant to Item 404 of Regulation S-K of the Securities and Exchange Commission ("SEC"), certain transactions between the issuer and certain related persons need to be disclosed in our filings with the SEC. In addition, under Section 144 of the Delaware General Corporation Law, certain transactions between the Company and our directors and officers may need to be approved by our AC. Finally, SEC rules and NASDAQ Stock Exchange standards require our AC to assess whether relationships or transactions exist that may impair the independence of our outside directors. This Policy is intended to provide guidance and direction on Related Party Transactions.
Definition
A "Related Party Transaction" is any transaction directly or indirectly involving any Related Party that would need to be disclosed under Item 404(a) of Regulation S-K. Under Item 404(a), the Company is required to disclose any transaction occurring since the beginning of the registrant's last fiscal year, or any currently proposed transaction, involving the Company where the amount involved exceeds $120,000, and in which any related person had or will have a direct or indirect material interest. "Related Party Transaction" also includes any material amendment or modification to an existing Related Party Transaction.
"Related Party" means any of the following:
| |
(i) a director (which term when used herein includes any director nominee),
|
| |
(ii) an executive officer,
|
| |
(iii) a person known by the Company to be the beneficial owner of more than 5% of the Company's common stock (a "5% stockholder"), or
|
| |
(iv) a person known by the Company to be an immediate family member of any of the foregoing.
|
"Immediate family member" means a child, stepchild, parent, stepparent, spouse, sibling, mother-in-law, father-in-law, son-in-law, daughter-in-law, brother-in-law, or sister-in-law of such director, executive officer, nominee for director or beneficial owner, and any person (other than a tenant or employee) sharing the household of such director, executive officer, nominee for director or beneficial owner.
Identification of Potential Related Party Transactions
Related Party Transactions will be brought to management's and the AC's attention in a number of ways. Each of our directors and executive officers is instructed and periodically reminded to inform the Secretary of the Company of any potential Related Party Transactions. In addition, each such director and executive officer completes a questionnaire on an annual basis designed to elicit information about any potential Related Party Transactions.
Any potential Related Party Transactions that are brought to our attention are analyzed by management and with outside counsel, to determine whether the transaction or relationship does, in fact, constitute a Related Party Transaction requiring compliance with this Policy.
Review and Approval of Related Party Transactions
The AC will be provided with the details of each new, existing or proposed Related Party Transaction, including the terms of the transaction, the business purpose of the transaction, and the benefits to the Company and to the relevant Related Party. In determining whether to approve a Related Party Transaction, the AC will consider, among other factors, the following factors to the extent relevant to the Related Party Transaction:
|
(i)
|
whether the terms of the Related Party Transaction are fair to the Company and on the same basis as would apply if the transaction did not involve a Related Party;
|
|
(ii)
|
whether there are business reasons for the Company to enter into the Related Party Transaction;
|
|
(iii)
|
whether the Related Party Transaction would impair the independence of an outside director; and
|
|
(iv)
|
whether the Related Party Transaction would present an improper conflict of interests for any director or executive officer of the Company, taking into account the size of the transaction, the overall financial position of the director, executive officer or Related Party, the direct or indirect nature of the director's, executive officer's or Related Party's interest in the transaction and the ongoing nature of any proposed relationship, and any other factors the AC deems relevant.
|
Any member of the AC who has an interest in the transaction under discussion will abstain from voting on the approval of the Related Party Transaction, but may, if so requested by the Chairperson of the AC, participate in some or all of the AC's discussions of the Related Party Transaction. Upon completion of its review of the transaction, the AC may determine to permit or to prohibit the Related Party Transaction.
A Related Party Transaction entered into without pre-approval of the AC shall not be deemed to violate this Policy, or be invalid or unenforceable, so long as the transaction is brought to the AC as promptly as reasonably practical after it is entered into or after it becomes reasonably apparent that the transaction is covered by this policy.”
ATTACHMENT D
(Response to SEC Question No. 8)
PARTIAL COPY OF SNC LAVALIN 2005 UPDATE OF FEASIBILITY STUDY
ARABIAN AMERICAN
DEVELOPMENT COMPANY
AL MASANE PROJECT
UPDATE OF FEASIBILITY STUDY
CAPITAL AND OPERATING COST
ESTIMATES
August 2005
TABLE OF CONTENTS
|
NOTICE TO READER
|
1-IV
|
| |
|
|
|
|
1.0
|
INTRODUCTION AND PROJECT SCOPE
|
1-1
|
| |
|
|
|
|
1.1
|
Introduction
|
1-1
|
| |
|
|
|
|
1.2
|
Scope of Services
|
1-3
|
| |
|
|
|
| |
1.2.1
|
Capital Cost
|
1-3
|
| |
1.2.2
|
Operating Costs
|
1-4
|
| |
|
|
|
|
2.0
|
SUMMARY
|
2-1
|
| |
|
|
|
|
2.1
|
General
|
2-1
|
| |
|
|
|
|
2.2
|
Capital Cost update
|
2-1
|
| |
|
|
|
|
2.3
|
Operating Cost Update
|
2-5
|
| |
|
|
|
|
3.0
|
CAPITAL COST ESTIMATE UPDATE
|
3-1
|
| |
|
|
|
|
3.1
|
Summary
|
3-1
|
| |
|
|
|
|
3.2
|
Basis of estimate
|
3-5
|
| |
|
|
|
|
3.3
|
Direct Cost Estimate
|
3-5
|
| |
|
|
|
| |
3.3.1
|
Quantities
|
3-5
|
| |
3.3.2
|
Unit Rates for Material And Equipment
|
3-5
|
| |
3.3.3
|
Direct Field Labour
|
3-9
|
| |
|
|
|
|
3.4
|
Indirect Cost Estimate
|
3-10
|
| |
|
|
|
| |
3.4.1
|
Construction Indirects
|
3-10
|
| |
3.4.2
|
Freight
|
3-10
|
| |
3.4.3
|
Engineering, Procurement and Construction Management (EPCM)
|
3-10
|
| |
3.4.4
|
Capital Spares and First Fills
|
3-11
|
| |
3.4.5
|
Construction Camp
|
3-11
|
| |
3.4.6
|
Taxes, Duties and Owner's Costs
|
3-11
|
| |
3.4.7
|
Contingency
|
3-11
|
| |
|
|
|
|
3.5
|
Capital Cost Exclusions
|
3-11
|
| |
|
|
|
|
3.6
|
Assumptions
|
3-12
|
| |
|
|
|
|
4.0
|
OPERATING COST ESTIMATE UPDATE
|
4-1
|
| |
|
|
|
|
4.1
|
General
|
4-1
|
| |
|
|
|
|
4.2
|
Basis of Estimates and Procedures
|
4-2
|
| |
|
|
|
|
4.3
|
Mine Operating Costs
|
4-2
|
| |
|
|
|
|
4.4
|
Process Plant Operating Cost
|
4-6
|
| |
|
|
|
| |
4.4.1
|
Labour
|
4-6
|
| |
4.4.2
|
Consumables
|
4-7
|
| |
4.4.3
|
Maintenance Supplies
|
4-9
|
| |
4.4.4
|
Electrical Power
|
4-10
|
| |
4.4.5
|
Concentrator General
|
4-10
|
| |
|
|
|
|
4.5
|
Gold Recovery Circuit Operating Cost
|
4-10
|
| |
|
|
|
| |
4.5.1
|
Labour
|
4-11
|
| |
4.5.2
|
Consumables
|
4-11
|
| |
4.5.3
|
Maintenance Supplies
|
4-12
|
| |
4.5.4
|
Power
|
4-12
|
| |
|
|
|
|
4.6
|
General and Administrative Operating Cost
|
4-12
|
| |
|
|
|
| |
4.6.1
|
G & A Labour
|
4-13
|
| |
4.6.2
|
G&A Maintenance Labour
|
4-14
|
| |
4.6.3
|
G&A Power Cost
|
4-14
|
| |
4.6.4
|
G&A Maintenance Costs
|
4-15
|
| |
4.6.5
|
G&A General Expenses
|
4-15
|
| |
|
|
|
|
4.7
|
Concentrate Transportation
|
4-16
|
| |
|
|
|
|
4.8
|
Port Operations
|
4-16
|
| |
|
|
|
| |
4.8.1
|
Port Operation Labour
|
4-17
|
| |
4.8.2
|
Port Operation Power & Fuel
|
4-17
|
| |
4.8.3
|
Port Operation Supplies
|
4-17
|
| |
4.8.4
|
Port Authority
|
4-17
|
| |
4.8.5
|
Ship Loading Time
|
4-17
|
NOTICE TO READER
This document contains the expression of the professional opinion of SNC-Lavalin Engineers & Constructors Inc. ("SNC-Lavalin") as to the matters set out herein, using its professional judgment and reasonable care. It is to be read in the context of the agreement dated April 20, 2005 (the "Agreement") between SNC-Lavalin and Arabian American Development Company (the "Client"), and the methodology, procedures and techniques used, SNC-Lavalin's assumptions, and the circumstances and constrains under which its mandate was performed. This document is written solely for the purpose stated in the Agreement, and for the sole and exclusive benefit of the Client, whose remedies are limited to those set out in the Agreement. This document is meant to be read as a whole, and sections or parts thereof should thus not be read or relied upon out of context.
SNC-Lavalin has, in preparing the cost estimates, followed methodology and procedures, and exercised due care consistent with the intended level of accuracy, using its professional judgment and reasonable care, and is thus of the opinion that there is a high probability that actual costs will fail within the specified error margin. However, no warranty should be implied as to the accuracy of estimates. Unless expressly stated otherwise, assumptions, data and information supplied by, or gathered from other sources (including the Client, other consultants, testing laboratories and equipment suppliers, etc.) upon which SNC-Lavalin's opinion as set out herein is based has not been verified by SNC-Lavalin; SNC-Lavalin makes no representation as to its accuracy and disclaims all liability with respect thereto,
SNC-Lavalin disclaims any liability to the Client and to third parties in respect of the publication, reference, quoting, or distribution of this report or any of its contents to and reliance thereon by any third party.
|
1.0
|
INTRODUCTION AND PROJECT SCOPE
|
In April 2005, Arabian American Development Company (AADC) retained SNC-Lavalin Engineers & Constructors (SNC-Lavalin) to update the capital and operating cost estimates for the Al Masane Project, based on engineering by others.
In 1994 and 1996, Davy international Canada Ltd. (Davy) was retained by Arabian Shield Development Company to carry out a review and update of the Al Masane Feasibility Study that was prepared by Watts, Griffis and McOuat (WGM) in 1982 (excluding the mining portion of the project). The results of Davy's reviews are contained in the following reports:
| |
•
|
Arabian Shield Development Company, Al Masane Project, Saudi Arabia, Feasibility Study for a 2000 TPD Concentrator and Related Infrastructure, Davy Project No. 1313, April 1994; and
|
| |
•
|
Arabian Shield Development Company, Al Masane Project, Capital Cost Estimate Update For Concentrator and Related Facilities, Davy Project No. 1432, March 1996.
|
WGM was involved in the mine design for Al Masane, from time to time, between 1982 and 1996. WGM reports provided by AADC to SNC-Lavalin are as follows:
| |
•
|
Volumes 1 and 2, Feasibility Study - Al Masane Project - For Arabian Shield Development Company and National Mining Company, WGM, August 27, 1982;
|
| |
•
|
Review of 1982 Feasibility Study - A! Masane Project - For Arabian Shield Development Company and National Mining Company, WGM, September 26, 1984; and
|
| |
•
|
Review of Feasibility Study - Al Masane Project - For Arabian Shield Development Company and National Mining Company, WGM, February 20, 1989.
|
| |
•
|
Feasibility Study on the Al Masane Project for Arabian Shield Development Company, July 22, 1994.
|
| |
•
|
Al Masane Project, Mine Capital and Operating Cost Update, 1st Quarter 1996, WGM, 01APR96.
|
In executing its services, SNC-Lavalin has relied on design work done by Davy and WGM; therefore, SNC-Lavalin cannot opine on the validity of such design work and project implementation. No engineering design services were provided by SNC-Lavalin, and it has been specifically directed by AADC to accept all engineering provided by others. The preferred mine stoping method was revised by WGM between its 1982 and 1994 contributions. Very few underground mine development drawings were made available to SNC-Lavalin to assist in its understanding of the overall mining scheme.
SNC-Lavalin has not visited the site and cannot comment on the condition of existing facilities that were included in the Davy reports. However, AADC has reported that said facilities are in good condition.
The following project description has been obtained verbatim from the aforementioned March 1996 Davy report:
"The surface process facilities will consist of a 2000 t/d concentrator capable of producing approximately 125 t of copper concentrate and 160 t of zinc concentrate daily. The ore will be ground and copper and zinc concentrates recovered by conventional flotation methods. Concentrates will be dewatered by thickening and filtering, and will be transported by highway haulage trucks, 350 km to the port at Gizan. The concentrates will be stored on the dock in an existing shed, which has a capacity of 15 000 t of copper concentrates, and 10 000 t of zinc concentrate. The shed will be leased from the Port Authority. Concentrates will be shipped in 7 500 to 10 000 t lots to smelters worldwide. Ships will be loaded by a specially designed ship loader constructed for the purpose. The equipment and systems planned will involve proven technology used in presently existing operations.
The site is approximately 1 600 m above sea level on the Asir plateau in a temperate area of the Kingdom. Rainfall is approximately 102 mm/a. High evaporation rate causes the area to be arid.
The Kingdom of Saudi Arabia has developed modern infrastructure, including road, air, port, power distribution, and communications systems."
The following description of the proposed mining facilities has been obtained verbatim from WGM's 1994 report:
"It is presently proposed to bring the deposit into production at a rate of 700 000 t/y. Access to the mine is by a 700 m long decline and the two drifts that were driven as part of the original mine exploration program completed in 1982.
The ore will be mined by trackless mining equipment using either cut and fill or open stoping methods depending on the shape and location of each orebody. Ore will be transported from the active mining areas to the underground dump pocket by a system of orepasses and trucks specifically designed for the transport of ore underground. From the dump pocket, the ore will be fed at a controlled rate into the underground crusher. The crushed ore will then be transported by a conveyor system installed in the decline to a stockpile on surface."
1.2 Scope of Services
SNC-Lavalin's scope of services for updating the capital and operating cost estimates for the Al Masane Project is provided in this section.
The cost areas listed below will be updated to an intended overall level of accuracy of ±15%.
| |
•
|
Concentrator and Infrastructure;
|
| |
•
|
Architectural and Buildings;
|
| |
•
|
Diesel Generating Plant;
|
| |
•
|
Electrical and Instrumentation;
|
| |
•
|
Misc. Construction Equipment;
|
| |
•
|
Cyanide Plant Costs; and
|
| |
•
|
Project Implementation Cost
|
Indirect Costs
| |
•
|
Freight and Spare Parts;
|
| |
•
|
EPCM and Field Support,
|
Mine Capital
| |
•
|
Surface roads and Raises;
|
| |
•
|
Crusher and Excavation; and
|
| |
•
|
Development Mobile equipment.
|
| |
•
|
Maintenance Facilities;
|
The equipment selection provided in the feasibility study will be reviewed and SNC-Lavalin will express an opinion if current available equipment or technology could significantly impact the capital cost or operating cost estimates.
This review would not include a metallurgical or flowsheet development review or mining review. The basic assumptions for the mine, the process plant, and infrastructure will remain as per the feasibility studies.
This report is a cost update of engineering designs provided by Davy and WGM in their reports as identified in Section 1.1. SNC-Lavalin has not revisited the details of the engineering design of the project in this report. For the details of the engineering design, the reader must review the aforementioned Davy and WGM reports.
This study separates the capital costs into two cases, a base case and an expansion option. The base case includes development of the underground mine, a 2 000 t/d process plant to extract copper and zinc concentrate, a site access road, site power distribution, water pipeline, administration, service and camp buildings, and a tailing storage facility. The estimated capital cost for the base case is approximately $115,800,000.
The expansion option is for a gold recovery circuit using cyanide leach and a Merrill Crowe line. The estimated capital cost for the expansion is $6,750,000.
The estimates for both cases includes the direct field costs of executing the project, plus the indirect costs associated with the design and construction of the new facilities.
The quantities and scope for the 2005 estimate were taken directly from previous studies done by Davy and WGM in 1994 and 1996. The 2005 Capita! Cost Estimates are summarized and compared to the DavyA/VGM estimates in Table 2.1 and Table 2.2.
Davy's 1994 report states, "This estimate is an appropriation type estimate with an assessed accuracy of ±15%." WGM's 1994 report states, "The cost estimates have been prepared in a manner and in sufficient detail so that the estimates have an assessed accuracy of ±15%." SNC-Lavalin's estimate is an update of Davy's and WGM's estimates into 2nd Quarter, 2005 US$.
Table 2.1: Capital Cost Summary Base Estimate - ( 000's) USS
|
WBS
|
|
AREAS IN BASE ESTIMATE
|
|
WGM/Davy
1994
|
|
|
WGM/Davy
1996
|
|
|
SNC-Lavalin
2005
|
|
| |
|
|
|
|
|
|
|
|
|
|
|
|
0000
|
|
MINE DEVELOPMENT
|
|
|
|
|
|
|
|
|
|
|
0100
|
|
Mobile Mine Equipment1
|
|
|
4,864
|
|
|
|
5,351
|
|
|
|
9,855
|
|
|
0200
|
|
Development & Production Equipment
|
|
|
1,231
|
|
|
|
1,271
|
|
|
|
1,481
|
|
|
0300
|
|
Mine Surface Roads
|
|
|
2,025
|
|
|
|
1,935
|
|
|
|
2,555
|
|
|
0400
|
|
Underground Development2
|
|
|
200
|
|
|
|
212
|
|
|
|
0
|
|
|
0410
|
|
- Crusher Room
|
|
|
1,389
|
|
|
|
1,408
|
|
|
|
2,224
|
|
|
0420
|
|
- Saadah Capital Development
|
|
|
2,841
|
|
|
|
2,789
|
|
|
|
2,698
|
|
|
0430
|
|
- Development Levels 1525 and 15353
|
|
|
758
|
|
|
|
724
|
|
|
|
5,408
|
|
|
0440
|
|
- Moyeath Zone Development4
|
|
|
4,002
|
|
|
|
3,854
|
|
|
|
7,038
|
|
|
0490
|
|
- Development Contractor's Mob & Demob5
|
|
|
0
|
|
|
|
0
|
|
|
|
470
|
|
| |
|
Subtotal
|
|
|
17,310
|
|
|
|
17,544
|
|
|
|
31,729
|
|
| |
|
|
|
|
|
|
|
|
|
|
|
|
|
|
|
1000
|
|
GENERAL SITE
|
|
|
|
|
|
|
|
|
|
|
|
|
|
1100
|
|
Site Access Road
|
|
|
285
|
|
|
|
347
|
|
|
|
1,444
|
|
|
1200
|
|
In-Plant Roads
|
|
|
57
|
|
|
|
70
|
|
|
|
93
|
|
|
1300
|
|
Site Development
|
|
|
562
|
|
|
|
604
|
|
|
|
776
|
|
|
1400
|
|
Site Services
|
|
|
717
|
|
|
|
827
|
|
|
|
899
|
|
|
1500
|
|
Fuel Storage
|
|
|
195
|
|
|
|
180
|
|
|
|
189
|
|
|
1700
|
|
Power Plant
|
|
|
6,146
|
|
|
|
7,027
|
|
|
|
8,503
|
|
|
1800
|
|
Power Distribution on Site
|
|
|
2,576
|
|
|
|
2,651
|
|
|
|
3,744
|
|
|
1900
|
|
Plant Mobile Equipment
|
|
|
2,643
|
|
|
|
2,647
|
|
|
|
3,512
|
|
| |
|
Subtotal
|
|
|
13,181
|
|
|
|
14,353
|
|
|
|
19,160
|
|
| |
|
|
|
|
|
|
|
|
|
|
|
|
|
|
|
2000
|
|
PROCESS
|
|
|
|
|
|
|
|
|
|
|
|
|
|
2100
|
|
Coarse Ore Conveying and Storage
|
|
|
2,505
|
|
|
|
2,813
|
|
|
|
3,912
|
|
|
2200
|
|
Grinding
|
|
|
2,973
|
|
|
|
3,533
|
|
|
|
4,980
|
|
|
2300
|
|
Flotation
|
|
|
1,013
|
|
|
|
980
|
|
|
|
927
|
|
|
2310
|
|
Cu Flotation
|
|
|
2,488
|
|
|
|
2,751
|
|
|
|
4,323
|
|
|
2320
|
|
Zn Flotation
|
|
|
1,171
|
|
|
|
1,199
|
|
|
|
1,852
|
|
|
2500
|
|
Concentrate Handling
|
|
|
1,888
|
|
|
|
2,436
|
|
|
|
3,611
|
|
|
2600
|
|
Tailings Thickening
|
|
|
2,213
|
|
|
|
2,452
|
|
|
|
3,258
|
|
|
2800
|
|
Reagents
|
|
|
790
|
|
|
|
801
|
|
|
|
1,343
|
|
|
2900
|
|
Concentrator Building
|
|
|
1,060
|
|
|
|
996
|
|
|
|
1,517
|
|
|
WBS
|
|
AREAS IN BASE ESTIMATE
|
|
WGM/Davy
1994
|
|
|
WGM/Davy
1996
|
|
|
SNC-Lavalin
2005
|
|
| |
|
Subtotal
|
|
|
16,101
|
|
|
|
17,961
|
|
|
|
25,723
|
|
| |
|
|
|
|
|
|
|
|
|
|
|
|
|
|
|
4000
|
|
BUILDINGS & ANCILLARY FACILITIES
|
|
|
|
|
|
|
|
|
|
|
|
|
|
4100
|
|
Laboratory Building
|
|
|
151
|
|
|
|
161
|
|
|
|
235
|
|
|
4200
|
|
Offices
|
|
|
37
|
|
|
|
37
|
|
|
|
56
|
|
|
4300
|
|
Service Building
|
|
|
761
|
|
|
|
683
|
|
|
|
1,076
|
|
|
4400
|
|
Permanent Camp
|
|
|
769
|
|
|
|
840
|
|
|
|
995
|
|
|
4500
|
|
First Aid Building
|
|
|
146
|
|
|
|
158
|
|
|
|
206
|
|
|
4700
|
|
Explosives Magazine
|
|
|
9
|
|
|
|
9
|
|
|
|
17
|
|
|
4900
|
|
Gatehouse, Security, Other
|
|
|
26
|
|
|
|
26
|
|
|
|
52
|
|
| |
|
Subtotal
|
|
|
1,899
|
|
|
|
1,914
|
|
|
|
2,637
|
|
| |
|
|
|
|
|
|
|
|
|
|
|
|
|
|
|
5000
|
|
TAILINGS AND RECLAIM
|
|
|
|
|
|
|
|
|
|
|
|
|
|
5100
|
|
Tailings Dam
|
|
|
207
|
|
|
|
302
|
|
|
|
437
|
|
| |
|
Subtotal
|
|
|
207
|
|
|
|
302
|
|
|
|
437
|
|
| |
|
|
|
|
|
|
|
|
|
|
|
|
|
|
|
7000
|
|
OFFSITE FACILITIES
|
|
|
|
|
|
|
|
|
|
|
|
|
|
7100
|
|
Water Supply
|
|
|
607
|
|
|
|
739
|
|
|
|
754
|
|
|
7400
|
|
Port
|
|
|
1,065
|
|
|
|
1,091
|
|
|
|
1,501
|
|
| |
|
Subtotal
|
|
|
1,672
|
|
|
|
1,830
|
|
|
|
2,255
|
|
| |
|
|
|
|
|
|
|
|
|
|
|
|
|
|
|
9000
|
|
INDIRECTS
|
|
|
|
|
|
|
|
|
|
|
|
|
|
9100
|
|
EPCM
|
|
|
6,420
|
|
|
|
6,815
|
|
|
|
9,100
|
|
|
9200
|
|
Vendor's Reps
|
|
|
300
|
|
|
|
318
|
|
|
|
700
|
|
|
9300
|
|
Contractor's Facilities & Equipment
|
|
|
1,635
|
|
|
|
1,774
|
|
|
|
1,900
|
|
|
9400
|
|
Camp
|
|
|
160
|
|
|
|
180
|
|
|
|
213
|
|
|
9500
|
|
First Fills & Spare Parts
|
|
|
1,735
|
|
|
|
2,163
|
|
|
|
2,100
|
|
|
9600
|
|
Freight
|
|
|
1,683
|
|
|
|
2,114
|
|
|
|
4,740
|
|
|
9800
|
|
Commissioning
|
|
|
305
|
|
|
|
324
|
|
|
|
0
|
|
|
9900
|
|
Contingency
|
|
|
9,101
|
|
|
|
10,006
|
|
|
|
15,106
|
|
| |
|
Subtotal
|
|
|
21,339
|
|
|
|
23,694
|
|
|
|
33,859
|
|
| |
|
|
|
|
|
|
|
|
|
|
|
|
|
|
| |
|
TOTAL
|
|
|
71,709
|
|
|
|
77,598
|
|
|
|
115,800
|
|
|
1
|
WGM's 1994 report states "Current planning is to incorporate all of the equipment purchased during the 1979 underground exploration program into the equipment fleet for production mining," However, that report did not include a list of that equipment AADC provided a list of equipment that it reports is currently at the site (see Appendix 2F for a copy of this list). SNC-Lavalin has no knowledge of the condition of this equipment, Replacement value for the equipment that AADC has reported is on site is estimated by SNC-Lavalin to be about $4,831,000. Of this total, $3,125,000 has been included in SNC-Lavalin's capital cost estimate as Mine Mobile Equipment (see Appendix 2F for "On Site Equipment Included in SNC-Lavalin Estimate"), If this equipment proves to be in good condition, this latter amount can be deducted from the capital cost estimate. The remaining $1,706,000 represents support equipment that has not been included in the SNC-Lavalin's capital cost estimate update as these items were not specifically identified in WGM's reports (see Appendix 2F for "On Site Equipment Excluded from SNC-Lavalin Estimate"), if these items prove not to be useable, this amount will have to be added to SNC-Lavalin's capital cost estimate. Freight in the 2005 estimate is included in "9600 - Freight"
|
|
2
|
Underground Development was identified as diamond drilling in the 1994 and 1996 estimates. In the 2005 estimate, diamond drilling is included in the other specific development areas.
|
|
3
|
Development Levels 1525 and 1535 were estimated by WGM at between $700,000 to $800,000 in both its 1994 and 1996 estimates. The 1994 estimate was questioned in a review by International Mining Co. & Associates, dated May 25, 1994, in which it estimated "Total Development 1525 and 1535 Levels" to cost $2,850,720. This memo is appended to the WGM 1996 report, and it is the only information received by SNC-Lavalin that provides any engineering details of this development Therefore, SNC-Lavalin applied these engineering details to its estimate. However, the difference in the estimates between WGM and International Mining Co. & Associates is substantial, and this raises the question, "Does the engineering detail reported by International Mining Co. & Associates, concur with that intended by WGM?"
|
|
4
|
Moyeath development has been included in this table as an initial capital requirement, as it was also tabulated in this fashion by WGM, However, WGM's 1994 report includes a schedule that shows mine production commencing in August 1996, and it also includes the text, "Moyeath development will be initiated in 1997". If this development was intended to be initiated in 1997, it would not have been an initial capital requirement,
|
|
5
|
A contract developer appears to not have been used in the 1994 and 1996 estimates by WGM. SNC-Lavalin has applied the use of a contractor for development in its estimates,
|
Table 2.2: Capital Cost Summary Gold Option – ( 000’s) US$
|
3000
|
|
GOLD PROCESS
|
|
WGM/Davy
1994
|
|
|
WGM/Davy
1996
|
|
|
SNC-Lavalin
2005
|
|
|
3100
|
|
Leach Circuit
|
|
|
1,882
|
|
|
|
2,026
|
|
|
|
2,667
|
|
|
3200
|
|
Merrill Crowe - Refinery
|
|
|
393
|
|
|
|
512
|
|
|
|
628
|
|
|
3300
|
|
Gold Process Building & Infrastructure
|
|
|
678
|
|
|
|
723
|
|
|
|
1,147
|
|
| |
|
Subtotal
|
|
|
2,953
|
|
|
|
3,261
|
|
|
|
4,442
|
|
| |
|
|
|
|
|
|
|
|
|
|
|
|
|
|
|
9000
|
|
INDIRECTS
|
|
|
|
|
|
|
|
|
|
|
|
|
|
9100
|
|
EPCM
|
|
|
500
|
|
|
|
530
|
|
|
|
760
|
|
|
9200
|
|
Vendor's Reps
|
|
|
0
|
|
|
|
0
|
|
|
|
54
|
|
|
9500
|
|
First Fills & Spare Parts
|
|
|
200
|
|
|
|
185
|
|
|
|
285
|
|
|
9600
|
|
Freight
|
|
|
187
|
|
|
|
220
|
|
|
|
325
|
|
|
9800
|
|
Startup & Commissioning
|
|
|
0
|
|
|
|
0
|
|
|
|
0
|
|
|
9900
|
|
Contingency
|
|
|
575
|
|
|
|
618
|
|
|
|
884
|
|
| |
|
Subtotal
|
|
|
1,462
|
|
|
|
1,553
|
|
|
|
2,308
|
|
| |
|
|
|
|
|
|
|
|
|
|
|
|
|
|
| |
|
TOTAL
|
|
|
4,415
|
|
|
|
4,814
|
|
|
|
6,750
|
|
2.3 Operating Cost Update
Direct operating costs for the Al Masane Project have been estimated under five functional headings: Mine, Concentrator, General and Administration, Concentrate Handling and Port Operations. The total estimated operating cost for these five areas is $53.37/t processed for the base case, which excludes a gold recovery circuit. Table 2.3 provides a comparison between the current estimate by SNC-Lavalin and the 1994 and 1996 estimates by WGM and Davy.
The total estimated operating cost for a gold recovery circuit is $6.64/t processed. Therefore, the total estimated operating cost for the project including a gold recovery circuit is $60.01. All costs are estimated in 2nd quarter 2005 US$. The intended overall level of accuracy for the operating cost estimate is ±15%.
Table 2.3: Operating Cost Estimate – Summary
|
Area
|
|
WGM/Davy
1994
$/t Processed
|
|
|
WGM/Davy
1996
$/t Processed
|
|
|
SNC-Lavalin
2005
$/t Processed
|
|
|
Mine
|
|
|
16.82
|
|
|
|
17.03
|
|
|
|
22.25
|
|
|
Concentrator
|
|
|
13.63
|
|
|
|
19,17
|
*
|
|
|
14.70
|
|
|
General and
|
|
|
5.09
|
|
|
|
5.50
|
|
|
|
|
|
|
Administration
|
|
|
|
|
|
|
|
|
|
iU.UW
|
|
|
Concentrate Transportation
|
|
|
2.90
|
|
|
|
4.35
|
|
|
|
5.37
|
|
|
Port Operations
|
|
|
0.72
|
|
|
|
0.75
|
|
|
|
0.96
|
|
|
Total
|
|
|
39.16
|
|
|
|
46.80
|
|
|
|
53.37
|
|
| |
|
|
|
|
|
|
|
|
|
|
|
|
|
Gold Recovery Circuit
|
|
|
5.97
|
|
|
included with Concentrator
|
|
|
|
6.64
|
|
|
Total
|
|
|
45.13
|
|
|
|
46.80
|
|
|
|
60.01
|
|
MOLINARI CASH FLOW PROJECTIONS
| |
|
|
|
|
|
|
|
|
|
|
|
|
|
|
SUMMARY SHEET
|
|
|
|
|
|
|
|
|
|
|
|
Molinari & Associates
|
|
| |
|
|
|
|
|
|
|
|
|
|
|
|
|
|
|
|
|
19-Aug-07
|
|
|
AL MASANE CASH FLOW ASSUMPTIONS
|
|
|
|
|
|
|
|
| |
|
|
|
|
|
|
|
|
|
|
|
|
|
|
|
|
|
Assumption
|
|
|
Base Case
|
|
|
Scenario 1
|
|
|
Scenario 2
|
|
|
Scenari 3
|
|
|
Scenario 4
|
|
| |
|
|
(Avg. 2007 Prices)
|
|
|
|
|
|
|
|
|
|
|
|
|
|
| |
|
|
|
|
|
|
|
|
|
|
|
|
|
|
|
|
|
Ore Production
|
(tpa)
|
|
|
700,000
|
|
|
Expansion to
1,000,000
|
|
|
Expansion to
1,000,000
|
|
|
Expansion to
1,000,000
|
|
|
Expansion to
1,000,000
|
|
| |
|
|
|
|
|
|
|
|
|
|
|
|
|
|
|
|
|
|
Metal Prices
|
|
|
|
|
|
|
|
|
|
|
|
|
|
|
|
|
|
|
(Average for Minelife)
|
|
|
|
|
|
|
|
|
|
|
|
|
|
|
|
|
|
|
Zinc
|
USD
|
|
|
1.60
|
|
|
|
1.70
|
|
|
|
1.56
|
|
|
|
2.39
|
|
|
|
1.88
|
|
|
Copper
|
USD
|
|
|
3.18
|
|
|
|
3.36
|
|
|
|
3.48
|
|
|
|
5.20
|
|
|
|
4.09
|
|
|
Silver
|
USD
|
|
|
13.23
|
|
|
|
14.00
|
|
|
|
12.98
|
|
|
|
19.37
|
|
|
|
15.23
|
|
|
Gold
|
USD
|
|
|
659.00
|
|
|
|
699.00
|
|
|
|
663.00
|
|
|
|
991.89
|
|
|
|
778.80
|
|
| |
|
|
|
|
|
|
|
|
|
|
|
|
|
|
|
|
|
|
|
|
|
|
Capital Investment
|
000 USD
|
|
|
139,549
|
|
|
|
173,178
|
|
|
|
173,178
|
|
|
|
173,178
|
|
|
|
173,178
|
|
|
(Minelife)
|
|
|
|
|
|
|
|
|
|
|
|
|
|
|
|
|
|
|
|
|
|
| |
|
|
|
|
|
|
|
|
|
|
|
|
|
|
|
|
|
|
|
|
|
|
Avg. Operating Cost;
|
USD/t
|
|
|
57.92
|
|
|
|
52.81
|
|
|
|
52.55
|
|
|
|
52.81
|
|
|
|
52.81
|
|
| |
|
|
|
|
|
|
|
|
|
|
|
|
|
|
|
|
|
|
|
|
|
|
Economic Results
|
|
|
|
|
|
|
|
|
|
|
|
|
|
|
|
|
|
|
|
|
|
|
NPV @5%.
|
|
|
|
593,107
|
|
|
|
841,938
|
|
|
|
782,135
|
|
|
|
1,557,142
|
|
|
|
1,068,821
|
|
|
IRR
|
|
|
|
50.08
|
%
|
|
|
55.20
|
%
|
|
|
52.55
|
%
|
|
|
69.66
|
%
|
|
|
60.18
|
%
|
| |
|
|
|
|
|
|
|
|
|
|
|
|
|
|
|
|
|
|
|
|
|
| |
|
|
|
|
|
|
|
|
|
|
|
|
|
|
|
|
|
|
|
|
|
|
Base Case:
|
Production: 700,000 tpa for the 11 years
|
Capital Investment: Increased to 139.5 million to allow for to-days tight machinery supply
Metal prices: Average 2007 YTD Prices
|
Scenarios 1 to 4
|
Production is increased to 840,000 tonnes during year 5 and further to 1 million tonnes during year 9
|
|
Base Case
Capital Cost
Metal prices USD
Average 2007 YTD
|
139 million USD
Zn Average
Cu Average
Silver Average
Gold Average
|
|
|
1.60 3.18 13.23 659.00
|
|
|
|
|
|
|
|
|
|
AL MASANE PROJECT
CASH FLOW PROJECTIONS
PRE-FINANCING
PRE-TAX
|
(000 USD)
|
|
|
|
|
|
|
|
|
|
|
|
|
|
|
|
| |
|
|
|
|
|
|
|
|
|
|
|
|
|
|
|
|
|
|
|
|
|
|
|
|
|
|
|
|
|
|
|
|
|
|
|
|
| |
|
|
Total
|
|
Year -1
|
|
Year O
|
|
Year l
|
|
Year 2
|
|
Year 3
|
|
Year 4
|
|
Year 5
|
|
Year 6
|
|
Year 7
|
|
|
Year 8
|
|
|
Year 9
|
|
|
Year 10
|
|
|
Year 11
|
|
|
Total/Averg
|
| |
|
|
|
|
|
|
|
|
|
|
|
|
|
|
|
|
|
|
|
|
|
|
|
|
|
|
|
|
|
|
|
|
|
|
|
|
|
|
METAL PRICES
|
|
|
|
|
|
|
|
|
|
|
|
|
|
|
|
|
|
|
|
|
|
|
|
|
|
|
|
|
|
|
|
|
|
|
|
|
|
|
Zinc Price
|
USD/lb
|
|
|
1.60
|
|
|
|
|
|
|
|
1.60
|
|
|
1.60
|
|
|
1.60
|
|
|
1.60
|
|
|
1.60
|
|
|
1.60
|
|
|
1.60
|
|
|
|
1.60
|
|
|
|
1.60
|
|
|
|
1.60
|
|
|
|
1.60
|
|
|
1.60
|
|
Copper Price
|
USD/lb
|
|
|
3.18
|
|
|
|
|
|
|
|
3.18
|
|
|
3.18
|
|
|
3.18
|
|
|
3.18
|
|
|
3.18
|
|
|
3.18
|
|
|
3.18
|
|
|
|
3.18
|
|
|
|
3.18
|
|
|
|
3.18
|
|
|
|
3.18
|
|
|
3.18
|
|
Silver
|
USDoz
|
|
|
13.23
|
|
|
|
|
|
|
|
13.23
|
|
|
13.23
|
|
|
13.23
|
|
|
13.23
|
|
|
13.23
|
|
|
13.23
|
|
|
13.23
|
|
|
|
13.23
|
|
|
|
13.23
|
|
|
|
13.23
|
|
|
|
13.23
|
|
|
13.23
|
|
Gold
|
USD/oz
|
|
|
659.00
|
|
|
|
|
|
|
|
659.00
|
|
|
659.00
|
|
|
659.00
|
|
|
659.00
|
|
|
659.00
|
|
|
659.00
|
|
|
659.00
|
|
|
|
659.00
|
|
|
|
659.00
|
|
|
|
659.00
|
|
|
|
659.00
|
|
|
659.00
|
| |
|
|
|
|
|
|
|
|
|
|
|
|
|
|
|
|
|
|
|
|
|
|
|
|
|
|
|
|
|
|
|
|
|
|
|
|
|
|
|
|
|
|
|
|
|
|
|
|
|
|
PRODUCTION/REVENUE
|
|
|
|
|
|
|
|
|
|
|
|
|
|
|
|
|
|
|
|
|
|
|
|
|
|
|
|
|
|
|
|
|
|
|
|
|
|
|
|
|
|
|
|
|
|
|
|
|
|
|
Ore Milled
|
t
|
|
|
7,200,000
|
|
|
|
|
|
|
|
500,000
|
|
|
700,000
|
|
|
700,000
|
|
|
700,000
|
|
|
700,000
|
|
|
700,000
|
|
|
700,000
|
|
|
|
700,000
|
|
|
|
700,000
|
|
|
|
700,000
|
|
|
|
400,000
|
|
|
7,200,000
|
| |
|
|
|
|
|
|
|
|
|
|
|
|
|
|
|
|
|
|
|
|
|
|
|
|
|
|
|
|
|
|
|
|
|
|
|
|
|
|
|
|
|
|
|
|
|
|
|
|
|
|
Zinc ConcenIrate
|
t
|
|
|
592,957
|
|
|
|
|
|
|
|
41,178
|
|
|
57,649
|
|
|
57,649
|
|
|
57,649
|
|
|
57,649
|
|
|
57,649
|
|
|
57,649
|
|
|
|
57,649
|
|
|
|
57,649
|
|
|
|
57,649
|
|
|
|
32,942
|
|
|
592,957
|
|
Copper Concentrate
|
t
|
|
|
358,658
|
|
|
|
|
|
|
|
24,907
|
|
|
34,870
|
|
|
34,870
|
|
|
34,870
|
|
|
34,370
|
|
|
34,870
|
|
|
34,870
|
|
|
|
34,870
|
|
|
|
34,870
|
|
|
|
34,870
|
|
|
|
19,925
|
|
|
353,653
|
|
Gold
|
oz
|
|
|
76,844
|
|
|
|
|
|
|
|
5,336
|
|
|
7,471
|
|
|
7,471
|
|
|
7,471
|
|
|
7,471
|
|
|
7,471
|
|
|
7,471
|
|
|
|
7,471
|
|
|
|
7,471
|
|
|
|
7,471
|
|
|
|
4,269
|
|
|
76,844
|
|
Silver
|
oz
|
|
|
3,753,675
|
|
|
|
|
|
|
|
260,672
|
|
|
364,941
|
|
|
364,941
|
|
|
364,941
|
|
|
364,941
|
|
|
364,941
|
|
|
364,941
|
|
|
|
364,941
|
|
|
|
364,941
|
|
|
|
364,941
|
|
|
|
208,538
|
|
|
3,753,675
|
| |
|
|
|
|
|
|
|
|
|
|
|
|
|
|
|
|
|
|
|
|
|
|
|
|
|
|
|
|
|
|
|
|
|
|
|
|
|
|
|
|
|
|
|
|
|
|
|
|
|
|
Total Revenue
|
USD
|
|
|
1,548,959
|
|
|
|
|
|
|
|
107,567
|
|
|
150,593
|
|
|
150,593
|
|
|
150,593
|
|
|
150,593
|
|
|
150,593
|
|
|
150,593
|
|
|
|
150,593
|
|
|
|
150,593
|
|
|
|
150,593
|
|
|
|
86,053
|
|
|
1,548,959
|
| |
|
|
|
|
|
|
|
|
|
|
|
|
|
|
|
|
|
|
|
|
|
|
|
|
|
|
|
|
|
|
|
|
|
|
|
|
|
|
|
|
|
|
|
|
|
|
|
|
0
|
|
Total Operating Costs
|
USD
|
|
|
417,012
|
|
|
|
|
|
|
|
28,959
|
|
|
40,543
|
|
|
40,543
|
|
|
40,543
|
|
|
40,543
|
|
|
40,543
|
|
|
40,543
|
|
|
|
40,543
|
|
|
|
40,543
|
|
|
|
40,543
|
|
|
|
23,167
|
|
|
417,012
|
|
Freight&lnsurance
|
USD
|
|
|
66,423
|
|
|
|
|
|
|
|
4,613
|
|
|
6,458
|
|
|
6,458
|
|
|
6,458
|
|
|
6,458
|
|
|
6,458
|
|
|
6,458
|
|
|
|
6,458
|
|
|
|
6,453
|
|
|
|
6,458
|
|
|
|
3,690
|
|
|
66,423 0
|
| |
|
|
|
|
|
|
|
|
|
|
|
|
|
|
|
|
|
|
|
|
|
|
|
|
|
|
|
|
|
|
|
|
|
|
|
|
|
|
|
|
|
|
|
|
|
|
|
|
|
|
Operating Cash Profit
|
USD
|
|
|
1,065,524
|
|
|
|
|
|
|
|
73,995
|
|
|
103,593
|
|
|
103,593
|
|
|
103,593
|
|
|
103,593
|
|
|
103,593
|
|
|
103,593
|
|
|
|
103,593
|
|
|
|
103,593
|
|
|
|
103,593
|
|
|
|
59,196
|
|
|
1,065,524
|
| |
|
|
|
|
|
|
|
|
|
|
|
|
|
|
|
|
|
|
|
|
|
|
|
|
|
|
|
|
|
|
|
|
|
|
|
|
|
|
|
|
|
|
|
|
|
|
|
|
|
|
Project Cash Flow
|
USD
|
|
|
|
|
|
|
|
|
|
|
|
|
|
|
|
|
|
|
|
|
|
|
|
|
|
|
|
|
|
|
|
|
|
|
|
|
|
|
|
|
|
|
|
|
|
|
|
|
|
Cash Operating Profit
|
USD
|
|
|
1,065,524
|
|
|
|
|
|
|
|
73,995
|
|
|
103,593
|
|
|
103,593
|
|
|
103,593
|
|
|
103,593
|
|
|
103,593
|
|
|
103,593
|
|
|
|
103,593
|
|
|
|
103,593
|
|
|
|
103,593
|
|
|
|
59,196
|
|
|
1,065,524
|
|
Less: Capital Invest.
|
USD
|
|
|
139,549
|
|
|
62,382
|
|
|
70,129
|
|
|
0
|
|
|
0
|
|
|
0
|
|
|
0
|
|
|
0
|
|
|
0
|
|
|
0
|
|
|
|
3,519
|
|
|
|
3,519
|
|
|
|
0
|
|
|
|
0
|
|
|
139,549
|
|
Working Cap.
|
USD
|
|
|
0
|
|
|
|
|
|
|
|
|
24,478
|
|
|
9,791
|
|
|
0
|
|
|
0
|
|
|
0
|
|
|
0
|
|
|
0
|
|
|
|
0
|
|
|
|
0
|
|
|
|
0
|
|
|
|
-34,270
|
|
|
0
|
| |
USD
|
|
|
|
|
|
|
|
|
|
|
|
|
|
|
|
|
|
|
|
|
|
|
|
|
|
|
|
|
|
|
|
|
|
|
|
|
|
|
|
|
|
|
|
|
|
|
|
|
0
|
|
Net Cash Flow
|
USD
|
|
|
925,975
|
|
|
-62,332
|
|
|
-70,129
|
|
|
49,516
|
|
|
93,801
|
|
|
103,593
|
|
|
103,593
|
|
|
103,593
|
|
|
103,593
|
|
|
103,593
|
|
|
|
100,074
|
|
|
|
100,074
|
|
|
|
103,593
|
|
|
|
93,466
|
|
|
925,975
|
|
Accum. NCF
|
USD
|
|
|
925,975
|
|
|
-62,382
|
|
|
-132,511
|
|
|
-82,995
|
|
|
10,807
|
|
|
114,399
|
|
|
217,992
|
|
|
321,584
|
|
|
425,177
|
|
|
528,770
|
|
|
|
628,843
|
|
|
|
728,917
|
|
|
|
832,510
|
|
|
|
925,975
|
|
|
|
| |
|
|
|
|
|
|
|
|
|
|
|
|
|
|
|
|
|
|
|
|
|
|
|
|
|
|
|
|
|
|
|
|
|
|
|
|
|
|
|
|
|
|
|
|
|
|
|
|
|
|
|
NPV of NCF@5%
|
USD
|
|
|
593,107
|
|
|
|
|
|
|
|
|
|
|
|
|
|
|
|
|
|
|
|
|
|
|
|
|
|
|
|
|
|
|
|
|
|
|
|
|
|
|
|
|
|
|
|
|
|
|
|
NPV of NCF @ 10%
|
USD
|
|
|
388,558
|
|
|
|
|
|
|
|
|
|
|
|
|
|
|
|
|
|
|
|
|
|
|
|
|
|
|
|
|
|
|
|
|
|
|
|
|
|
|
|
|
|
|
|
|
|
|
|
NPV of NCF® 15%
|
USD
|
|
|
258,262
|
|
|
|
|
|
|
|
|
|
|
|
|
|
|
|
|
|
|
|
|
|
|
|
|
|
|
|
|
|
|
|
|
|
|
|
|
|
|
|
|
|
|
|
|
|
|
| |
|
|
|
|
|
|
|
|
|
|
|
|
|
|
|
|
|
|
|
|
|
|
|
|
|
|
|
|
|
|
|
|
|
|
|
|
|
|
|
|
|
|
|
|
|
|
|
|
|
|
|
Project IRR
|
|
|
|
50.08
|
|
|
|
|
|
|
|
|
|
|
|
|
|
|
|
|
|
|
|
|
|
|
|
|
|
|
|
|
|
|
|
|
|
|
|
|
|
|
|
|
|
|
|
|
|
|
| |
|
|
|
|
|
|
|
|
|
|
|
|
|
|
|
|
|
|
|
|
|
|
|
|
|
|
|
|
|
|
|
|
|
|
|
|
|
|
|
|
|
|
|
|
|
|
|
|
|
|
| |
|
|
|
|
|
|
|
|
|
|
|
|
|
|
|
|
|
|
|
|
|
|
|
|
|
|
|
|
|
|
|
|
|
|
|
|
|
|
|
|
|
|
|
|
|
|
|
|
|
|
|
Scenario 1
|
|
|
|
|
|
|
|
|
|
|
|
|
AL MASANE PROJECT
|
|
|
|
|
|
|
|
|
|
|
|
|
|
|
|
|
|
Capital Cost
|
173 million USD
|
|
|
|
|
|
|
|
|
|
|
|
CASH FLOW PROJECTIONS
|
|
(000 USD)
|
|
|
|
|
|
|
|
|
|
|
|
|
|
Metal prices USD
|
Zn Average
|
|
|
1.70
|
|
|
|
|
|
|
|
|
|
PRE-FINANCING
|
|
|
|
|
|
|
|
|
|
|
|
|
|
|
|
|
| |
Cu Average
|
|
|
3.36
|
|
|
|
|
|
|
|
|
|
PRE-TAX
|
|
|
|
|
|
|
|
|
|
|
|
|
|
|
|
|
| |
Silver Average
|
|
|
14.00
|
|
|
|
|
|
|
|
|
|
|
|
|
|
|
|
|
|
|
|
|
|
|
|
|
|
|
|
|
|
|
| |
Gold Average
|
|
|
699.00
|
|
|
|
|
|
|
|
|
|
|
|
|
|
|
|
|
|
|
|
|
|
|
|
|
|
|
|
|
|
|
| |
|
|
|
|
|
|
|
|
|
|
|
|
|
|
|
|
|
|
|
|
|
|
|
|
|
|
|
|
|
|
|
|
|
|
|
|
| |
|
|
Total
|
|
Year-1
|
|
Year O
|
|
Year 1
|
|
Year 2
|
|
Year3
|
|
Year 4
|
|
Year 5
|
|
Year 6
|
|
Year 7
|
|
Years
|
|
|
Year 9
|
|
|
Year 10
|
|
|
Year 11
|
|
|
Total/Averg
|
| |
|
|
|
|
|
|
|
|
|
|
|
|
|
|
|
|
|
|
|
|
|
|
|
|
|
|
|
|
|
|
|
|
|
|
|
|
|
METAL PRICES
|
|
|
|
|
|
|
|
|
|
|
|
|
|
|
|
|
|
|
|
|
|
|
|
|
|
|
|
|
|
|
|
|
|
|
|
|
|
Zinc Price
|
USD/lb
|
|
|
1.70
|
|
|
|
|
|
|
|
1.70
|
|
|
1.70
|
|
|
1.70
|
|
|
1.70
|
|
|
1.70
|
|
|
1.70
|
|
|
1.70
|
|
|
1.70
|
|
|
|
1.70
|
|
|
|
1.70
|
|
|
|
1.70
|
|
|
1.70
|
|
Copper Price
|
USD/lb
|
|
|
3.36
|
|
|
|
|
|
|
|
3.36
|
|
|
3.36
|
|
|
3.36
|
|
|
3.36
|
|
|
3.36
|
|
|
3.36
|
|
|
3.36
|
|
|
3.36
|
|
|
|
3.36
|
|
|
|
3.36
|
|
|
|
3.36
|
|
|
3.36
|
|
Silver
|
USDoz
|
|
|
14.00
|
|
|
|
|
|
|
|
14.00
|
|
|
14.00
|
|
|
14.00
|
|
|
14.00
|
|
|
14.00
|
|
|
14.00
|
|
|
14.00
|
|
|
14.00
|
|
|
|
14.00
|
|
|
|
14.00
|
|
|
|
14.00
|
|
|
14.00
|
|
Gold
|
USD/oz
|
|
|
699.00
|
|
|
|
|
|
|
|
699.00
|
|
|
699.00
|
|
|
699,00
|
|
|
699.00
|
|
|
699.00
|
|
|
699.00
|
|
|
699.00
|
|
|
699.00
|
|
|
|
699.00
|
|
|
|
699.00
|
|
|
|
699.00
|
|
|
699.00
|
| |
|
|
|
|
|
|
|
|
|
|
|
|
|
|
|
|
|
|
|
|
|
|
|
|
|
|
|
|
|
|
|
|
|
|
|
|
|
|
|
|
|
|
|
|
|
|
|
|
|
PRODUCTION/REVENUE
|
|
|
|
|
|
|
|
|
|
|
|
|
|
|
|
|
|
|
|
|
|
|
|
|
|
|
|
|
|
|
|
|
|
|
|
|
|
|
|
|
|
|
|
|
|
|
|
|
|
Ore Milled
|
t
|
|
|
8,984,000
|
|
|
|
|
|
|
|
500,000
|
|
|
700,000
|
|
|
700,000
|
|
|
700,000
|
|
|
840,000
|
|
|
840,000
|
|
|
840,000
|
|
|
840,000
|
|
|
|
1,008,000
|
|
|
|
1,003,000
|
|
|
|
1,008,000
|
|
|
8,984.000
|
| |
|
|
|
|
|
|
|
|
|
|
|
|
|
|
|
|
|
|
|
|
|
|
|
|
|
|
|
|
|
|
|
|
|
|
|
|
|
|
|
|
|
|
|
|
|
|
|
|
|
Zinc Concentrate
|
t
|
|
|
739,878
|
|
|
|
|
|
|
|
41,178
|
|
|
57,649
|
|
|
57,649
|
|
|
57,649
|
|
|
69,178
|
|
|
69,178
|
|
|
69,178
|
|
|
69,178
|
|
|
|
33,014
|
|
|
|
83,014
|
|
|
|
83,014
|
|
|
739,878
|
|
Copper Concentrate
|
t
|
|
|
447,525
|
|
|
|
|
|
|
|
24,907
|
|
|
34,870
|
|
|
34,870
|
|
|
34,870
|
|
|
41,843
|
|
|
41,843
|
|
|
41,843
|
|
|
41,343
|
|
|
|
50,212
|
|
|
|
50,212
|
|
|
|
50,212
|
|
|
447,525
|
|
Gold
|
oz
|
|
|
95,885
|
|
|
|
|
|
|
|
5,336
|
|
|
7,471
|
|
|
7,471
|
|
|
7,471
|
|
|
8,965
|
|
|
8,965
|
|
|
8,965
|
|
|
8,965
|
|
|
|
10,758
|
|
|
|
10,758
|
|
|
|
10,758
|
|
|
95,885
|
|
Silver
|
oz
|
|
|
4,683,752
|
|
|
|
|
|
|
|
260,672
|
|
|
364,941
|
|
|
364,941
|
|
|
364,941
|
|
|
437,929
|
|
|
437,929
|
|
|
437,929
|
|
|
437,929
|
|
|
|
525,515
|
|
|
|
525,515
|
|
|
|
525,515
|
|
|
4,683,752
|
| |
|
|
|
|
|
|
|
|
|
|
|
|
|
|
|
|
|
|
|
|
|
|
|
|
|
|
|
|
|
|
|
|
|
|
|
|
|
|
|
|
|
|
|
|
|
|
|
|
|
Total Revenue
|
USD
|
|
|
2,065,470
|
|
|
|
|
|
|
|
114,953
|
|
|
160,934
|
|
|
160,934
|
|
|
160,934
|
|
|
193,121
|
|
|
193,121
|
|
|
193,121
|
|
|
193,121
|
|
|
|
231,745
|
|
|
|
231,745
|
|
|
|
231,745
|
|
|
2,065,470
|
| |
|
|
|
|
|
|
|
|
|
|
|
|
|
|
|
|
|
|
|
|
|
|
|
|
|
|
|
|
|
|
|
|
|
|
|
|
|
|
|
|
|
|
|
|
|
|
|
0
|
|
Total Operating Costs
|
USD
|
|
|
467,601
|
|
|
|
|
|
|
|
28,959
|
|
|
40,543
|
|
|
40,543
|
|
|
40,543
|
|
|
43,786
|
|
|
43,786
|
|
|
43,786
|
|
|
43,786
|
|
|
|
47,289
|
|
|
|
47,289
|
|
|
|
47,289
|
|
|
467,601
|
|
Freight & Insurance
|
USD
|
|
|
92,617
|
|
|
|
|
|
|
|
5,155
|
|
|
7,216
|
|
|
7,216
|
|
|
7,216
|
|
|
8,660
|
|
|
8,660
|
|
|
8,660
|
|
|
8,660
|
|
|
|
10,392
|
|
|
|
10,392
|
|
|
|
10,392
|
|
|
92,617 0
|
| |
|
|
|
|
|
|
|
|
|
|
|
|
|
|
|
|
|
|
|
|
|
|
|
|
|
|
|
|
|
|
|
|
|
|
|
|
|
|
|
|
|
|
|
|
|
|
|
|
|
Operating Cash Profit
|
USD
|
|
|
1,505,252
|
|
|
|
|
|
|
|
80,839
|
|
|
113,174
|
|
|
113,174
|
|
|
113,174
|
|
|
140,674
|
|
|
140,674
|
|
|
140,674
|
|
|
140,674
|
|
|
|
174,064
|
|
|
|
174,064
|
|
|
|
174,064
|
|
|
1,505,252
|
| |
|
|
|
|
|
|
|
|
|
|
|
|
|
|
|
|
|
|
|
|
|
|
|
|
|
|
|
|
|
|
|
|
|
|
|
|
|
|
|
|
|
|
|
|
|
|
|
0
|
|
Project Cash Flow
|
USD
|
|
|
|
|
|
|
|
|
|
|
|
|
|
|
|
|
|
|
|
|
|
|
|
|
|
|
|
|
|
|
|
|
|
|
|
|
|
|
|
|
|
|
|
|
|
|
0
|
|
Cash Operating Profit
|
USD
|
|
|
1,505,252
|
|
|
|
|
|
|
|
80,839
|
|
|
113,174
|
|
|
113,174
|
|
|
113,174
|
|
|
140,674
|
|
|
140,674
|
|
|
140,674
|
|
|
140,674
|
|
|
|
174,064
|
|
|
|
174,064
|
|
|
|
174,064
|
|
|
1,505,252
|
|
Less: Capital Invest.
|
USD
|
|
|
173,178
|
|
|
59,366
|
|
|
78,812
|
|
|
0
|
|
|
0
|
|
|
0
|
|
|
20,000
|
|
|
0
|
|
|
0
|
|
|
0
|
|
|
15,000
|
|
|
|
0
|
|
|
|
0
|
|
|
|
0
|
|
|
173,178
|
|
Working Cap.
|
USD
|
|
|
0
|
|
|
|
|
|
|
|
|
26,325
|
|
|
10,530
|
|
|
0
|
|
|
0
|
|
|
-36,855
|
|
|
0
|
|
|
0
|
|
|
0
|
|
|
|
0
|
|
|
|
0
|
|
|
|
0
|
|
|
0
|
| |
USD
|
|
|
|
|
|
|
|
|
|
|
|
|
|
|
|
|
|
|
|
|
|
|
|
|
|
|
|
|
|
|
|
|
|
|
|
|
|
|
|
|
|
|
|
|
|
|
|
0
|
| |
|
|
|
|
|
|
|
|
|
|
|
|
|
|
|
|
|
|
|
|
|
|
|
|
|
|
|
|
|
|
|
|
|
|
|
|
|
|
|
|
|
|
|
|
|
|
|
|
|
|
Accum. NCF
|
USD
|
|
|
1,332,074
|
|
- |
59,366
|
|
- |
138,178
|
|
|
-83,664
|
|
|
18,980
|
|
|
132,155
|
|
|
225,329
|
|
|
402,859
|
|
|
543,533
|
|
|
684,208
|
|
|
809,882
|
|
|
|
983,946
|
|
|
|
1,158,010
|
|
|
|
1,332,074
|
|
|
|
| |
|
|
|
|
|
|
|
|
|
|
|
|
|
|
|
|
|
|
|
|
|
|
|
|
|
|
|
|
|
|
|
|
|
|
|
|
|
|
|
|
|
|
|
|
|
|
|
|
|
|
NPV of NCF@5%
|
USD
|
|
|
841,938
|
|
|
|
|
|
|
|
|
|
|
|
|
|
|
|
|
|
|
|
|
|
|
|
|
|
|
|
|
|
|
|
|
|
|
|
|
|
|
|
|
|
|
|
|
|
|
NPV of NCF @ 10%
|
USD
|
|
|
546,558
|
|
|
|
|
|
|
|
|
|
|
|
|
|
|
|
|
|
|
|
|
|
|
|
|
|
|
|
|
|
|
|
|
|
|
|
|
|
|
|
|
|
|
|
|
|
|
NPV of NCF @ 15%
|
USD
|
|
|
361,883
|
|
|
|
|
|
|
|
|
|
|
|
|
|
|
|
|
|
|
|
|
|
|
|
|
|
|
|
|
|
|
|
|
|
|
|
|
|
|
|
|
|
|
|
|
|
| |
|
|
|
|
|
|
|
|
|
|
|
|
|
|
|
|
|
|
|
|
|
|
|
|
|
|
|
|
|
|
|
|
|
|
|
|
|
|
|
|
|
|
|
|
|
|
|
|
|
|
Project IRR
|
|
|
|
55.20
|
|
|
|
|
|
|
|
|
|
|
|
|
|
|
|
|
|
|
|
|
|
|
|
|
|
|
|
|
|
|
|
|
|
|
|
|
|
|
|
|
|
|
|
|
|
| |
|
|
|
|
|
|
|
|
|
|
|
|
|
|
|
|
|
|
|
|
|
|
|
|
|
|
|
|
|
|
|
|
|
|
|
|
|
|
|
|
|
|
|
|
|
|
|
|
|
| |
|
|
|
|
|
|
|
|
|
|
|
Scenario 2
|
|
|
|
|
|
|
|
|
|
|
|
|
|
|
|
AL MASANE PROJECT
|
|
|
|
|
|
|
|
|
|
|
|
|
|
Capital Cost
|
173 million USD
|
|
|
|
|
|
|
|
|
|
|
|
|
CASH FLOW PROJECTIONS
|
|
(000 USD)
|
|
|
|
|
|
|
|
|
|
Metal prices USD
|
Zn Average
|
|
|
|
1.56
|
|
|
|
|
|
|
|
|
|
PRE-FINANCING
|
|
|
|
|
|
|
|
|
|
|
|
|
| |
Cu Average
|
|
|
|
3.48
|
|
|
|
|
|
|
|
|
|
PRE-TAX
|
|
|
|
|
|
|
|
|
|
|
|
|
| |
Silver Average
|
|
|
|
12.98
|
|
|
|
|
|
|
|
|
|
|
|
|
|
|
|
|
|
|
|
|
|
|
|
|
|
|
| |
Gold Average
|
|
|
|
663.00
|
|
|
|
|
|
|
|
|
|
|
|
|
|
|
|
|
|
|
|
|
|
|
|
|
|
|
| |
|
|
|
|
|
|
|
|
|
|
|
|
|
|
|
|
|
|
|
|
|
|
|
|
|
|
|
|
|
|
|
|
|
| |
|
|
Total
|
|
|
Year -1
|
|
Year O
|
|
Year 1
|
|
Year 2
|
|
Year 3
|
|
Year 4
|
|
Year 5
|
|
Year 6
|
|
Year 7
|
|
Year 8
|
|
Year 9
|
|
Year 10
|
|
Year 11
|
|
Total/Averg
|
|
METAL PRICES
|
|
|
|
|
|
|
|
|
|
|
|
|
|
|
|
|
|
|
|
|
|
|
|
|
|
|
|
|
|
|
|
|
|
|
Zinc Price
|
USD/lb
|
|
|
1.56
|
|
|
|
|
|
|
|
|
1.56
|
|
|
1,56
|
|
|
1.56
|
|
|
1.56
|
|
|
1.56
|
|
|
1.56
|
|
|
1.56
|
|
|
1.56
|
|
|
1.56
|
|
|
1.56
|
|
|
1.56
|
|
1.56
|
|
Copper Price
|
USD/lb
|
|
|
3.48
|
|
|
|
|
|
|
|
|
3.48
|
|
|
3.43
|
|
|
3.48
|
|
|
3.48
|
|
|
3.48
|
|
|
3.48
|
|
|
3.48
|
|
|
3.48
|
|
|
3.48
|
|
|
3.48
|
|
|
3.48
|
|
3.48
|
|
Silver
|
USDoz
|
|
|
12.98
|
|
|
|
|
|
|
|
|
12,98
|
|
|
12.98
|
|
|
12.98
|
|
|
12.98
|
|
|
12.98
|
|
|
12.98
|
|
|
12,98
|
|
|
12.98
|
|
|
12.98
|
|
|
12.98
|
|
|
12.98
|
|
12.98
|
|
Gold
|
USD/oz
|
|
|
663.00
|
|
|
|
|
|
|
|
|
663.00
|
|
|
663.00
|
|
|
663.00
|
|
|
663.00
|
|
|
663.00
|
|
|
663.00
|
|
|
663.00
|
|
|
663.00
|
|
|
663.00
|
|
|
663.00
|
|
|
663.00
|
|
663.00
|
| |
|
|
|
|
|
|
|
|
|
|
|
|
|
|
|
|
|
|
|
|
|
|
|
|
|
|
|
|
|
|
|
|
|
|
|
|
|
|
|
|
|
|
|
|
|
|
PRODUCTION/REVENUE
|
|
|
|
|
|
|
|
|
|
|
|
|
|
|
|
|
|
|
|
|
|
|
|
|
|
|
|
|
|
|
|
|
|
|
|
|
|
|
|
|
|
|
|
|
|
|
Ore Milled
|
t
|
|
|
8,934,000
|
|
|
|
|
|
|
|
|
500,000
|
|
|
700,000
|
|
|
700,000
|
|
|
700,000
|
|
|
840,000
|
|
|
340,000
|
|
|
840,000
|
|
|
840,000
|
|
|
1,008,000
|
|
|
1,008,000
|
|
|
1,008,000
|
|
8,984,000
|
| |
|
|
|
|
|
|
|
|
|
|
|
|
|
|
|
|
|
|
|
|
|
|
|
|
|
|
|
|
|
|
|
|
|
|
|
|
|
|
|
|
|
|
|
|
|
|
Zinc Concentrate
|
t
|
|
|
739,878
|
|
|
|
|
|
|
|
|
41,178
|
|
|
57,649
|
|
|
57,649
|
|
|
57,649
|
|
|
69,178
|
|
|
69,178
|
|
|
69,178
|
|
|
69,178
|
|
|
83,014
|
|
|
83,014
|
|
|
83,014
|
|
739,878
|
|
Copper Concentrate
|
t
|
|
|
447,525
|
|
|
|
|
|
|
|
|
24,907
|
|
|
34,870
|
|
|
34,870
|
|
|
34,870
|
|
|
41,843
|
|
|
41,843
|
|
|
41,843
|
|
|
41,843
|
|
|
50,212
|
|
|
50,212
|
|
|
50,212
|
|
447,525
|
|
Gold
|
oz
|
|
|
95,885
|
|
|
|
|
|
|
|
|
5,336
|
|
|
7,471
|
|
|
7,471
|
|
|
7,471
|
|
|
8,965
|
|
|
3,965
|
|
|
8,965
|
|
|
8,965
|
|
|
10.758
|
|
|
10,758
|
|
|
10,758
|
|
95,885
|
|
Silver
|
oz
|
|
|
4,683,752
|
|
|
|
|
|
|
|
|
260,672
|
|
|
364,941
|
|
|
364,941
|
|
|
364,941
|
|
|
437,929
|
|
|
437,929
|
|
|
437,929
|
|
|
437,929
|
|
|
525,515
|
|
|
525,515
|
|
|
525,515
|
|
4,633,752
|
| |
|
|
|
|
|
|
|
|
|
|
|
|
|
|
|
|
|
|
|
|
|
|
|
|
|
|
|
|
|
|
|
|
|
|
|
|
|
|
|
|
|
|
|
|
|
|
Total Revenue
|
USD
|
|
|
1,973,224
|
|
|
|
|
|
|
|
|
109,819
|
|
|
153,746
|
|
|
153,746
|
|
|
153,746
|
|
|
184,496
|
|
|
184,496
|
|
|
184,496
|
|
|
184,496
|
|
|
221,395
|
|
|
221,395
|
|
|
221,395
|
|
1,973,224
|
| |
|
|
|
|
|
|
|
|
|
|
|
|
|
|
|
|
|
|
|
|
|
|
|
|
|
|
|
|
|
|
|
|
|
|
|
|
|
|
|
|
|
|
|
|
0
|
|
Total Operating Costs
|
USD
|
|
|
467,605
|
|
|
|
|
|
|
|
|
28,960
|
|
|
40,544
|
|
|
40,544
|
|
|
40,544
|
|
|
43,789
|
|
|
43.789
|
|
|
43,789
|
|
|
43,789
|
|
|
47,285
|
|
|
47,285
|
|
|
47,285
|
|
467,605
|
|
Freight&lnsurance
|
USD
|
|
|
92,617
|
|
|
|
|
|
|
|
|
5,155
|
|
|
7,216
|
|
|
7,216
|
|
|
7,216
|
|
|
8,660
|
|
|
8.660
|
|
|
8,660
|
|
|
8,660
|
|
|
10,392
|
|
|
10,392
|
|
|
10,392
|
|
92,617o
|
| |
|
|
|
|
|
|
|
|
|
|
|
|
|
|
|
|
|
|
|
|
|
|
|
|
|
|
|
|
|
|
|
|
|
|
|
|
|
|
|
|
|
|
|
|
|
|
Operating Cash Profit
|
USD
|
|
|
1,413,002
|
|
|
|
|
|
|
|
|
75,704
|
|
|
105,986
|
|
|
105,986
|
|
|
105,986
|
|
|
132,047
|
|
|
132,047
|
|
|
132,047
|
|
|
132,047
|
|
|
163,718
|
|
|
163,718
|
|
|
163,718
|
|
1,413,002
|
| |
|
|
|
|
|
|
|
|
|
|
|
|
|
|
|
|
|
|
|
|
|
|
|
|
|
|
|
|
|
|
|
|
|
|
|
|
|
|
|
|
|
|
|
|
|
|
Project Cash Flow
|
USD
|
|
|
|
|
|
|
|
|
|
|
|
|
|
|
|
|
|
|
|
|
|
|
|
|
|
|
|
|
|
|
|
|
|
|
|
|
|
|
|
|
|
|
|
|
|
Cash Operating Profit
|
USD
|
|
|
1.413,002
|
|
|
|
|
|
|
|
|
75,704
|
|
|
105,936
|
|
|
105,986
|
|
|
105,986
|
|
|
132,047
|
|
|
132.047
|
|
|
132,047
|
|
|
132,047
|
|
|
163,718
|
|
|
163,718
|
|
|
163,718
|
|
1,413,002
|
|
Less: Capital Invest.
|
USD
|
|
|
173,178
|
|
|
|
59,366
|
|
|
78,812
|
|
|
0
|
|
|
0
|
|
|
0
|
|
|
20,000
|
|
|
0
|
|
|
0
|
|
|
0
|
|
|
15,000
|
|
|
0
|
|
|
0
|
|
|
0
|
|
173,178
|
|
Working Cap.
|
USD
|
|
|
0
|
|
|
|
|
|
|
|
|
|
25,041
|
|
|
10,017
|
|
|
0
|
|
|
0
|
|
|
-35,058
|
|
|
0
|
|
|
0
|
|
|
0
|
|
|
0
|
|
|
0
|
|
|
0
|
|
0
|
| |
USD
|
|
|
|
|
|
|
|
|
|
|
|
|
|
|
|
|
|
|
|
|
|
|
|
|
|
|
|
|
|
|
|
|
|
|
|
|
|
|
|
|
|
|
|
|
0
|
| |
|
|
|
|
|
|
|
|
|
|
|
|
|
|
|
|
|
|
|
|
|
|
|
|
|
|
|
|
|
|
|
|
|
|
|
|
|
|
|
|
|
|
|
|
|
|
|
Net Cash Flow
|
USD
|
|
|
1,239,824
|
|
|
- |
59,366
|
|
|
-78,812
|
|
|
50,663
|
|
|
95,969
|
|
|
105,936
|
|
|
85,986
|
|
|
167,105
|
|
|
132,047
|
|
|
132,047
|
|
|
117,047
|
|
|
163,718
|
|
|
163,718
|
|
|
163,718
|
|
1,239,824
|
|
Accum. NCF
|
USD
|
|
|
1,239,824
|
|
|
- |
59,366
|
|
- |
138,178
|
|
|
-87,515
|
|
|
8,454
|
|
|
114,440
|
|
|
200,426
|
|
|
367,531
|
|
|
499,577
|
|
|
631,624
|
|
|
748,671
|
|
|
912,388
|
|
|
1,076,106
|
|
|
1,239,824
|
|
|
| |
|
|
|
|
|
|
|
|
|
|
|
|
|
|
|
|
|
|
|
|
|
|
|
|
|
|
|
|
|
|
|
|
|
|
|
|
|
|
|
|
|
|
|
|
|
|
|
NPV of NCF @ 5%
|
USD
|
|
|
780,719
|
|
|
|
|
|
|
|
|
|
|
|
|
|
|
|
|
|
|
|
|
|
|
|
|
|
|
|
|
|
|
|
|
|
|
|
|
|
|
|
|
|
|
|
NPV of NCF @ 10%
|
USD
|
|
|
504,305
|
|
|
|
|
|
|
|
|
|
|
|
|
|
|
|
|
|
|
|
|
|
|
|
|
|
|
|
|
|
|
|
|
|
|
|
|
|
|
|
|
|
|
|
NPV ot NCF @ 15%
|
USD
|
|
|
331,639
|
|
|
|
|
|
|
|
|
|
|
|
|
|
|
|
|
|
|
|
|
|
|
|
|
|
|
|
|
|
|
|
|
|
|
|
|
|
|
|
|
|
|
| |
|
|
|
|
|
|
|
|
|
|
|
|
|
|
|
|
|
|
|
|
|
|
|
|
|
|
|
|
|
|
|
|
|
|
|
|
|
|
|
|
|
|
|
|
|
|
|
Project IRR
|
|
|
|
52.55
|
%
|
|
|
|
|
|
|
|
|
|
|
|
|
|
|
|
|
|
|
|
|
|
|
|
|
|
|
|
|
|
|
|
|
|
|
|
|
|
|
|
|
|
| |
|
|
|
|
|
|
|
|
|
|
|
|
|
|
|
|
|
|
|
|
|
|
|
|
|
|
|
|
|
|
|
|
|
|
|
|
|
|
|
|
|
|
|
|
|
|
| |
|
|
|
|
|
|
|
|
|
|
|
|
|
|
|
|
|
|
|
|
|
|
|
|
|
|
|
|
|
|
|
|
|
|
|
|
|
|
|
|
|
|
|
|
|
|
|
Scenario 3
|
|
|
|
|
|
|
|
|
|
|
|
|
|
|
|
|
AL MASANE PROJECT
|
|
|
|
|
|
|
|
|
|
|
|
|
|
|
Capital Cost
|
173 million USD
|
|
|
|
|
|
|
|
|
|
|
|
|
|
CASH FLOW PROJECTIONS
|
|
(000 USD)
|
|
|
|
|
|
|
|
|
|
|
Metal prices USD
|
Zn Average
|
|
|
2.39
|
|
|
|
|
|
|
|
|
|
|
|
PRE-FINANCING
|
|
|
|
|
|
|
|
|
|
|
|
|
|
| |
Cu Average
|
|
|
5.20
|
|
|
|
|
|
|
|
|
|
|
|
PRE-TAX
|
|
|
|
|
|
|
|
|
|
|
|
|
|
| |
Silver Average
|
|
|
19.37
|
|
|
|
|
|
|
|
|
|
|
|
|
|
|
|
|
|
|
|
|
|
|
|
|
|
|
|
| |
Gold Average
|
|
|
991.89
|
|
|
|
|
|
|
|
|
|
|
|
|
|
|
|
|
|
|
|
|
|
|
|
|
|
|
|
| |
|
|
|
|
|
|
|
|
|
|
|
|
|
|
|
|
|
|
|
|
|
|
|
|
|
|
|
|
|
|
|
|
|
| |
|
|
|
|
|
|
|
|
|
|
|
|
|
|
|
|
|
|
|
|
|
|
|
|
|
|
|
|
|
|
|
|
|
| |
|
|
Total
|
|
Year -1
|
|
|
Year O
|
|
Year 1
|
|
Year 2
|
|
Year 3
|
|
|
Year 4
|
Year 5
|
Year 6
|
|
Year7
|
|
Year 8
|
|
Year9
|
|
Year 10
|
|
Year 11
|
|
|
Total/Averg
|
| |
|
|
|
|
|
|
|
|
|
|
|
|
|
|
|
|
|
|
|
|
|
|
|
|
|
|
|
|
|
|
|
|
|
|
METAL PRICES
|
|
|
|
|
|
|
|
|
|
|
|
|
|
|
|
|
|
|
|
|
|
|
|
|
|
|
|
|
|
|
|
|
|
|
Zinc Price
|
USD/lb
|
|
|
2.39
|
|
|
|
|
|
|
|
|
1.85
|
|
|
1.94
|
|
|
2.04
|
|
|
2.14
|
|
2.25
|
|
2.36
|
|
|
2.48
|
|
|
2,60
|
|
|
2.73
|
|
|
2.87
|
|
|
3.01
|
|
|
2.39
|
|
Copper Price
|
USD/lb
|
|
|
5.20
|
|
|
|
|
|
|
|
|
4.03
|
|
|
4.23
|
|
|
4.44
|
|
|
4.67
|
|
4.90
|
|
5.14
|
|
|
5.40
|
|
|
5,67
|
|
|
5.95
|
|
|
6.25
|
|
|
6.56
|
|
|
5.20
|
|
Silver
|
USDoz
|
|
|
19.37
|
|
|
|
|
|
|
|
|
15.00
|
|
|
15.75
|
|
|
16.54
|
|
|
17.36
|
|
18.23
|
|
19.14
|
|
|
20.10
|
|
|
21,11
|
|
|
22.16
|
|
|
23.27
|
|
|
24.43
|
|
|
19.37
|
|
Gold
|
USD/oz
|
|
|
991.89
|
|
|
|
|
|
|
|
|
768.00
|
|
|
806.40
|
|
|
846.72
|
|
|
889.06
|
|
933.51
|
|
930.13
|
|
|
1,029.19
|
|
|
1,080,65
|
|
|
1,134.69
|
|
|
1,191.42
|
|
|
1,250.99
|
|
|
991.89
|
| |
|
|
|
|
|
|
|
|
|
|
|
|
|
|
|
|
|
|
|
|
|
|
|
|
|
|
|
|
|
|
|
|
|
|
|
|
|
|
|
|
|
|
|
|
|
PRODUCTION/REVENUE
|
|
|
|
|
|
|
|
|
|
|
|
|
|
|
|
|
|
|
|
|
|
|
|
|
|
|
|
|
|
|
|
|
|
|
|
|
|
|
|
|
|
|
|
|
|
Ore Milled
|
t
|
|
|
8,984,000
|
|
|
|
|
|
|
|
|
500,000
|
|
|
700,000
|
|
|
700,000
|
|
|
700,000
|
|
840,000
|
|
840,000
|
|
|
340,000
|
|
|
840,000
|
|
|
1,008,000
|
|
|
1,008,000
|
|
|
1,008,000
|
|
|
8,984.000
|
| |
|
|
|
|
|
|
|
|
|
|
|
|
|
|
|
|
|
|
|
|
|
|
|
|
|
|
|
|
|
|
|
|
|
|
|
|
|
|
|
|
|
|
|
|
|
Zinc Concentrate
|
t
|
|
|
739.878
|
|
|
|
|
|
|
|
|
41,178
|
|
|
57,649
|
|
|
57,649
|
|
|
57,649
|
|
69,178
|
|
69,178
|
|
|
69,178
|
|
|
69,178
|
|
|
83,014
|
|
|
83,014
|
|
|
83,014
|
|
|
739,878
|
|
Copper Concentrate
|
t
|
|
|
447,525
|
|
|
|
|
|
|
|
|
24,907
|
|
|
34,870
|
|
|
34,870
|
|
|
34,870
|
|
41,843
|
|
41,843
|
|
|
41,843
|
|
|
41,843
|
|
|
50,212
|
|
|
50,212
|
|
|
50,212
|
|
|
447,525
|
|
Gold
|
oz
|
|
|
95,885
|
|
|
|
|
|
|
|
|
5,336
|
|
|
7.471
|
|
|
7,471
|
|
|
7,471
|
|
8.965
|
|
8,965
|
|
|
8,965
|
|
|
8,965
|
|
|
10.758
|
|
|
10,758
|
|
|
10,758
|
|
|
95,885
|
|
Silver
|
oz
|
|
|
4,683,752
|
|
|
|
|
|
|
|
|
260,672
|
|
|
364,941
|
|
|
364,941
|
|
|
364,941
|
|
437,929
|
|
437,929
|
|
|
437,929
|
|
|
437.929
|
|
|
525,515
|
|
|
525,515
|
|
|
525,515
|
|
|
4,633,752
|
| |
|
|
|
|
|
|
|
|
|
|
|
|
|
|
|
|
|
|
|
|
|
|
|
|
|
|
|
|
|
|
|
|
|
|
|
|
|
|
|
|
|
|
|
|
|
Total Revenue
|
USD
|
|
|
3,218,949
|
|
|
|
|
|
|
|
|
131,352
|
|
|
194,156
|
|
|
204,932
|
|
|
216,248
|
|
273,754
|
|
288,724
|
|
|
304,443
|
|
|
320,947
|
|
|
405,932
|
|
|
427,767
|
|
|
450,694
|
|
|
3.218,949
|
| |
|
|
|
|
|
|
|
|
|
|
|
|
|
|
|
|
|
|
|
|
|
|
|
|
|
|
|
|
|
|
|
|
|
|
|
|
|
|
|
|
|
|
|
0
|
|
Total Operating Costs
|
USD
|
|
|
467.605
|
|
|
|
|
|
|
|
|
28,960
|
|
|
40,544
|
|
|
40,544
|
|
|
40,544
|
|
43,789
|
|
43,789
|
|
|
43,789
|
|
|
43,789
|
|
|
47,285
|
|
|
47,285
|
|
|
47,285
|
|
|
467.605
|
|
Freight&lnsurance
|
USD
|
|
|
92,657
|
|
|
|
|
|
|
|
|
5,155
|
|
|
7,216
|
|
|
7,216
|
|
|
7,216
|
|
8.660
|
|
8,660
|
|
|
8,660
|
|
|
8,660
|
|
|
10,392
|
|
|
10,392
|
|
|
10,392
|
|
|
92,617
|
| |
|
|
|
|
|
|
|
|
|
|
|
|
|
|
|
|
|
|
|
|
|
|
|
|
|
|
|
|
|
|
|
|
|
|
|
|
|
|
|
|
|
|
|
0
|
|
Operating Cash Profit
|
USD
|
|
|
2,658,727
|
|
|
|
|
|
|
|
|
97,237
|
|
|
146,396
|
|
|
157,172
|
|
|
168,487
|
|
221,305
|
|
236,275
|
|
|
251,994
|
|
|
268,498
|
|
|
348,255
|
|
|
370,090
|
|
|
393,017
|
|
|
2,658,727
|
| |
|
|
|
|
|
|
|
|
|
|
|
|
|
|
|
|
|
|
|
|
|
|
|
|
|
|
|
|
|
|
|
|
|
|
|
|
|
|
|
|
|
|
|
|
|
Project Cash Flow
|
USD
|
|
|
|
|
|
|
|
|
|
|
|
|
|
|
|
|
|
|
|
|
|
|
|
|
|
|
|
|
|
|
|
|
|
|
|
|
|
|
|
|
|
|
0
|
|
Operating Cash Profit
|
USD
|
|
|
2,658.727
|
|
|
|
|
|
|
|
|
97,237
|
|
|
146,396
|
|
|
157,172
|
|
|
163,487
|
|
221,305
|
|
236,275
|
|
|
251,994
|
|
|
268.498
|
|
|
348,255
|
|
|
370,090
|
|
|
393,017
|
|
|
2,658,727
|
|
Less: Capital invest.
|
USD
|
|
|
173,178
|
|
|
59,366
|
|
|
|
78,812
|
|
|
D
|
|
|
0
|
|
|
0
|
|
|
20,000
|
|
0
|
|
0
|
|
|
0
|
|
|
15,000
|
|
|
0
|
|
|
0
|
|
|
0
|
|
|
173,173
|
|
Working Cap.
|
USD
|
|
|
0
|
|
|
|
|
|
|
|
|
|
30,425
|
|
|
14,736
|
|
|
2,694
|
|
|
2,829
|
|
-50,683
|
|
0
|
|
|
0
|
|
|
0
|
|
|
0
|
|
|
0
|
|
|
D
|
|
|
0
|
| |
USD
|
|
|
|
|
|
|
|
|
|
|
|
|
|
|
|
|
|
|
|
|
|
|
|
|
|
|
|
|
|
|
|
|
|
|
|
|
|
|
|
|
|
|
|
|
| |
|
|
|
|
|
|
|
|
|
|
|
|
|
|
|
|
|
|
|
|
|
|
|
|
|
|
|
|
|
|
|
|
|
|
|
|
|
|
|
|
|
|
|
|
0
|
|
Net Cash Flow
|
USD
|
|
|
2,485,549
|
|
- |
59.366
|
|
|
|
-78,812
|
|
|
66,813
|
|
|
131,660
|
|
|
154,478
|
|
|
145,658
|
|
271,988
|
|
236,275
|
|
|
251,994
|
|
|
253,498
|
|
|
348,255
|
|
|
370,090
|
|
|
393,017
|
|
|
2.485,549
|
|
Accum. NCF
|
USD
|
|
|
2,485.549
|
|
- |
59.366
|
|
|
- |
138,178
|
|
|
-71,365
|
|
|
60.295
|
|
|
214,773
|
|
|
360,431
|
|
632,419
|
|
868,694
|
|
|
1,120,688
|
|
|
1,374,186
|
|
|
1.722.441
|
|
|
2,092,531
|
|
|
2.485,549
|
|
|
|
| |
|
|
|
|
|
|
|
|
|
|
|
|
|
|
|
|
|
|
|
|
|
|
|
|
|
|
|
|
|
|
|
|
|
|
|
|
|
|
|
|
|
|
|
|
|
|
NPVofNCF@5%
|
USD
|
|
|
1,557,142
|
|
|
|
|
|
|
|
|
|
|
|
|
|
|
|
|
|
|
|
|
|
|
|
|
|
|
|
|
|
|
|
|
|
|
|
|
|
|
|
|
|
|
NPVof NCF @ 10%
|
USD
|
|
|
1,007,387
|
|
|
|
|
|
|
|
|
|
|
|
|
|
|
|
|
|
|
|
|
|
|
|
|
|
|
|
|
|
|
|
|
|
|
|
|
|
|
|
|
|
|
NPV ofNCF@15%
|
USD
|
|
|
869,453
|
|
|
|
|
|
|
|
|
|
|
|
|
|
|
|
|
|
|
|
|
|
|
|
|
|
|
|
|
|
|
|
|
|
|
|
|
|
|
|
|
|
| |
|
|
|
|
|
|
|
|
|
|
|
|
|
|
|
|
|
|
|
|
|
|
|
|
|
|
|
|
|
|
|
|
|
|
|
|
|
|
|
|
|
|
|
|
|
|
Project |RR
|
|
|
|
69,66
|
|
|
|
|
|
|
|
|
|
|
|
|
|
|
|
|
|
|
|
|
|
|
|
|
|
|
|
|
|
|
|
|
|
|
|
|
|
|
|
|
|
| |
|
|
|
|
|
|
|
|
|
|
|
|
|
|
|
|
|
|
|
|
|
|
|
|
|
|
|
|
|
|
|
|
|
|
|
|
|
|
|
|
|
|
|
|
|
| |
|
|
|
|
|
|
|
|
|
|
|
|
|
|
|
|
|
|
|
|
|
|
|
|
|
|
|
|
|
|
|
|
|
|
|
|
|
|
|
|
|
|
|
|
|
|
Scenario 4
|
|
|
|
|
|
|
|
|
|
|
|
|
|
|
|
|
AL MASANE PROJECT
|
|
|
|
|
|
|
|
|
|
|
|
|
Capital Cost
|
173 million USD
|
|
|
|
|
|
|
|
|
|
|
|
|
|
CASH FLOW PROJECTIONS
|
|
(000 USD)
|
|
|
|
|
|
|
|
|
Metal prices USD
|
Zn Average
|
|
|
|
1.88
|
|
|
|
|
|
|
|
|
|
|
PRE-FINANCING
|
|
|
|
|
|
|
|
|
|
|
|
| |
Cu Average
|
|
|
|
4.09
|
|
|
|
|
|
|
|
|
|
|
PRE-TAX
|
|
|
|
|
|
|
|
|
|
|
|
| |
Silver Average
|
|
|
|
19.37
|
|
|
|
|
|
|
|
|
|
|
|
|
|
|
|
|
|
|
|
|
|
|
|
|
|
|
| |
Gold Average
|
|
|
|
778.80
|
|
|
|
|
|
|
|
|
|
|
|
|
|
|
|
|
|
|
|
|
|
|
|
|
|
|
| |
|
|
|
|
|
|
|
|
|
|
|
|
|
|
|
|
|
|
|
|
|
|
|
|
|
|
|
|
|
|
|
|
|
| |
|
|
Total
|
|
|
Year-1
|
|
|
Year O
|
|
Year 1
|
|
Year 2
|
|
Year 3
|
|
Year 4
|
|
Year 5
|
|
Year 6
|
|
Year 7
|
|
Year8
|
|
Year 9
|
|
Year 10
|
Year 11
|
|
Total/Averg
|
| |
|
|
|
|
|
|
|
|
|
|
|
|
|
|
|
|
|
|
|
|
|
|
|
|
|
|
|
|
|
|
|
|
|
|
METAL PRICES
|
|
|
|
|
|
|
|
|
|
|
|
|
|
|
|
|
|
|
|
|
|
|
|
|
|
|
|
|
|
|
|
|
|
|
Zinc Price
|
USD/lb
|
|
|
1.38
|
|
|
|
|
|
|
|
|
|
1.70
|
|
|
1.73
|
|
|
1.77
|
|
|
1.80
|
|
|
1.84
|
|
|
1.88
|
|
|
1.91
|
|
1.95
|
|
|
1.99
|
|
2.03
|
2.07
|
|
1.88 |
|
Copper Price
|
USD/lb
|
|
|
4.09
|
|
|
|
|
|
|
|
|
|
3.70
|
|
|
3.77
|
|
|
3.35
|
|
|
3.93
|
|
|
4.00
|
|
|
4.09
|
|
|
4.17
|
|
4.25
|
|
|
4.34
|
|
4.42
|
4.51
|
|
4.09 |
|
Stiver
|
USDoz
|
|
|
15.23
|
|
|
|
|
|
|
|
|
|
13.77
|
|
|
14.05
|
|
|
14.33
|
|
|
14.61
|
|
|
14.91
|
|
|
15.20
|
|
|
15.51
|
|
|
15.82
|
|
|
16.13
|
|
|
16.46
|
|
16.79
|
|
15.23
|
|
Gold
|
USD/oz
|
|
|
778.80
|
|
|
|
|
|
|
|
|
|
704.00
|
|
|
718.08
|
|
|
732.44
|
|
|
747.09
|
|
|
762.03
|
|
|
777.27
|
|
|
792.32
|
|
|
808.67
|
|
|
824.85
|
|
|
341.35
|
|
858.17
|
|
778.80
|
| |
|
|
|
|
|
|
|
|
|
|
|
|
|
|
|
|
|
|
|
|
|
|
|
|
|
|
|
|
|
|
|
|
|
|
|
|
|
|
|
|
|
|
|
|
|
|
PRODUCTION/REVENUE
|
|
|
|
|
|
|
|
|
|
|
|
|
|
|
|
|
|
|
|
|
|
|
|
|
|
|
|
|
|
|
|
|
|
|
|
|
|
|
|
|
|
|
|
|
|
|
Ore Milled
|
t
|
|
|
8,984,000
|
|
|
|
|
|
|
|
|
|
500,000
|
|
|
700,000
|
|
|
700,000
|
|
|
700,000
|
|
|
840,000
|
|
|
840,000
|
|
|
840,000
|
|
|
840,000
|
|
|
1,008,000
|
|
|
1,008,000
|
|
1,008,000
|
|
8,984,000
|
| |
|
|
|
|
|
|
|
|
|
|
|
|
|
|
|
|
|
|
|
|
|
|
|
|
|
|
|
|
|
|
|
|
|
|
|
|
|
|
|
|
|
|
|
|
|
|
Zinc Concentrate
|
t
|
|
|
739,878
|
|
|
|
|
|
|
|
|
|
41,178
|
|
|
57,649
|
|
|
57,649
|
|
|
57,649
|
|
|
69,178
|
|
|
69,178
|
|
|
69,178
|
|
|
69,178
|
|
|
83,014
|
|
|
83,014
|
|
83,014
|
|
739,873
|
|
Copper Concentrate
|
t
|
|
|
447,525
|
|
|
|
|
|
|
|
|
|
24,907
|
|
|
34,870
|
|
|
34,870
|
|
|
34,870
|
|
|
41,843
|
|
|
41,843
|
|
|
41,843
|
|
|
41,843
|
|
|
50,212
|
|
|
50,212
|
|
50,212
|
|
447,525
|
|
Gold
|
oz
|
|
|
95,885
|
|
|
|
|
|
|
|
|
|
5,336
|
|
|
7,471
|
|
|
7,471
|
|
|
7,471
|
|
|
8,965
|
|
|
8,965
|
|
|
8,965
|
|
|
8,965
|
|
|
10,758
|
|
|
10,758
|
|
10,758
|
|
95,885
|
|
Silver
|
oz
|
|
|
4,683,752
|
|
|
|
|
|
|
|
|
|
260,672
|
|
|
364,941
|
|
|
364,941
|
|
|
364,941
|
|
|
437,929
|
|
|
437,929
|
|
|
437,929
|
|
|
437,929
|
|
|
525,515
|
|
|
525,515
|
|
525,515
|
|
4,683,752
|
| |
|
|
|
|
|
|
|
|
|
|
|
|
|
|
|
|
|
|
|
|
|
|
|
|
|
|
|
|
|
|
|
|
|
|
|
|
|
|
|
|
|
|
|
|
|
|
Total Revenue
|
USD
|
|
|
2,431,519
|
|
|
|
|
|
|
|
|
|
119,391
|
|
|
170,917
|
|
|
174,763
|
|
|
178,686
|
|
|
219,224
|
|
|
224,122
|
|
|
229,117
|
|
|
234,212
|
|
|
287,291
|
|
|
293,653
|
|
300,141
|
|
2,431,519
|
| |
|
|
|
|
|
|
|
|
|
|
|
|
|
|
|
|
|
|
|
|
|
|
|
|
|
|
|
|
|
|
|
|
|
|
|
|
|
|
|
|
|
|
|
|
0
|
|
Total Operating Costs
|
USD
|
|
|
467,605
|
|
|
|
|
|
|
|
|
|
23,960
|
|
|
40,544
|
|
|
40,544
|
|
|
40,544
|
|
|
43,789
|
|
|
43,789
|
|
|
43,789
|
|
|
43,789
|
|
|
47,285
|
|
|
47,285
|
|
47,285
|
|
467,605
|
|
Freights Insurance
|
USD
|
|
|
92,617
|
|
|
|
|
|
|
|
|
|
5,155
|
|
|
7,216
|
|
|
7,216
|
|
|
7,216
|
|
|
8,660
|
|
|
8,660
|
|
|
8,660
|
|
|
8,660
|
|
|
10,392
|
|
|
10,392
|
|
10,392
|
|
92,617 0
|
| |
|
|
|
|
|
|
|
|
|
|
|
|
|
|
|
|
|
|
|
|
|
|
|
|
|
|
|
|
|
|
|
|
|
|
|
|
|
|
|
|
|
|
|
|
|
|
Operating Cash Profit
|
USD
|
|
|
1,871,297
|
|
|
|
|
|
|
|
|
|
85,276
|
|
|
123,157
|
|
|
127,003
|
|
|
130,925
|
|
|
166,776
|
|
|
171,673
|
|
|
176,668
|
|
|
181,764
|
|
|
229,615
|
|
|
235,976
|
|
242,464
|
|
1,871,297
|
| |
|
|
|
|
|
|
|
|
|
|
|
|
|
|
|
|
|
|
|
|
|
|
|
|
|
|
|
|
|
|
|
|
|
|
|
|
|
|
|
|
|
|
|
|
0
|
|
Project Cash Flow
|
USD
|
|
|
|
|
|
|
|
|
|
|
|
|
|
|
|
|
|
|
|
|
|
|
|
|
|
|
|
|
|
|
|
|
|
|
|
|
|
|
|
|
|
|
|
0
|
|
Cash Operating Profit
|
USD
|
|
|
1,871,297
|
|
|
|
|
|
|
|
|
|
85,276
|
|
|
123,157
|
|
|
127,003
|
|
|
130,925
|
|
|
166,776
|
|
|
171,673
|
|
|
176,668
|
|
|
181,764
|
|
|
229,615
|
|
|
235,976
|
|
242,464
|
|
1,871,297
|
|
Less: Capital Invest.
|
USD
|
|
|
173,178
|
|
|
|
59,366
|
|
|
|
78,812
|
|
|
0
|
|
|
0
|
|
|
0
|
|
|
20,000
|
|
|
0
|
|
|
0
|
|
|
0
|
|
|
15,000
|
|
|
0
|
|
|
0
|
|
0
|
|
173,178
|
|
Working Cap.
|
USD
|
|
|
0
|
|
|
|
|
|
|
|
|
|
|
27,434
|
|
|
11,916
|
|
|
961
|
|
|
981
|
|
|
-41,293
|
|
|
0
|
|
|
0
|
|
|
0
|
|
|
0
|
|
|
0
|
|
0
|
|
0
|
| |
USD
|
|
|
|
|
|
|
|
|
|
|
|
|
|
|
|
|
|
|
|
|
|
|
|
|
|
|
|
|
|
|
|
|
|
|
|
|
|
|
|
|
|
|
|
|
0
|
| |
|
|
|
|
|
|
|
|
|
|
|
|
|
|
|
|
|
|
|
|
|
|
|
|
|
|
|
|
|
|
|
|
|
|
|
|
|
|
|
|
|
|
|
|
|
|
|
Net Cash Flow
|
USD
|
|
|
1,698,119
|
|
|
- |
59,366
|
|
|
|
-78,812
|
|
|
57,842
|
|
|
111,241
|
|
|
126,041
|
|
|
109,945
|
|
|
208,068
|
|
|
171,673
|
|
|
176,668
|
|
|
166,764
|
|
|
229,615
|
|
|
235,976
|
|
242,464
|
|
1,698,119
|
|
Accum. NCF
|
USD
|
|
|
1,698,119
|
|
|
- |
59,366
|
|
|
- |
138,178
|
|
|
-80,336
|
|
|
30,905
|
|
|
156,946
|
|
|
266,891
|
|
|
474,959
|
|
|
646,632
|
|
|
823,300
|
|
|
990,064
|
|
|
1,219,678
|
|
|
1,455,654
|
|
1,698,119
|
|
|
| |
|
|
|
|
|
|
|
|
|
|
|
|
|
|
|
|
|
|
|
|
|
|
|
|
|
|
|
|
|
|
|
|
|
|
|
|
|
|
|
|
|
|
|
|
|
|
|
NPV of NCF @ 5%
|
USD
|
|
|
1,068,821
|
|
|
|
|
|
|
|
|
|
|
|
|
|
|
|
|
|
|
|
|
|
|
|
|
|
|
|
|
|
|
|
|
|
|
|
|
|
|
|
|
|
|
|
NPV of NCF® 10%
|
USD
|
|
|
692,635
|
|
|
|
|
|
|
|
|
|
|
|
|
|
|
|
|
|
|
|
|
|
|
|
|
|
|
|
|
|
|
|
|
|
|
|
|
|
|
|
|
|
|
|
NPV of NCF @ 15%
|
USD
|
|
|
459,265
|
|
|
|
|
|
|
|
|
|
|
|
|
|
|
|
|
|
|
|
|
|
|
|
|
|
|
|
|
|
|
|
|
|
|
|
|
|
|
|
|
|
|
| |
|
|
|
|
|
|
|
|
|
|
|
|
|
|
|
|
|
|
|
|
|
|
|
|
|
|
|
|
|
|
|
|
|
|
|
|
|
|
|
|
|
|
|
|
|
|
|
Project IRR
|
|
|
|
60.18
|
%
|
|
|
|
|
|
|
|
|
|
|
|
|
|
|
|
|
|
|
|
|
|
|
|
|
|
|
|
|
|
|
|
|
|
|
|
|
|
|
|
|
|
| |
|
|
|
|
|
|
|
|
|
|
|
|
|
|
|
|
|
|
|
|
|
|
|
|
|
|
|
|
|
|
|
|
|
|
|
|
|
|
|
|
|
|
|
|
|
|
| |
|
|
|
|
|
|
|
|
|
|
|
|
|
|
|
|
|
|
|
|
|
|
|
|
|
|
|
|
|
|
|
|
|
|
|
|
|
|
|
|
|
|
|
|
|
|
ATTACHMENT E
(Response to SEC Question No. 9)
ATTACHMENT F
(Response to SEC Question No. 9)
Draft of proposed changes to Note 8 in amending 2009 Form 10-K
NOTE 8 - INVESTMENT IN AL MASANE AL KOBRA MINING COMPANY (“AMAK”)
As of December 31, 2008 and 2009, all of the Company’s mining interests in Saudi Arabia are held by AMAK, in which the Company has a non-controlling equity interest as described below.
Until December 2008 the Company had direct investments in mining projects in the Al Masane area of Saudi Arabia. These investments included (i) the Al Masane Project, and (ii) investments in the exploration of the Wadi Qatan and Jebel Harr areas which are near the Al Masane Project.
The Al Masane Project consisted of a mining lease area of approximately 44 square kilometers. This project included various quantities of proved zinc, copper, gold and silver reserves. Prior to the transfer to AMAK in December 2008, the Company, as the holder of the Al Masane mining lease, was solely responsible to the Saudi Arabian government for rental payments and other obligations provided for by the mining lease and for the repayment of the $11 million loan from the Saudi Arabia Ministry of Finance and Natural Economy which the Company had used to finance some of its development activities at Al Masane. The Company’s interpretation of the mining lease was that repayment of this loan would be made in accordance with a repayment schedule to be agreed upon with the Saudi Arabian government from the cash flows mining operations at Al Masane. The initial term of the lease was for a period of thirty (30) years from May 22, 1993, with the Company having the option to renew or extend the term of the lease for additional periods not to exceed twenty (20) years. Under the lease, the Company was obligated to pay advance surface rental in the amount of 10,000 Saudi Riyals (approximately $2,667) per square kilometer per year (approximately $117,300 annually) during the period of the lease. The Company paid $234,700 in March 2006, $117,300 in February 2007, and $117,300 in February 2008 which paid the lease amounts in full through the end of 2008. In addition, the Company would be required to pay income tax in accordance with the income tax laws of Saudi Arabia then in force and pay all infrastructure costs. Furthermore, the lease contains provisions requiring that preferences be given to Saudi Arabian suppliers and contractors, that the Company employ Saudi Arabian citizens and provide training to Saudi Arabian personnel. At the time the Company’s interest in the Al Masane Project was transferred to AMAK, the Company had accumulated capitalized costs of $37.9 million, consisting of mining equipment of $2.2 million, construction costs of $3.1 million, consulting and project costs of $23.4 million, materials costs of $6.2 million and feasibility study costs of $3.0 million.
The Company obtained its initial license to explore and develop the Wadi Qatan area in 1971. In 1977 the Company was awarded an additional license for an area north of Wadi Qatan at Jebel Harr. Through December 2008 the Company had expended approximately $2.4 million for geophysical, geochemical and geologic work and diamond core drilling that revealed mineralization similar to that discovered at Al Masane. The Wadi Qatan and Jebel Harr licenses expired in the late seventies or early eighties. However, the rights to the results of the exploration performed by the Company were transferred to AMAK which has applied for the renewal of these licenses and which would be entitled to sell the exploration information to any other entity which obtains a license for these areas should AMAK’s application not be granted. AMAK has received positive feedback from the Ministry as of March 8, 2010, concerning these licenses but expects that it will take several months for the documentation to work its way through the governmental process.
AMAK was formed in late 2007 by the Company and eight Saudi investors, and was granted a commercial license from the Ministry of Commerce in January 2008. The Company formed AMAK with the Saudi investors because the Company recognized that the only way to obtain exploration permits from the Saudi government for the Al Masane, Wadi Qatan and Jebel Harr properties would be to form a joint venture with a Saudi company.
In December 2008 the Company contributed to AMAK (i) its interests in its Saudi mining properties and (ii) $3,750,000 of costs the Company incurred in connection with the formation of AMAK and the obtaining of necessary licenses for AMAK. AMAK treated such costs as a contribution from the Company and as organizational costs which it charged to expense. AMAK assumed from the Company the liability for the repayment of the $11 million loan from the Saudi Arabia Ministry of Finance and Natural Economy, and the Saudi Arabia Ministry of Finance and Natural Economy released the Company from liability for the loan. The Company received a 50% interest in AMAK. The eight Saudi investors contributed $60 million in cash to AMAK for a 50% interest. Under the by-laws of AMAK, the Company was entitled to appoint four of eight members of AMAK’s board of directors and the Saudi investors were entitled to appoint the remaining four members of AMAK’s board of directors. However, the by-laws provided that the chairman of AMAK’s board who is appointed by the Saudi investors, casts an extra vote in the event of a tie vote among the eight board members.
The Company accounted for its contribution of these assets to AMAK, net of the $11 million liability, as the contribution of non-monetary assets to a joint venture and recorded the transfer based on the lower of the cost or market value of the transferred assets. The Company determined that cost was less than market value, with market value being based on the contribution of cash of $60 million by the other investors in AMAK in exchange for their 50% interest. In addition, the Company confirmed that market value was greater than cost based on the cash flow projections based on the proven reserves and market mineral prices. The Company’s initial investment in AMAK was comprised of the following:
| |
|
|
|
|
Accumulated costs of mineral Interests in Saudi Arabia
|
|
$
|
40,289,907
|
|
|
Contribution of AMAK organization costs
|
|
|
3,712,500
|
|
|
Loan payable assumed by AMAK
|
|
|
(11,000,000
|
)
|
|
Net investment in AMAK
|
|
$
|
33,002,407
|
|
Initially, the Company accounted for its investment using the equity method of accounting under the presumption that since it owned more than 20% of AMAK, the Company would have the ability to exercise significant influence over the operating and financial policies of AMAK.
For the year ended December, 31, 2008, AMAK’s activities were limited to the receipt of the contributed assets, and its net loss was comprised solely of the expensing of the organizational costs incurred on its behalf by the Company. The Company’s equity in the 2008 loss of AMAK and its investment in AMAK at December 31, 2008 were as follows:
|
Initial investment in AMAK
|
|
$
|
33,002,407
|
|
|
Share of net loss of AMAK
|
|
|
(1,856,250
|
)
|
|
Investment in AMAK at December 31, 2008
|
|
$
|
31,146,157
|
|
AMAK’s by-laws require that audited financial statements for each year ended December 31 be submitted to its stockholders by June 30 of the following year. As a result, the The Company had expected to obtain the audited 2008 financial statements of AMAK by June 30, 2009, and in addition the Company expected to be able to secure the cooperation of AMAK and its auditors in converting those financial statements from generally accepted accounting principles in Saudi Arabia (“Saudi GAAP”) to U.S. generally accepted accounting principles (“U.S. GAAP”). However, by August of 2009 no financial statements of AMAK for 2008 had been produced.but despite its requests the Company was not furnished with that financial information, or any financial information for 2009.
In addition, during an April 2009 meeting of the Board of Directors of AMAK, a Saudi director, who is also an AMAK shareholder, questioned the validity of the agreements between the Company and several of the Saudi investors which had been relied upon by the Company as the operating document for AMAK since it was signed. The issues raised included: discrepancies between the terms of the original
memorandum of understanding and the executed AMAK partnership agreement; an allegation that various signatures for one or more of the Saudi investors on the AMAK partnership agreement were not authorized; that the Saudi attorney that prepared the AMAK partnership agreement exceeded his authority; and whether the Company’s capital contribution for its 50% interest in AMAK was fully paid or whether the Company was subject to a call for a $30 million cash contribution to AMAK’s capital. The Company had relied upon the AMAK partnership agreement since December 2008.
To settle these disputes, in August 2009 AMAK’s shareholders (the Company and the Saudi investors) agreed to amend the articles of association and by-laws for AMAK that provided that (i) the Company would convey nine percent or 4,050,000 shares of AMAK stock to the other AMAK shareholders pro rata, such that the Company’s interest in AMAK was now 41%, (ii) the Company has fully and completely paid the subscription price for 18,450,000 shares of AMAK stock (or 41% of the issued and outstanding shares), (iii) neither AMAK nor the other AMAK shareholders may require the Company to make an additional capital contribution without the Company’s written consent, (iv) the Company’s right to retain shall retain seats on the AMAK Board equal in number to that of the Saudi Arabian shareholders would be limited to the three year period for a three year period beginning August 25, 2009; (v) AMAK has assumed the $11 million promissory note to the Saudi Arabian Ministry of Finance and National Economy, and AMAK will indemnify and defend the Company against any and all claims related to that note, and (vi) for a three year period commencing August 25, 2009, the Company has the option to repurchase from the Saudi Arabian shareholders 4,050,000 shares of AMAK stock at a price equal to the then fair market value of said shares less ten percent. However, although the Company retains four of the eight seats on AMAK’s board of directors, under the August 2009 amendments, the chairman of AMAK’s board who is appointed by the Saudi investors, casts an extra vote in the event of a tie vote among the eight board members.
The amendments to AMAK’s articles of association and by-laws will not become officially adopted until they are approved by the Ministry of Commerce of Saudi Arabia. That approval process requires that (i) the amendments be approved by AMAK’s stockholders at a stockholders’ meeting attended by representatives of the Ministry of Commerce, (ii) AMAK publishes a notice of the amendments which allows stockholders to file formal objections to the proposed amendments, and (iii) the Ministry of Commerce then reviews and approves the amendments, including the consideration of any objections raised by AMAK stockholders. AMAK has scheduled a stockholders’ meeting for June 2010 at which the approval of the amendments will be voted upon. Although these official requirements for the adoption of the amendments have not yet been completed, the Company believes that the amendments will be approved, and the Company and the Saudi investors have since August 2009 been conducting the affairs of AMAK pursuant to the proposed amendments.
In May 2010 the Company received a draft of the 2009 financial statements of AMAK prepared under Saudi GAAP. At that time, the Company introduced a resolution at a meeting of the AMAK board of directors that would have required AMAK to produce the annual and quarterly financial statements prepared in accordance with U.S. GAAP which the Company required to apply the equity method of accounting for its investment. The resolution was defeated as the result of the casting of the tie breaking vote described above.
As the result of the events described in the immediately preceding two paragraphs, these events, the Company concluded that since in August 2009 it no longer had significant influence over the operating and financial policies of AMAK, and the Company changed to the cost method of accounting for its investment in AMAK. The Company recorded its cost method investment in AMAK at the carrying amount of its equity method investment at the date the method of accounting was changed.
While the Company has been unable to obtain 2008 or 2009 U.S. GAAP financial information for AMAK, based on the Saudi GAAP information it has received it believes that its share of any net income or loss for AMAK for the period from January 1, 2009 to August 2009 would not be material as AMAK’s activities during that period were the construction of facilities to begin the commercial development of the interests. Additionally, because the Company was unable to obtain U.S. GAAP financial information for 2008 or 2009, the Company did not, while it was using the equity method of accounting, record any adjustments for the difference between its investment in AMAK and its share of the book value of
AMAK’s net assets. For 2008, on the basis of the information the Company obtained, AMAK’s activities were limited to the receipt of the contributed assets, and its net loss was comprised solely of the expensing of the $3,712,500 of organizational costs incurred on its behalf by the Company The Company’s equity in the 2008 loss of AMAK and its investment in AMAK at December 31, 2008 were as follows:
|
Initial investment in AMAK
|
|
$
|
33,002,407
|
|
|
Share of net loss of AMAK
|
|
|
(1,856,250)
|
)
|
|
Investment in AMAK at December 31, 2008
|
|
$
|
31,146,157
|
|