UNITED STATES SECURITIES AND EXCHANGE COMMISSION
Washington, D.C. 20549
___________________

FORM 10-K
 
 (MARK ONE)
 
ý
ANNUAL REPORT PURSUANT TO SECTION 13 OR 15(d) OF THE SECURITIES EXCHANGE ACT OF 1934
For The Fiscal Year Ended December 31, 2015
OR
¨
TRANSITION REPORT PURSUANT TO SECTION 13 OR 15(d) OF THE SECURITIES EXCHANGE ACT OF 1934
For The Transition Period from ___________ to ________
 
Commission File Number 1-33926
 
 
TRECORA RESOURCES
 
 (Exact name of registrant as specified in its charter)
 
Delaware
(State or other jurisdiction of incorporation or organization)
 
75-1256622
(I.R.S. Employer
Identification No.)
 
1650 Hwy 6 S, Suite 190
Sugar Land, TX
(Address of principal executive offices)
77478
(Zip code)

Registrant’s telephone number, including area code: (409) 385-8300
 
Securities registered pursuant to Section 12(b) of the Act:
None
 
Securities registered pursuant to Section 12(g) of the Act:
 
Title of Class                                                      Name of exchange on which registered
Common stock, par value $0.10 per share                                                                                     New York Stock Exchange

Indicate by check mark if the registrant is a well-known seasoned issuer, as defined in Rule 405 of the Securities Act. Yes¨  Noý


Indicate by check mark if the registrant is not required to file reports pursuant to Section 13 or Section 15(d) of the Act. Yes¨  No ý
 
_____________________

 
Indicate by check mark whether the registrant (l) has filed all reports required to be filed by Section 13 or 15(d) of the Securities Exchange Act of 1934 during the preceding 12 months (or for such shorter period that the registrant was required to file such reports), and (2) has been subject to such filing requirements for the past 90 days. Yesý  No ¨
 
Indicate by check mark whether the registrant has submitted electronically and posted on its corporate Website, if any, every Interactive Data File required to be submitted and posted pursuant to Rule 405 of Regulation S-T (§232.405 of this chapter) during the preceding 12 months (or for such shorter period that the registrant was required to submit and post such files). Yesý  No ¨
 
Indicate by check mark if disclosure of delinquent filers pursuant to Item 405 of Regulation S-K (§229.405 of this chapter) is not contained herein, and will not be contained, to the best of registrant’s knowledge, in definitive proxy or information statements incorporated by reference in Part III of this Form 10-K or any amendment to this Form 10-K.  ý
 
Indicate by check mark whether the registrant is a large accelerated filer, an accelerated filer, a non-accelerated filer, or a smaller reporting company.
 
Large accelerated filer ¨                                                      Accelerated filer ý
 
Non-accelerated filer ¨                                                      Smaller reporting company¨
 
        Indicate by check mark whether the registrant is a shell company (as defined in Rule 12b-2 of the Act.) Yes¨  No ý
 
The aggregate market value on June 30, 2015, of the registrant’s voting securities held by non-affiliates was approximately $235 million.
 
Number of shares of registrant’s Common Stock, par value $0.10 per share, outstanding as of March 7, 2016 (excluding 300,000 shares of treasury stock):  24,202,346.
 

DOCUMENTS INCORPORATED BY REFERENCE

Part III incorporates information by reference from the definitive proxy statement for the registrant’s Annual Meeting of Stockholders to be held on or about May 17, 2016.


TABLE OF CONTENTS

Item Number and Description


1
 
1
 
1
 
3
 
3
 
3
 
6
 
6
 
6
 
9
     
9
     
14
     
14
     
17
     
17
     
  PART II
18
     
19


19
 
20
 
20
 
21
 
24
 
31
 
Critical Accounting Policies
32
     
34
     
34
     
34
     
35
     
38
     
  PART III
38
     
38
     
38


38
     
38
     
  PART IV
38


PART I

Item 1.   Business.

General

Trecora Resources (the “Company”) was incorporated in the State of Delaware in 1967. The Company’s principal business activities are the manufacturing of various specialty petrochemical products and synthetic waxes and the provision of custom processing services.  Unless the context requires otherwise, references to “we,” “us,” “our,” and the “Company” are intended to mean consolidated Trecora Resources and its subsidiaries.

This document includes the following abbreviations:
(1) TREC – Trecora Resources
(2) TOCCO – Texas Oil & Chemical Co. II, Inc. – Wholly owned subsidiary of TREC and parent of SHR and TC
(3) SHR – South Hampton Resources, Inc. – Petrochemical segment
(4) GSPL – Gulf State Pipe Line Co, Inc. – Pipeline support for the petrochemical segment – wholly owned subsidiary of SHR
(5) TC – Trecora Chemical, Inc. – Specialty wax segment
(6) AMAK – Al Masane Al Kobra Mining Company – Mining equity investment – 35% ownership
(7) PEVM – Pioche Ely Valley Mines, Inc. – Inactive mine - 55% ownership
(8) Acquisition – October 1, 2014, purchase of TC

On October 1, 2014, TOCCO, a Texas corporation, acquired 100% of the Class A common stock of SSI Chusei, Inc. (“SSI”), a Texas corporation and leading manufacturer of specialty synthetic waxes and custom toll processing services in Pasadena, Texas.  On November 15, 2014, SSI’s name was changed to TC.

The Company also owns a 35% interest in AMAK, a Saudi Arabian closed joint stock mining company, which is in commercial production of copper and zinc concentrates and silver and gold doré.  Finally, we have a 55% interest in PEVM, a Nevada mining corporation, which presently does not conduct any substantial business activity but owns undeveloped properties in the United States.

Business Segments

In October 2014 with the completion of the Acquisition, we began operating in two business segments; the manufacturing of various specialty petrochemical products and the manufacturing of specialty synthetic waxes.

Our specialty petrochemical products segment is conducted through SHR, a Texas corporation.  SHR owns and operates a specialty petrochemical facility near Silsbee, Texas which produces high purity hydrocarbons and other petroleum based products including isopentane, normal pentane, isohexane and hexane which may be used in the production of polyethylene, packaging, polypropylene, expandable polystyrene, poly-iso/urethane foams, crude oil from the Canadian tar sands, and in the catalyst support industry.   Our petrochemical products are typically transported to customers by rail car, tank truck, iso-container, and on occasion by ship.  SHR owns all of the capital stock of GSPL, a Texas corporation, which owns and operates pipelines that connect the SHR facility to a natural gas line, to SHR’s truck and rail loading terminal and to a major petroleum products pipeline owned by an unaffiliated third party.

Our specialty synthetic wax segment is conducted through TC, a Texas corporation, located in Pasadena, Texas which produces specialty polyethylene and poly alpha olefin waxes and provides custom processing services.  The specialty polyethylene waxes are used in markets from paints and inks to adhesives, coatings, and PVC lubricants.  The highly specialized synthetic poly alpha olefin waxes are used in applications such as toner in printers and as additives for candles providing rigidity and retention of fragrances.  These waxes are sold in solid form as pastilles or, for large adhesive companies, in bulk liquid form.

United States Specialty Petrochemical Operations

SHR’s specialty petrochemical facility is approximately 30 miles north of Beaumont and 90 miles east of Houston. The facility consists of eight operating units which, while interconnected, make distinct products through differing processes: (i) a Penhex Unit; (ii) a Reformer Unit; (iii) a Cyclo-pentane Unit; (iv) an Aromax® Unit; (v) an Aromatics
 
 
1


Hydrogenation Unit; (vi) a White Oil Fractionation Unit; (vii) a Hydrocarbon Processing Demonstration Unit and (viii) a P-Xylene Unit. All of these units are currently in operation.

The Penhex Unit, including the new D-train unit, currently has the capacity to process approximately 11,000 barrels per day of fresh feed with the Reforming Unit, the Aromax® Unit, and the Cyclo-Pentane Unit further processing streams produced by the Penhex Unit.  The Aromatics Hydrogenation Unit has a capacity of approximately 400 barrels per day, and the White Oils Fractionation Unit has a capacity of approximately 3,000 barrels per day.  The Hydrocarbon Processing Demonstration Unit has a capacity of approximately 300 gallons per day.  The P-Xylene Unit has a capacity of approximately 20,000 pounds per year.  The facility generally consists of equipment commonly found in most petrochemical facilities such as fractionation towers and hydrogen treaters except the facility is adapted to produce specialized products that are high purity and very consistent with precise specifications that are utilized in the petrochemical industry as solvents, additives, blowing agents and cooling agents.  We produce eight distinct product streams and market several combinations of blends as needed in various customer applications.  We do not produce motor fuel products or any other commodity type products commonly sold directly to retail consumers or outlets.
 
During 2015 we constructed a new unit which is part of the Penhex Unit, D-train, which began production in the fourth quarter providing additional capacity of approximately 4,000 barrels per day.  Going forward capacity utilization will be based upon 11,000 barrels per day.  Products from the Penhex Unit, Reformer Unit, Aromax® Unit, and Cyclo-pentane Unit are marketed directly to the customer by our marketing personnel.  The Penhex Unit had a utilization rate during 2015 of approximately 84% based upon 7,000 barrels per day.  The utilization rate for 2014 and 2013 was approximately 84% and 70%, respectively, based upon 6,700 barrels per day.   Penhex Unit capacity is now configured in three independent process units.  The three unit configuration improves reliability by reducing the amount of total down time due to mechanical and other factors.

The Reformer and Aromax® Units are operated as needed to support the Penhex and Cyclo-pentane Units.  Consequently, utilization rates of these units are driven by production from the Penhex Unit.  Operating utilization rates are affected by product demand, raw material composition, mechanical integrity, and unforeseen natural occurrences, such as weather events.  The nature of the petrochemical process demands periodic shut-downs for de-coking and other mechanical repairs.

The Aromatics Hydrogenation Unit, White Oils Fractionation Unit, Hydrocarbon Processing Demonstration Unit and P-Xylene Unit are operated as independent and completely segregated processes.  These units are dedicated to the needs of three different toll processing customers.  The customers supply and maintain title to the feedstock, we process the feedstock into products based upon customer specifications, and the customers market the products.  Products may be sold directly from our storage tanks or transported to the customers’ location for storage and marketing.  The units have a combined capacity of approximately 3,400 barrels per day. Together they realized a utilization rate of 27% for 2015, 36% for 2014, and 42% for 2013.  The units are operated in accordance with customer needs, and the contracts call for take or pay minimums of production.

In support of the petrochemical operation, we own approximately 100 storage tanks with total capacity approaching 233,000 barrels, and 127 acres of land at the plant site, 92 acres of which are developed.  We also own a truck and railroad loading terminal consisting of storage tanks, four rail spurs, and truck and tank car loading facilities on approximately 55 acres of which 25 acres are developed.

We obtain our feedstock requirements from a sole supplier.  The agreement is primarily a logistics convenience.  The supplier buys or contracts for material only with SHR’s approval and utilizes their tank and pipeline connections to transport into our pipeline.  The supplier’s revenue above feed cost is primarily related to the cost and operation of the tank, pipelines, and equipment.  A contract was signed in August 2015 with a seven year term with subsequent one year renewals unless cancelled by either party with 180 days’ notice.  In 2015 a pipeline connection to the supplier’s dock was added to give alternative means of receiving feedstock.  Prior to this addition, all feedstock came from Mont Belvieu, Texas.

As a result of various expansion programs and the toll processing contracts, essentially all of the standing equipment at SHR is operational. We have various surplus equipment stored on-site which may be used in the future to assemble additional processing units as needs arise.

GSPL owns and operates three (3) 8-inch diameter pipelines and five (5) 4-inch diameter pipelines aggregating approximately 70 miles in length connecting SHR’s facility to: (1) a natural gas line, (2) SHR’s truck and rail loading


2

 
terminal and (3) a major petroleum products pipeline system owned by an unaffiliated third party.  All pipelines are operated within Texas Railroad Commission and DOT regulations for maintenance and integrity.
 
We sell our products to predominantly Fortune 500 companies.  Products are marketed via personal contact and through continued long term relationships.  Sales personnel visit customer facilities regularly and also attend various petrochemical conferences throughout the world.  We also have an internet presence.  We have adopted a strategy of moving our larger volume customers to formula based pricing to reduce the effect of feedstock cost volatility.  Under formula pricing the price charged to the customer is based on a formula which includes as a component the average cost of feedstock over the prior month.  With this pricing mechanism, product prices move in conjunction with feedstock prices without the necessity of announced price changes.  However, because the formulas use an average feedstock price from the prior month, the movement of prices will trail the movement of costs, and formula prices may or may not reflect our actual feedstock cost for the month during which the product is actually sold.  In addition, while formula pricing can reduce product margins during periods of increasing feedstock costs, during periods of decreasing feedstock costs formula pricing will follow feed costs down but will retain higher margins during the period by trailing the movement of costs by approximately 30 days. We believe that the use of formula pricing helps reduce volatility and increase predictability of product margins.  However, we continue to investigate alternative product pricing methods.  During 2015 and 2014, sales to one customer and two customers, respectively exceeded 10% of our consolidated revenues.  Specifically, in 2015 sales to ExxonMobil and their affiliates represented 20.1% of revenues.  In 2014 sales to ExxonMobil and their affiliates represented 23.2% of revenues and sales to Tricon Energy represented 10.5%.  In both cases these sales represented multiple products sold to multiple facilities.  We believe that we should be able to place volumes lost to one particular customer with another customer without significantly impacting our operation.

United States Specialty Synthetic Wax Operations

TC is a leading manufacturer of specialty synthetic waxes and also provides custom processing services from its 21 acre plant located in the heart of the petrochemical industry in Pasadena, Texas.  TC provides custom manufacturing, distillation, blending, forming and packaging of finished and intermediate products and wax products for coatings, hot melt adhesives and lubricants.  Situated near the Houston Ship Channel, the facility allows for easy access to international shipping and direct loading to rail or truck.  The location is within reach of major chemical pipelines and the on-site access to a steam pipeline and dedicated hydrogen line create a platform for expansion of both wax production capacity and custom processing capabilities.  We manufacture a variety of hard, high melting point, low to medium viscosity polyethylene wax products along with a wide range of other waxes and lubricants.  These products are used in a variety of applications including performance additives for hot melt adhesives; penetration and melting point modifiers for paraffin and microcrystalline waxes; lubrication and processing aides for plastics, PVC and rubber; and dry stir-in additives for inks.  In oxidized forms, applications also include use in textile emulsions and lubricants in PVC extrusion.

TC also provides turnkey custom manufacturing services including quality assurance, transportation and process optimization.  The plant has high vacuum distillation capability for the separation of temperature sensitive materials.  We have a fully equipped laboratory and pilot plant facility and a highly trained, technically proficient team of engineers and chemists suited to handle the rapid deployment of new custom processes and the development of new wax products.

United States Mineral Interests

Our only mineral interest in the United States is our 55% ownership interest in an inactive corporation, PEVM.  PEVM’s properties include 48 patented and 5 unpatented claims totaling approximately 1,500 acres.  All of the claims are located in Lincoln County, NV.

At this time, neither we nor PEVM have plans to develop the mining assets near Pioche, NV.  Periodically proposals are received from outside parties who are interested in developing or using certain assets. We do not anticipate making any significant domestic mining capital expenditures.

Environmental

General. Our operations are subject to stringent and complex federal, state, local and foreign laws and regulations relating to release of hazardous substances or wastes into the environment or otherwise relating to protection of the environment. As with the industry generally, compliance with existing and anticipated environmental laws and


3


regulations increases our overall costs of doing business, including costs of planning, constructing, and operating plants, pipelines, and other facilities. Included in our construction and operation costs are capital cost items necessary to maintain or upgrade equipment and facilities. Similar costs are likely upon changes in laws or regulations and upon any future acquisition of operating assets.

Any failure to comply with applicable environmental laws and regulations, including those relating to equipment failures and obtaining required governmental approvals, may result in the assessment of administrative, civil or criminal penalties, imposition of investigatory or remedial activities and, in less common circumstances, issuance of
injunctions or construction bans or delays. We believe that we currently hold all material governmental approvals required to operate our major facilities. As part of the regular overall evaluation of our operations, we have implemented procedures to review and update governmental approvals as necessary. We believe that our operations and facilities are in substantial compliance with applicable environmental laws and regulations and that the cost of compliance with such laws and regulations currently in effect will not have a material adverse effect on our operating results or financial condition.

The clear trend in environmental regulation is to place more restrictions and limitations on activities that may affect the environment, and thus there can be no assurance as to the amount or timing of future expenditures for environmental compliance or remediation, and actual future expenditures may be different from the amounts we currently anticipate. Moreover, risks of process upsets, accidental releases, or spills are associated with our possible future operations, and we cannot assure you that we will not incur significant costs and liabilities, including those relating to claims for damage to property and persons as a result of any such upsets, releases, or spills. In the event of future increases in environmental costs, we may be unable to pass on those cost increases to customers. A discharge of hazardous substances or wastes into the environment could, to the extent losses related to the event are not insured, subject us to substantial expense, including both the cost to comply with applicable laws and regulations and to pay fines or penalties that may be assessed and the cost related to claims made by neighboring landowners and other third parties for personal injury or damage to natural resources or property. We will attempt to anticipate future regulatory requirements that might be imposed and plan accordingly to comply with changing environmental laws and regulations and to minimize costs with respect to more stringent future laws and regulations of more rigorous enforcement of existing laws and regulations.

Hazardous Substance and Waste. To a large extent, the environmental laws and regulations affecting our operations relate to the release of hazardous substances or solid wastes into soils, groundwater and surface water, and include measures to prevent and control pollution. These laws and regulations generally regulate the generation, storage, treatment, transportation and disposal of solid and hazardous wastes, and may require investigatory and corrective actions at facilities where such waste may have been released or disposed. For instance, the Comprehensive Environmental Response, Compensation and Liability Act, or CERCLA, also known as the “Superfund” law, and comparable state laws, impose liability without regard to fault or the legality of the original conduct, on certain classes of persons that contributed to a release of “hazardous substance” into the environment. Potentially liable persons include the owner or operator of the site where a release occurred and companies that disposed or arranged for the disposal of the hazardous substances found at the site. Under CERCLA, these persons may be subject to joint and several liability for the costs of cleaning up the hazardous substances that have been released into the environment, for damages to natural resources, and for the costs of certain health studies. CERCLA also authorizes the EPA and, in some cases, third parties to take actions in response to threats to the public health or the environment and to seek to recover from the potentially responsible classes of persons the costs they incur. We have not received any notification that we may be potentially responsible for cleanup costs under CERCLA or any analogous federal or state laws, except as expressly provided herein.

We also generate, and may in the future generate, both hazardous and nonhazardous solid wastes that are subject to requirements of the federal Resource Conservation and Recovery Act, or RCRA, and/or comparable state statutes. From time to time, the Environmental Protection Agency, or EPA, and state regulatory agencies have considered the adoption of stricter disposal standards for nonhazardous wastes, including crude oil and natural gas wastes. Moreover, it is possible that some wastes generated by us that are currently classified as nonhazardous may in the future be designated as “hazardous wastes,” resulting in the wastes being subject to more rigorous and costly management and disposal requirements.

Air Emissions. Our current and future operations are subject to the federal Clean Air Act and comparable state laws and regulations. These laws and regulations regulate emissions of air pollutants from various industrial sources, including our facilities, and impose various monitoring and reporting requirements. Pursuant to these laws and


4

 
regulations, we may be required to obtain environmental agency pre-approval for the construction or modification of certain projects or facilities expected to produce air emissions or result in an increase in existing air emissions, obtain and comply with the terms of air permits, which include various emission and operational limitations, or use specific emission control technologies to limit emissions. We will likely be required to incur certain capital expenditures in the future for air pollution control equipment in connection with maintaining or obtaining governmental approvals addressing air-emission related issues. Failure to comply with applicable air statutes or regulations may lead to the assessment of administrative, civil or criminal penalties, and may result in the limitation or cessation of construction or operation of certain air emission sources.

Climate Change. In response to concerns suggesting that emissions of certain gases, commonly referred to as “greenhouse gases” (including carbon dioxide and methane), may be contributing to warming of the Earth’s atmosphere, the U.S. Congress is actively considering legislation to reduce such emissions. In addition, at least one-third of the states, either individually or through multi-state regional initiatives, have already taken legal measures intended to reduce greenhouse gas emissions, primarily through the planned development of greenhouse gas emission inventories and/or greenhouse gas cap and trade programs. In addition, EPA is taking steps that would result in the regulation of greenhouse gases as pollutants under the federal Clean Air Act. Furthermore, in September 2009 the EPA finalized regulations that require monitoring and reporting of greenhouse gas emissions on an annual basis including extensive greenhouse gas monitoring and reporting requirements beginning in 2010. Although the greenhouse gas reporting rule does not control greenhouse gas emission levels from any facilities, it will still cause us to incur monitoring and reporting costs for emissions that are subject to the rule. Some of our facilities include source categories that are subject to the greenhouse gas reporting requirements included in the final rule. In December 2009 the EPA also issued findings that greenhouse gases in the atmosphere endanger public health and welfare and emissions from mobile sources cause or contribute to greenhouse gases in the atmosphere. The endangerment findings will not immediately affect our operations, but standards eventually promulgated pursuant to these findings could affect our operations and ability to obtain air permits for new or modified facilities. Legislation and regulations relating to control or reporting of greenhouse gas emissions are also in various stages of discussions or implementation in about one-third of the states. Lawsuits have been filed seeking to force the federal government to regulate greenhouse gases emissions under the Clean Air Act and to require individual companies to reduce greenhouse gas emissions from their operations. These and other lawsuits may result in decisions by state and federal courts and agencies that could impact our operations and ability to obtain certifications and permits to construct future projects.

Passage of climate change legislation or other federal or state legislative or regulatory initiatives that regulate or restrict emissions of greenhouse gases in areas in which we conduct business could adversely affect the demand for the products we store, transport, and process, and depending on the particular program adopted, could increase the costs of our operations including costs to operate and maintain our facilities, install new emission controls on our facilities, acquire allowances to authorize our greenhouse gas emissions, pay any taxes related to our greenhouse gas emissions and/or administer and manage a greenhouse gas emissions program. We may be unable to recover any such lost revenues or increase costs in the rates we charge customers, and any such recovery may depend on events beyond our control. Reductions in our revenues or increases in our expenses as a result of climate control initiatives could have adverse effects on our business, financial position, results of operations and prospects.

Clean Water Act. The Federal Water Pollution Control Act, also known as the Clean Water Act, and comparable state laws impose restrictions and strict controls regarding the discharge of pollutants, including natural gas liquid related wastes, into state waters or waters of the United States. Regulations promulgated pursuant to these laws require that entities that discharge into Federal and state waters obtain National Pollutant Discharge Elimination System, or NPDES, and/or state permits authorizing these discharges. The Clean Water Act and analogous state laws assess administrative, civil and criminal penalties for discharges of unauthorized pollutants into the water and impose substantial liability for the costs of removing spills from such waters. In addition, the Clean Water Act and analogous state laws require that individual permits or coverage under general permits be obtained by covered facilities for discharges of storm water runoff.

TCEQ. In 1993 during remediation of a small spill area, the Texas Commission on Environmental Quality (TCEQ) required SHR to drill a well to check for groundwater contamination under the spill area. Two pools of hydrocarbons were discovered to be floating on the groundwater at a depth of approximately 25 feet. One pool is under the site of a former gas processing plant owned and operated by Sinclair, Arco and others before its purchase by SHR in 1981. Analysis of the material indicates it entered the ground prior to SHR’s acquisition of the property.  The other pool is under the original SHR facility and analysis indicates the material was deposited decades ago. Tests conducted have


5

 
determined that the hydrocarbons are contained on the property and not migrating in any direction. The recovery process was initiated in June 1998 and approximately $53,000 was spent setting up the system. The recovery is proceeding as planned and is expected to continue for many years until the pools are reduced to acceptable levels. Expenses of recovery and periodic migration testing are being recorded as normal operating expenses. Expenses for future recovery are expected to stabilize and be less per annum than the initial set up cost, although there is no assurance of this effect.  The light hydrocarbon recovered from the former gas plant site is compatible with our normal Penhex feedstock and is accumulated and transferred into the Penhex feedstock tank.  The material recovered from under the original SHR site is accumulated and sold as a by-product.  Approximately 70, 75, and 71 barrels were recovered during 2015, 2014 and 2013, respectively.  The recovered material had an economic value of approximately $3,500, $6,700, and $7,000 during 2015, 2014 and 2013, respectively. Consulting engineers estimate that as much as 20,000 barrels of recoverable material may be available to us for use in our process or for sale.  At current market values this material, if fully recovered would be worth approximately $0.9 million. The final volume present and the ability to recover it are both highly speculative issues due to the area over which it is spread and the fragmented nature of the pockets of hydrocarbon.  We have drilled additional wells periodically to further delineate the boundaries of the pools and to ensure that migration has not taken place. These tests confirmed that no migration of the hydrocarbon pools has occurred.  The TCEQ has deemed the current action plan acceptable and reviews the plan on a semi-annual basis.

The Clean Air Act Amendments of 1990. The Clean Air Act Amendments of 1990 had a positive effect on our business as manufacturers search for ways to use more environmentally acceptable materials in their processes. There is a current trend among manufacturers toward the use of lighter and more recoverable C5 hydrocarbons (pentanes) which comprise a large part of our product line. We believe our ability to manufacture high quality solvents in the C5 hydrocarbon market will provide a basis for growth over the coming years.   Also, as the use of C6 hydrocarbons (hexanes) is phased out in parts of the industry, several manufacturers of such hydrocarbons have opted to no longer market those products.  As the number of producers has consolidated, we have increased our market share at higher sales prices from customers who still require C6 hydrocarbons in their business.

Personnel

The number of our regular, U.S. Based employees was approximately 296, 271, and 166 for the years ended December 31, 2015, 2014 and 2013, respectively.  Of these employees, none are covered by collective bargaining agreements.  Regular employees are defined as active executive, management, professional, technical and wage employees who work full time or part time for the Company and are covered by our benefit plans and programs.  The significant increase during 2014 was primarily due to the Acquisition and D-train construction personnel needs.

Competition

The petrochemical, specialty wax, and mining industries are highly competitive.  There is competition within the industries and also with other industries in supplying the chemical and mineral needs of both industrial and individual consumers.  We compete with other firms in the sale or purchase of needed goods and services and employ all methods of competition which are lawful and appropriate for such purposes. See further discussion under “Intense competition” in Item 1a.

Investment in AMAK

As of December 31, 2015, we owned a 35% interest in AMAK.

Location, Access and Transportation.

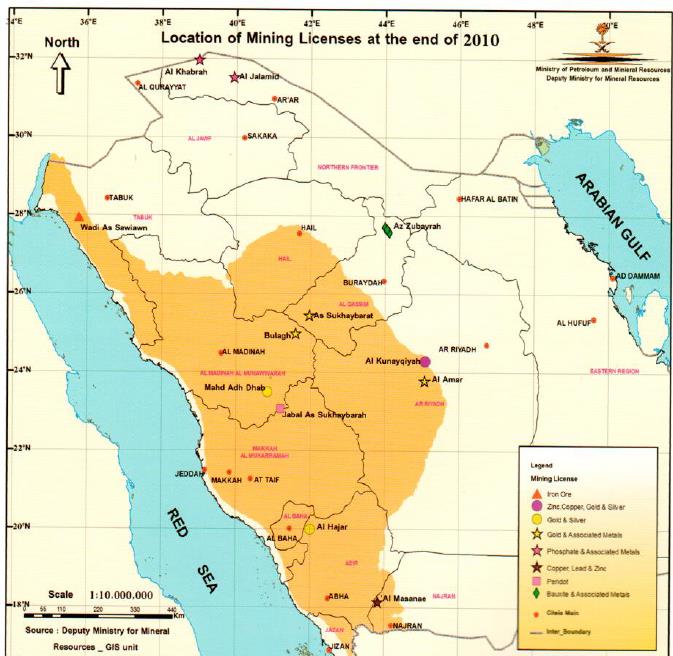
The facility site is located in Najran province in southwestern Saudi Arabia.  Najran, the capital of the province of the same name, is approximately 700 km southeast of Jeddah.  The site is located 145 km northwest of Najran, midway between the outpost of Rihab and the district town of Sufah.  A modern, paved highway extends from Najran through the town of Habuna passing by the project site and on to Sufah.  Another modern, paved highway extends west from the town of Tirima about 30 km to the Asir provincial line, becomes a four-lane divided highway, and intersects with a highway leading to Khamis Mushait and Abha.  A joining highway then extends down the western slope of the Sarawat mountains to the coastal highway which follows the coast south to the Port of Jazan.  The latter is the route AMAK’s trucks carry concentrate to the port for export.


6

 
Conditions to Retain Title.

The Saudi government granted the Company a mining lease for the Al Masane area comprising approximately 44 square kilometers or approximately 10,870 acres on May 22, 1993 (the “Lease”) under Royal Decree No. M/17.  The Lease was assigned to AMAK in December 2008.  The initial term of the Lease is thirty years beginning May 22, 1993, with AMAK having the option to renew or extend the term of the Lease for additional periods not to exceed twenty years. Under the Lease, AMAK is obligated to pay advance surface rental in the amount of 10,000 Saudi riyals (approximately $2,667 at the current exchange rate) per square kilometer per year (approximately $117,300 annually) during the term of the Lease.  In addition, AMAK must pay income tax in accordance with the laws of Saudi Arabia and pay all infrastructure costs.  The Lease gives the Saudi Arabian government priority to purchase any gold production from the project, as well as, the right to purchase up to 10% of the annual production of other minerals on the same terms and conditions then available to other similar buyers and at current prices then prevailing in the free market. Furthermore, the Lease contains provisions requiring that preferences be given to Saudi Arabian suppliers and contractors, that AMAK employ Saudi Arabian citizens and provide training to Saudi Arabian personnel.  In November 2015 AMAK received notification of final approval for additional licenses and leases.  The approval includes an additional 151 square kilometers (km2) of territory contiguous to AMAK’s current 44 km2 mine.  The new territory comprises the Guyan and Qatan exploration licenses covering 151 km2, and within the Guyan exploration license, a 10 km2 mining lease, which has potential for significant gold recovery.  Under the new leases, AMAK is required to pay surface rental of SR 110,000 (approximately $29,333) for a period of 20 years expiring in 2035.

Rock Formations and Mineralization.

Three mineralized zones, the Saadah, Al Houra and Moyeath, have been outlined by diamond drilling.  The Saadah and Al Houra zones occur in a volcanic sequence that consists of two mafic-felsic sequences with interbedded exhalative cherts and metasedimentary rocks.  The Moyeath zone was discovered after the completion of underground development in 1980.  It is located along an angular unconformity with underlying felsic volcanics and shales.  The principle sulphide minerals in all of the zones are pyrite, sphalerite, and chalcopyrite.  The precious metals occur chiefly in tetrahedrite and as tellurides and electrum.

Description of Current Property Condition.

The AMAK facility includes an underground mine, ore-treatment plant and related infrastructures.   The ore-treatment plant is comprised of primary crushing, ore storage, SAG milling and pebble crushing, secondary ball milling, pre-flotation, copper and zinc flotation, concentrate thickening, tailings filtration, cyanide leaching, reagent handling, tailings dam and utilities.  Related infrastructure includes a 300 man capacity camp for single status accommodation for expatriates and Saudi Arabian employees, an on-site medical facility, a service building for 300 employees, on-site diesel generation of 10 megawatts, potable water supply primarily from an underground aquifer, sewage treatment plant and an assay laboratory.  The facilities at the Port of Jazan are comprised of unloading facilities, concentrate storage and reclamation and ship loading facilities.  The above-ground ore processing facility became fully operational during the second half of 2012; and since the facility was constructed new at that time, it remains in relatively good condition.  Total cost to date is approximately USD $320 million.  AMAK plans to spend approximately $10 million on plant refurbishment and upgrades during 2016 with little beyond this since any new reserves will be processed at the same facility.

AMAK commenced commercial operation in July 2012.  AMAK shipped approximately 51,000, 55,000 and 72,000 metric tons of copper and zinc concentrate to outside smelters during 2015, 2014 and 2013, respectively.  In addition, in 2014 AMAK initiated operation of its precious metal recovery circuit at the mill and produced 4.1 kilograms of gold and 115.6 kilograms of silver.  In 2015, 46.2 kilograms of gold and 833.6 kilograms of silver were produced.

Late in the fourth quarter of 2015 AMAK temporarily closed the operation to preserve the assets in the ground while initiating steps to improve efficiencies and optimize operations to the point of being profitable even at current, low commodity prices.  AMAK is taking advantage of this outage to improve the gold and silver recovery process through the installation of SART modifications.  This change will allow improved precious metal recovery while also lowering chemical use, thereby reducing operating costs once processing resumes.  Precious metal recovery can continue even during the shutdown depending on labor availability.   The facility is expected to resume operation in the fourth quarter of 2016.


7

 
Saudi Industrial Development Fund (“SIDF”) Loan and Guarantee

On October 24, 2010, we executed a limited guarantee in favor of the SIDF guarantying up to 41% of the SIDF loan to AMAK in the principal amount of 330,000,000 Saudi Riyals (US$88,000,000) (the “Loan”). As a condition of the Loan, SIDF required all shareholders of AMAK to execute personal or corporate guarantees totaling 162.55% of the overall Loan amount.  As ownership percentages have changed over time, the loan guarantee allocation has not changed. The other AMAK shareholders provided personal guarantees.  We were the only AMAK shareholder providing a corporate guarantee. The loan was required in order for AMAK to fund construction of the underground and above-ground portions of its mining project in southwest Saudi Arabia and to provide working capital for commencement of operations.  The SIDF reviewed the current AMAK strategy relating to the shutdown, modifications, and improvements and agreed that it was appropriate.


Accounting Treatment of Investment in AMAK.

We have significant influence over the operating and financial policies of AMAK and therefore, account for it using the equity method.  One of our directors is chairman of the Nomination, Reward and Compensation Committee of the Board of Directors and is an ex-officio member of the Executive Committee of the Board of Directors of AMAK.  One of our


8

 
directors and officers is a member of the Audit Committee of the Board of Directors of AMAK.   We also have two directors on the Commercial Committee of AMAK.  We recently hired an Irish gentleman with extensive mining experience to serve as a third AMAK director representing TREC, and he serves on the investment committee.  We also spearheaded the process of locating, interviewing and hiring a new Chief Executive Officer for AMAK who began work in March 2014.  See Note 10 to the Notes to the Consolidated Financial Statements.

We assess our investment in AMAK for impairment when events are identified, or there are changes in circumstances that indicate that the carrying amount of the investment might not be recoverable. We consider recoverable ore reserves, mineral prices, operational costs, and the amount and timing of the cash flows to be generated by the production of those reserves, as well as recent equity transactions within AMAK.

Available Information

We will provide paper copies of this Annual Report on Form 10-K, our quarterly reports on Form 10-Q, our current reports on Form 8-K and amendments to those reports, all as filed or furnished pursuant to Section 13(a) or 15(d) of the Securities Exchange Act of 1934, free of charge upon written or oral request to Trecora Resources, P. O. Box 1636, Silsbee, TX  77656, (409) 385-8300.  These reports are also available free of charge on our website, www.trecora.com, as soon as reasonably practicable after they are filed electronically with the SEC.  SHR also has a website at www.southhamptonr.com, TC has a website at TrecChem.com, and AMAK has a website at www.amak.com.sa. These websites and the information contained on or connected to them are not incorporated by reference herein to the SEC filings.

Item 1A.   Risk Factors.

Our financial and operating results are subject to a variety of risks inherent in the global petrochemical, specialty wax and mining businesses (due to our investment in AMAK).  Many of these risk factors are not within our control and could adversely affect our business, our financial and operating results or our financial condition.  We discuss some of these risks in more detail below in no particular order of priority.

Dependence on a limited number of customers could adversely impact profitability

During 2015 sales to one customer exceeded 10 percent of SHR’s revenues.  See the information regarding dependence on a limited number of customers set forth in Part I, Item I Business under the caption “United States Specialty Petrochemical Operation”. The total loss of a large volume customer could adversely affect our ability to market products on a competitive basis and generate a profit.

Climate change and greenhouse gas restrictions

Due to concern over the risk of climate change, a number of countries have adopted, or are considering the adoption of, regulatory frameworks to reduce greenhouse gas emissions. These include adoption of cap and trade regimes, carbon taxes, restrictive permitting, increased efficiency standards, and incentives or mandates for renewable energy. These requirements could make our products more expensive, lengthen project implementation times, and reduce demand for hydrocarbons, as well as shift hydrocarbon demand toward relatively lower-carbon sources such as natural gas. Current and pending greenhouse gas regulations may also increase our compliance costs, such as for monitoring or sequestering emissions.

Varying economic conditions could adversely impact demand for products and metals

The demand for our products and metals correlates closely with general economic growth rates.  The occurrence of recessions or other periods of low or negative growth will typically have a direct adverse impact on our results.  Other factors that affect general economic conditions in the world or in a major region, such as changes in population growth rates or periods of civil unrest, also impact the demand for our products and metals.  Economic conditions that impair the functioning of financial markets and institutions also pose risks to us, including risks to the safety of our financial assets and to the ability of our partners and customers to fulfill their commitments to us.  In addition, the revenue and profitability of our operations have historically varied, which makes future financial results less predictable. Our revenue, gross margin and profit vary among our products, customer groups and geographic markets; and therefore, will likely be different in future periods than currently. Overall gross margins and profitability in any given period are dependent partially on the product, customer and geographic mix reflected in that period’s net revenue. In addition, newer


9

 
geographic markets may be relatively less profitable due to investments associated with entering those markets and local pricing pressures. Market trends, competitive pressures, increased raw material or shipping costs, regulatory impacts and other factors may result in reductions in revenue or pressure on gross margins of certain segments in a given period which may necessitate adjustments to our operations.

Environmental regulation

Our industries are subject to extensive environmental regulation pursuant to a variety of federal and state regulations.  Such environmental legislation imposes, among other things, restrictions, liabilities and obligations in connection with storage, transportation, treatment and disposal of hazardous substances and waste.  Legislation also requires us to operate and maintain our facilities to the satisfaction of applicable regulatory authorities.  Costs to comply with these regulations are significant to our business.  Failure to comply with these laws or failure to obtain permits may expose us to fines, penalties or interruptions in operations that could be material to our results of operations.  In addition, some of the finished goods our customers produce, such as expandable polystyrene (EPS), are subject to increasing scrutiny and regulation, which could lead to a reduction in demand for our products.

Safety, business controls, environmental and cyber risk management

Our results depend upon management’s ability to minimize the inherent risks of our operations, to control effectively our business activities and to minimize the potential for human error.  We apply rigorous management systems and continuous focus to workplace safety and to avoid spills or other adverse environmental events.  Substantial liabilities and other adverse impacts could result if our systems and controls do not function as intended.  Business risks also include the risk of cyber security breaches.  If our systems for protecting against cyber security risks prove to be insufficient, we could be adversely affected by having our business systems compromised, our proprietary information altered, lost or stolen, or our business operations disrupted.

Regulatory and litigation

Even in countries with well-developed legal systems where we do business, we remain exposed to changes in law that could adversely affect our results, such as increases in taxes, price controls, changes in environmental regulations or other laws that increase our cost of compliance, and government actions to cancel contracts or renegotiate items unilaterally.  We may also be adversely affected by the outcome of litigation or other legal proceedings, especially in countries such as the United States in which very large and unpredictable punitive damage awards may occur.  AMAK’s  mining and exploration leases are subject to the risk of termination if AMAK does not comply with its contractual obligations.  Further, our investment in AMAK is subject to the risk of expropriation or nationalization. If a dispute arises, we may have to submit to the jurisdiction of a foreign court or panel or may have to enforce the judgment of a foreign court or panel in that foreign jurisdiction.  Because of our substantial international investment, our business is affected by changes in foreign laws and regulations (or interpretation of existing laws and regulations) affecting our industries, and foreign taxation. We will be directly affected by the adoption of rules and regulations (and the interpretations of such rules and regulations) regarding the exploration and development of mineral properties for economic, environmental and other policy reasons. We may be required to make significant capital expenditures to comply with non-U.S. governmental laws and regulations.  It is also possible that these laws and regulations may in the future add significantly to our operating costs or may significantly limit our business activities. Additionally, our ability to compete in the international market may be adversely affected by non-U.S. governmental regulations favoring or requiring the awarding of leases, concessions and other contracts or exploration licenses to local contractors or requiring foreign contractors to employ citizens of, or purchase supplies from, a particular jurisdiction.  We are not currently aware of any specific situations of this nature, but there are always opportunities for this type of difficulty to arise in the international business environment.

Loss of key personnel and management effectiveness

In order to be successful, we must attract, retain and motivate executives and other key employees including those in managerial, technical, sales, and marketing positions. We must also keep employees focused on our strategies and goals. The failure to hire, or loss of, key employees could have a significant adverse impact on operations.  An important component of our competitive performance is our ability to operate efficiently including our ability to manage expenses and minimize the production of low margin products on an on-going basis.  This requires continuous management focus including technological improvements, cost control and productivity enhancements.  The extent to which we manage these factors will impact our performance relative to competition.


10

 
Risk associated with extraordinary transactions

As part of our business strategy, we sometimes engage in discussions with third parties regarding possible investments, acquisitions, strategic alliances, joint ventures, divestitures and outsourcing transactions (“extraordinary transactions”) and enter into agreements relating to such extraordinary transactions in order to further our business objectives.  In order to pursue this strategy successfully, we must identify suitable candidates for and successfully complete extraordinary transactions, some of which may be large and complex, and manage post-closing issues such as the integration of acquired companies or employees. Integration and other risks of extraordinary transactions can be more pronounced for larger and more complicated transactions, or if multiple transactions are pursued simultaneously. If we fail to identify and complete successfully extraordinary transactions that further our strategic objectives, we may be required to expend resources to develop products and technology internally, we may be at a competitive disadvantage or we may be adversely affected by negative market perceptions, any of which may have a material adverse effect on our revenue, gross margin and profitability. Integration issues are complex, time-consuming and expensive and, without proper planning and implementation, could significantly disrupt our business. The challenges involved in integration include:

Combining product offerings and entering into new markets in which we are not experienced;

Convincing customers and distributors that the transaction will not diminish client service standards or business focus, preventing customers and distributors from deferring purchasing decisions or switching to other suppliers (which could result in our incurring additional obligations in order to address customer uncertainty), and coordinating sales, marketing and distribution efforts;

Minimizing the diversion of management attention from ongoing business concerns;

Persuading employees that business cultures are compatible, maintaining employee morale and retaining key employees, engaging with employee works councils representing an acquired company’s non-U.S. employees, integrating employees into the Company, correctly estimating employee benefit costs and implementing restructuring programs;

Coordinating and combining administrative, manufacturing, and other operations, subsidiaries, facilities and relationships with third parties in accordance with local laws and other obligations while maintaining adequate standards, controls and procedures;

Achieving savings from supply chain integration; and

Managing integration issues shortly after or pending the completion of other independent transactions.

We periodically evaluate and enter into significant extraordinary transactions on an ongoing basis. We may not fully realize all of the anticipated benefits of any extraordinary transaction, and the timeframe for achieving benefits of an extraordinary transaction may depend partially upon the actions of employees, suppliers or other third parties. In addition, the pricing and other terms of our contracts for extraordinary transactions require us to make estimates and assumptions at the time we enter into these contracts, and, during the course of our due diligence, we may not identify all of the factors necessary to estimate our costs accurately. Any increased or unexpected costs, unanticipated delays or failure to achieve contractual obligations could make these agreements less profitable or unprofitable. Managing extraordinary transactions requires varying levels of management resources, which may divert our attention from other business operations. These extraordinary transactions also have resulted and in the future may result in significant costs and expenses and charges to earnings. Moreover, we have incurred and will incur additional depreciation and amortization expense over the useful lives of certain assets acquired in connection with extraordinary transactions, and, to the extent that the value of goodwill or intangible assets with indefinite lives acquired in connection with an extraordinary transaction becomes impaired, we may be required to incur additional material charges relating to the impairment of those assets. In order to complete an acquisition, we may issue common stock, potentially creating dilution for existing stockholders, or borrow, affecting our financial condition and potentially our credit ratings. Any prior or future downgrades in our credit rating associated with an acquisition could adversely affect our ability to borrow and result in more restrictive borrowing terms. In addition, our effective tax rate on an ongoing basis is uncertain, and extraordinary transactions could impact our effective tax rate. We also may experience risks relating to the challenges and costs of closing an extraordinary transaction and the risk that an announced extraordinary transaction may not close.


11

 
As a result, any completed, pending or future transactions may contribute to financial results that differ from the investment community’s expectations in a given quarter.

Guaranteeing performance by others including third parties and others

From time to time, we may be required or determine it is advisable to guarantee performance of loan agreements by others in which we maintain a financial interest. In such instances, if the primary obligor is unable to perform its obligations, we might be forced to perform the primary obligor’s obligations which could negatively impact our financial interests.

Economic and political instability; terrorist acts; war and other political unrest

The conflict and hostilities in Yemen could disrupt or interfere with the operations of AMAK whose corporate offices and mining assets are located in Najran province of Saudi Arabia.  In addition, the potential for additional future terrorist acts and other recent events, including ISIL terrorist related activities and civil unrest in the Middle East, have caused uncertainty in the world’s financial markets and have significantly increased global political, economic and social instability, including in Saudi Arabia, a country in which we have a substantial investment.  It is possible that further acts of terrorism may be directed against the United States domestically or abroad, and such acts of terrorism could be directed against our investment in those locations.  Such economic and political uncertainties may materially and adversely affect our business, financial condition or results of operations in ways that cannot be predicted at this time.  Although it is impossible to predict the occurrences or consequences of any such events, they could result in a decrease in demand for our products, make it difficult or impossible to deliver products to our customers or to receive components from our suppliers, create delays and inefficiencies in our supply chain and result in the need to impose employee travel restrictions. We are predominantly uninsured for losses and interruptions caused by terrorist acts, conflicts and wars. Our future revenue, gross margin, expenses and financial condition also could suffer due to a variety of international factors, including:

•     Ongoing instability or changes in a country’s or region’s economic or political conditions, including inflation, recession, interest rate fluctuations and actual or anticipated military or political conflicts;

•     Longer accounts receivable cycles and financial instability among customers;

•     Trade regulations and procedures and actions affecting production, pricing and marketing of products;

•     Local labor conditions and regulations;

•     Geographically dispersed workforce;

•     Changes in the regulatory or legal environment;

•     Differing technology standards or customer requirements;

•     Import, export or other business licensing requirements or requirements relating to making foreign direct investments, which could affect our ability to obtain favorable terms for labor and raw materials or lead to penalties or restrictions;

•     Difficulties associated with repatriating cash generated or held abroad in a tax-efficient manner and changes in tax laws; and

•     Fluctuations in freight costs and disruptions in the transportation and shipping infrastructure at important geographic points of exit and entry for our products and shipments.

Business disruption

Business disruptions could harm our future revenue and financial condition and increase our costs and expenses. Our operations could be subject to earthquakes, power shortages, telecommunications failures, water shortages, tsunamis, floods, hurricanes, typhoons, fires, extreme weather conditions, medical epidemics and other natural or manmade
 
 
12

 
disasters or business interruptions, for some of which we may be self-insured. The occurrence of any of these business disruptions could harm our revenue and financial condition and increase our costs and expenses.

Dependence on AMAK management

We rely upon AMAK’s management and Board to employ various respected engineering and financial advisors to assist in the development and evaluation of the mining projects in Saudi Arabia.  Notwithstanding the utilization of any outside consultants, our risk will continue to and will ultimately depend upon AMAK’s ability to use consultants and experienced personnel to manage the operation in Saudi Arabia.

Inability to control AMAK activities

Although we believe that we have significant influence over the operating and financial policies of AMAK, we do not control AMAK’s activities.  The extent to which we are able to influence specific operating and financial decisions depends on our ability to persuade other AMAK board members and management regarding these policies.  Our ability to persuade them may be adversely affected by cultural differences, differing accounting and management practices, differing governmental laws and regulations, and the fact that the AMAK mining project is halfway around the world from our main base of operations in the United States.

Inability to recoup investment in AMAK

We will only recover our investment in AMAK through the receipt of dividends from AMAK or the sale of part or all of our interest in AMAK. There is a risk that we will be unable to recover our investment in AMAK if AMAK is not profitable, or if AMAK’s Board of Directors chooses not to declare dividends even if AMAK is profitable.  With respect to the sale of part or all of our interest in AMAK, under Saudi Arabian law, AMAK must sell a portion of its equity to the public once AMAK has been profitable for two years. While the proceeds of such a sale might allow us to recover our investment in AMAK, there is no assurance that AMAK will achieve the profitability required for such a public sale, or that the market conditions for any such public sale will be favorable enough to allow us to recover our investment.

Cancellation of the current mining leases held by AMAK

In the event that the Saudi Ministry of Petroleum and Minerals cancels the current leases, AMAK shareholders including us could lose their investment or be forced to sell for a loss.

AMAK could suffer sustained operational difficulties

Operating difficulties are many and various, ranging from unexpected geological variations that could result in significant ground or containment failure to breakdown of key capital equipment.  Reliable roads, rail networks, ports, power generation and transmission, and water supplies are required to access and conduct AMAK’s operations.  AMAK transports all of its products first by truck and then by sea.  Limitations or interruptions in transport infrastructure could impede its ability to deliver products.

AMAK may have fewer mineral reserves than its estimates indicate

AMAK’s reserves estimations may change substantially if new information subsequently becomes available.  Fluctuations in the price of commodities, variation in production costs or different recovery rates may ultimately result in AMAK’s estimated reserves being revised.  If such a revision were to indicate a substantial reduction in proven or probable reserves at one or more of AMAK’s projects, it could negatively affect our investment in AMAK.

Cost pressures could negatively impact AMAK’s operating margins and expansion plans

Cost pressures may continue to occur across the resources industry. As the prices for AMAK’s products are determined by the global commodity markets in which it operates, AMAK does not generally have the ability to offset these cost pressures through corresponding price increases, which can adversely affect its operating margins or require changes in operations, including, but not limited to, temporary planned shutdowns. Notwithstanding AMAK’s efforts to reduce costs and a number of key cost inputs being commodity price-linked, the inability to reduce costs and a timing lag may adversely impact AMAK’s operating margins for an extended period.

 
13

 
Excess products

As noted previously, an important component of our competitive performance is our ability to minimize the production of low margin products on an on-going basis.  Although the hydrocarbon constituents comprising the petrochemical feedstock we use may vary somewhat over time, they tend to fall into relatively narrow percentage bands as compared to overall feedstock composition.  By nature of the fractionation process that we utilize, if we make one product, we make them all; therefore, when we receive a significant order for a particular finished product, additional products may be manufactured necessitating sales into secondary, lower margin markets.  We continue to investigate options to maintain or improve margins.

An impairment of goodwill could negatively impact our financial results

At least annually, we assess goodwill for impairment.  If an initial qualitative assessment identifies that it is more likely than not that the carrying value of a reporting unit exceeds its estimated fair value, additional quantitative testing is performed. We may also elect to skip the qualitative testing and proceed directly to quantitative testing.  If the quantitative testing indicates that goodwill is impaired, the carrying value of goodwill is written down to fair value with a charge against earnings.  Since we utilize a discounted cash flow methodology to calculate the fair value of our operating units, continued weak demand for a specific product line or business could result in an impairment.  Accordingly, any determination requiring the write-off of a significant portion of goodwill could negatively impact our results of operations.

Item 1B.   Unresolved Staff Comments.

None

Item 2.  Properties.

United States Specialty Petrochemical Facility

SHR owns and operates a specialty petrochemical facility near Silsbee, Texas which is approximately 30 miles north of Beaumont, Texas, and 90 miles east of Houston. The facility consists of eight operating units which, while interconnected, make distinct products through differing processes: (i) a Penhex Unit; (ii) a Reformer; (iii) a Cyclo-pentane Unit; (iv) an Aromax® Unit; (v) an Aromatics Hydrogenation Unit; (vi) a White Oil Fractionation Unit; (vii) a Hydrocarbon Processing Demonstration Unit, and (viii) a P-Xylene Unit.  All of these units are currently in operation.

GSPL owns and operates three (3) 8-inch diameter pipelines and five (5) 4-inch diameter pipelines aggregating approximately 70 miles in length connecting SHR’s facility to: (1) a natural gas line, (2) SHR’s truck and rail loading terminal and (3) a major petroleum products pipeline system owned by an unaffiliated third party.  All pipelines are operated within Texas Railroad Commission and DOT regulations for maintenance and integrity.

United States Specialty Polyethylene Wax Facility

TC owns and operates a specialty synthetic wax facility from its 21 acre plant site located in Pasadena, Texas.  The facility contains 6 stainless steel reactors ranging in size from 3,300 to 16,000 gallons with overhead condensing systems, two 4,000 gallon glass line reactors; 3 Sandvik forming belts with pastilling capabilities, two 12 square meter wipe file evaporators, steel batch column with 10,000 gallon still pot and 20 theoretical stages of structured packing.  There is also a fully equipped laboratory onsite.

Investment in AMAK

As of December 31, 2015, we owned a 35% interest in AMAK.

Prior to December 2008, we held a thirty (30) year mining lease (which commenced on May 22, 1993) covering an approximate 44 square kilometer area in Najran Province in southwestern Saudi Arabia. The lease carried an option to renew or extend the term of the lease for additional periods not to exceed twenty (20) years.  The lease and other related assets located in Saudi Arabia were contributed to AMAK in December 2008.  The above-ground ore processing facility became fully operational during the second half of 2012.

 
14

 
The facility includes an underground mine, ore-treatment plant and related infrastructures.   The ore-treatment plant is comprised of primary crushing, ore storage, SAG milling and pebble crushing, secondary ball milling, pre-flotation, copper and zinc flotation, concentrate thickening, tailings filtration, cyanide leaching, reagent handling, tailings dam and utilities.  Related infrastructure includes a 300 men capacity camp for single status accommodation for expatriates and Saudi employees, an on-site medical facility, a service building for 300 employees, on-site diesel generation of 10 megawatts, potable water supply, sewage treatment plant and an assay laboratory.  The facilities at the Port of Jazan are comprised of unloading facilities, concentrate storage and reclamation and ship loading facilities.

Metal price assumptions follow U. S. Securities and Exchange Commission guidance not to exceed a three year trailing average.  The following chart illustrates the change in metal prices from the previous three year average to current levels:

 
Average Price
Spot Price as of
 
Percentage
 
 
For 2013-2015
12/31/15
 
Increase (Decrease)
 
Gold
$1,278.98 per ounce
$1,060.00 per ounce
    (17.12 )%
Silver
$ 19.53 per ounce
$ 13.82  per ounce
    (29.24 )%
Copper
$  2.98 per pound
$  2.13  per pound
    (28.52 )%
Zinc
$  0.91 per pound
$  0.73  per pound
    (19.78 )%

AMAK was severely impacted by the continued fall in metal demand and prices (average spot prices for zinc and copper in fourth quarter 2015 were down approximately 13% and 7%, respectively), compared to third quarter 2015.

Three mineralized zones, the Saadah, Al Houra and Moyeath, were outlined by initial diamond drilling.  The following tables set forth a summary of the diluted recoverable, proven and probable mineralized materials of AMAK in the Al Masane area along with the estimated average grades of these mineralized materials as adjusted to reflect production that began in July 2012:

Zone
 
Proven Reserves
(Tonnes)
(000’s)
   
Copper
(%)
   
Zinc
(%)
   
Gold
 (g/t)
   
Silver
(g/t)
 
Saadah
    448       1.5       3.7       0.8       21.0  
Al Houra
    29       0.8       3.8       0.7       21.0  
Moyeath
    -       -       -       -       -  
Total
    477       1.4       3.7       .8       21.0  
                                         
Zone
 
Probable Reserves
(Tonnes)
(000’s)
   
Copper
(%)
   
Zinc
(%)
   
Gold
(g/t)
   
Silver
(g/t)
 
Saadah
    5,193       1.2       3.4       0.8       23.0  
Al Houra
    1,894       0.9       3.8       1.2       39.0  
Moyeath
    702       0.8       7.2       1.0       55.0  
Total
    7,789       1.1       3.9       0.9       29.0  
                                         
Total proven and probable reserves
    8,266                                  
Less production through December 31, 2015
    2,371                                  
Remaining proven and probable reserves
    5,895                                  

Our rights to obtain additional mining licenses to other adjoining areas were also transferred to AMAK in December 2008 as part of our initial capital contribution.  AMAK received formal approval in November 2015 of an additional 151 square kilometers or 37,313 acres of territory relatively close to the current mine.  The new territory comprises the Guyan and Qatan exploration licenses covering 151 square kilometers and within the Guyan exploration license, a 10 square kilometers or 2,471 acre mining lease which has potential for significant gold recovery.  Although some exploration holes were drilled in both Guyan and Qatan up to 40 years ago, no reserves are attributable to these areas.

For purposes of calculating proven and probable mineralized materials, a dilution of 5% at zero grade on the Saadah zone and 15% at zero grade on the Al Houra and Moyeath zones was assumed. A mining recovery of 80% was used for the Saadah zone and 88% for the Al Houra and Moyeath zones.  Mining dilution is the amount of wallrack adjacent to
 
 
15


the ore body that is included in the ore extraction process.  Base case cutoffs used were 5.0% zinc equivalent.  Ore reserves were estimated using metal prices of USD $0.85 per pound for zinc, $2.50 per pound for copper, $800 per ounce for gold and $12.0 per ounce for silver.  Resource estimates are exclusive of reserve estimates.

Historic three-year average commodity prices are shown in the following table:

   
Average Price in USD
 
      2011-2013       2012-2014       2013-2015  
Gold per ounce
  $ 1,577.00     $ 1,448.33     $ 1,278.98  
Silver per ounce
  $ 28.45     $ 24.67     $ 19.53  
Copper per pound
  $ 3.55     $ 3.25     $ 2.98  
Zinc per pound
  $ 0.89     $ 0.88     $ 0.91  

Proven mineralized materials are those mineral deposits for which quantity is computed from dimensions revealed in outcrops, trenches, workings or drill holes, and grade is computed from results of detailed sampling.  For ore deposits to be proven, the sites for inspection, sampling and measurement must be spaced so closely and the geologic character must be so well defined that the size, shape, depth and mineral content of reserves are well established. Probable mineralized materials are those for which quantity and grade are computed from information similar to that used for proven mineralized materials, but the sites for inspection, sampling and measurement are farther apart or are otherwise less adequately spaced. However, the degree of assurance, although lower than that for proven mineralized materials, must be high enough to assume continuity between points of observation.

The metallurgical studies conducted on the ore samples taken from the zones indicated that 87.7% of the copper and 82.6% of the zinc could be recovered in copper and zinc concentrates. Overall, gold and silver recovery from the ore was estimated to be 77.3% and 81.3%, respectively, partly into copper concentrate and partly as bullion through cyanide processing of zinc concentrates and mine tailings. Further studies recommended by consultants may improve those recoveries and thus the potential profitability of the project; however, there can be no assurances of this effect.

In the 1994 feasibility study the geologists and engineers stated that there is potential to find more reserves within the Lease area, as the ore zones are all open at depth. Further diamond drilling is required to quantify the additional mineralization associated with these zones. A significant feature of the Al Masane ore zones is that they tend to have a much greater vertical plunge than strike length; relatively small surface exposures such as the Moyeath zone may be developed into sizeable ore tonnages by thorough and systematic exploration. Similarly, systematic prospecting of the small surface indicators of mineralization in the area could yield significant tonnages of new ore.  Updates to the feasibility study were completed in 1996, 2005 and July 2009.

An updated reserve study or audit has not been performed over the last three years.  AMAK is however, preparing a policy regarding updating reserve studies and audits in 2016.

The following table sets forth tonnage mined with average assay values per year:

Year
 
Mine Head Grade
   
Mill Throughput
 
   
%Cu
   
%Zn
   
dmt
 
2011
    1.26       3.02       9,460  
2012
    1.18       3.39       399,892  
2013
    1.48       3.19       699,316  
2014
    1.22       3.15       670,812  
2015
    1.11       3.69       591,419  

The following table sets forth tonnage milled with average assay values and metallurgical recoveries per year:

Year
 
Copper Concentrate
   
Zinc Concentrate
 
   
dmt
   
%Cu
   
%Zn
   
Recovery
   
dmt
   
%Zn
   
%Cu
   
Recovery
 
2011
    443       16.51       7.51       61.64       377       40.69       3.56       53.64  
2012
    15,944       23.91       5.46       80.62       20,738       50.03       1.16       76.54  
2013
    35,140       25.20       4.73       85.68       33,460       49.82       0.83       74.62  
2014
    28,476       24.20       4.31       84.24       31,600       51.02       0.70       76.26  
2015
    24,218       22.70       5.13       84.12       35,447       48.46       0.62       78.63  


16

 
The following table sets forth tonnage sold with concentrate assay values and value received per year:

Year
 
Copper Concentrate
   
Zinc Concentrate
 
   
dmt
   
%Cu
   
Value received
(in USD millions)
   
dmt
   
%Zn
   
Value received
(in USD millions)
 
2011
    -       -       -       -       -       -  
2012
    5,488       23.51     $ 6.9       15,193       47.53     $ 8.7  
2013
    35,908       23.86     $ 80.8       38,430       47.79     $ 24.2  
2014
    25,691       24.20     $ 42.3       29,326       50.52     $ 21.0  
2015
    26,378       23.50     $ 34.6       24,547       49.68     $ 16.0  

United States Mineral Interest

Our only mineral interest in the United States is its ownership interest in PEVM.  See Item 1 – Business – United States Mineral Interests.

Offices

Outside of the facilities that we own, SHR has a leased corporate and sales office in Sugar Land, Texas.

Item 3.  Legal Proceedings.

On March 21, 2011, Mr. El Khalidi filed suit against the Company in Texas alleging breach of contract and other claims.  The 88th Judicial District Court of Hardin County, Texas dismissed all claims and counterclaims for want of prosecution in this matter on July 24, 2013.  The Ninth Court of Appeals subsequently affirmed the dismissal for want of prosecution and the Supreme Court of Texas denied Mr. El Khalidi’s petition for review.  On May 1, 2014, Mr. El Khalidi refiled his lawsuit against the Company for breach of contract and defamation in the 356th Judicial District Court of Hardin County, Texas.  The case was transferred to the 88th Judicial District Court of Hardin County, Texas where it is currently pending.  On April 6, 2015, Mr. El-Khalidi nonsuited his defamation claim.  We believe that the remaining claims are unsubstantiated and plan to vigorously defend the case.  Liabilities of approximately $1.0 million remain recorded, and the options will continue to accrue in accordance with their own terms until all matters are resolved.

On September 14, 2010, SHR received notice of a lawsuit filed in the 58th Judicial District Court of Jefferson County, Texas which was subsequently transferred to the 11th Judicial District Court of Harris County, Texas.  The suit alleges that the plaintiff became ill from exposure to asbestos.  There are approximately 44 defendants named in the suit.  On December 15, 2015, plaintiff agreed to settle all claims against SHR for a de minimis amount.

On April 30, 2015, TC and TREC received notice of a lawsuit filed in the 152nd Judicial District Court of Harris County, Texas.  The suit alleges that the plaintiff, an independent contractor employee, was injured while working on a product line at TC.  We have placed our insurers on notice and plan to vigorously defend the case. 

On or about August 3, 2015, SHR received notice of a lawsuit filed in the 14th Judicial District Court of Calcasieu Parish, Louisiana.  The suit alleges that the plaintiff became ill from exposure to benzene.  SHR placed its insurers on notice.  Its insurers retained a law firm based in Louisiana to defend SHR.

Item 4. Mine Safety Disclosures.

Not applicable.

 
17


PART II

Item 5.  Market for Registrant’s Common Equity, Related Stockholder Matters, and Issuer Purchases of Equity Securities.

Our common stock traded on the New York Stock Exchange (“NYSE”) during the last two fiscal years under the symbols: TREC or ARSD. The following table sets forth the high and low bid prices for each quarter as reported by NYSE. The quotations reflect inter-dealer prices, without retail mark-up, mark-down or commission and may not represent actual transactions.

   
NYSE
 
   
High
   
Low
 
Fiscal Year Ended December 31, 2015
           
Fourth Quarter ended December 31, 2015
  $ 14.96     $ 11.79  
Third Quarter ended September 30, 2015
  $ 16.50     $ 11.50  
Second Quarter ended June 30, 2015
  $ 15.48     $ 11.00  
First Quarter ended March 31, 2015
  $ 15.25     $ 11.36  
                 
Fiscal Year Ended December 31, 2014
     
Fourth Quarter ended December 31, 2014
  $ 15.61     $ 10.55  
Third Quarter ended September 30, 2014
  $ 13.48     $ 11.36  
Second Quarter ended June 30, 2014
  $ 12.83     $ 9.72  
First Quarter ended March 31, 2014
  $ 13.17     $ 10.50  

At March 7, 2016, there were approximately 390 recorded holders (including brokers’ accounts) of the Company’s common stock. We have not paid any dividends since our inception and, at this time, do not have any plans to pay dividends in the foreseeable future.  The current lender allows the petrochemical subsidiaries to pay dividends to the parent company of up to 30% of EBITDA.  We were in compliance with this restriction as of December 31, 2015.  See Note 12 to the Consolidated Financial Statements.

Total Stockholder Return

The following graph compares the cumulative total stockholder return on our common stock against the NYSE Composite Index and the S&P Specialty Chemical Index, for the five years ending December 31, 2015.  The graph was constructed on the assumption that $100 was invested in our common stock and each comparative on December 31, 2010, and that any dividends were fully reinvested.
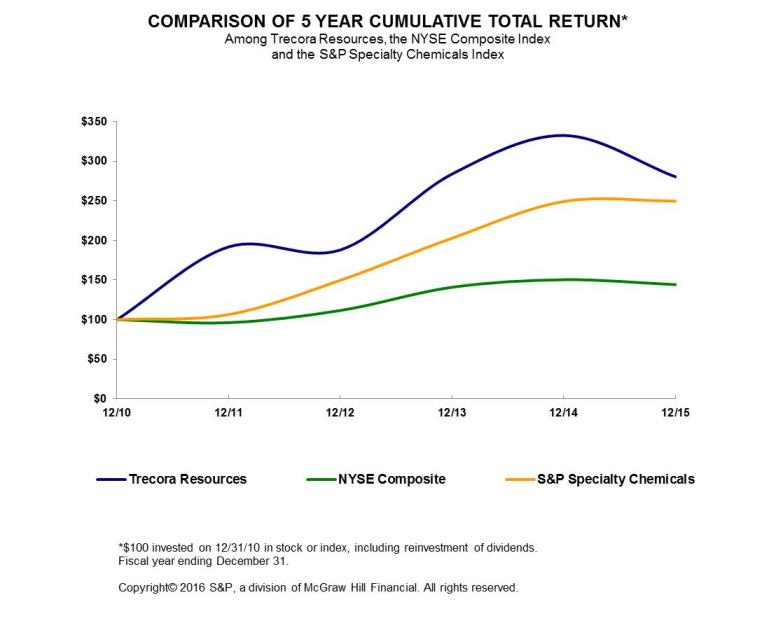
 
18


Item 6.  Selected Financial Data.

The following is a five-year summary of selected financial data (in thousands, except per share amounts):

   
2015
   
2014
   
2013
   
2012
   
2011
 
Revenues
  $ 241,976     $ 289,643     $ 236,227     $ 222,858     $ 199,517  
Net Income
    18,598       15,571       19,498       10,321       13,884  
Net Income Per Share-Diluted
    0.74       0.63       0.79       0.42       0.57  
EBITDA
    39,639       29,814       32,505       20,704       24,722  
Adjusted EBITDA
    47,317       33,027       25,020       21,430       17,762  
Total Assets (at December 31)
    258,811       232,074       143,667       120,376       117,833  
Current Portion of Long-Term Debt (at December 31)
    8,333       7,000       1,400       1,500       1,500  
Total Long-Term Debt Obligations (at December 31)
    73,917       73,450       11,839       14,239       22,739  

The acquisition of TC was completed in the fourth quarter of 2014 as reflected in the table above.

Non-GAAP Financial Measures

We include in this Annual Report the non-GAAP financial measures of EBITDA and Adjusted EBITDA and provide reconciliations from our most directly comparable financial measures to those measures.

We define EBITDA as net income plus interest expense including derivative gains and losses, income taxes, depreciation and amortization.  We define Adjusted EBITDA as EBITDA plus share-based compensation and plus or minus equity in AMAK’s earnings and losses or gains from equity issuances.  Both of these measures are not measures of financial performance or liquidity under U.S. GAAP and should be considered in addition to, not as a substitute for, net income (loss), nor as an indicator of cash flows reported in accordance with U.S. GAAP. These measures are used as supplemental financial measure by management and external users of our financial statements such as investors, banks, research analysts and others.  We believe that these non-GAAP measures are useful as they exclude transactions not related to our core cash operating activities.

The following table presents a reconciliation of net income to EBITDA and Adjusted EBITDA our most directly comparable GAAP financial performance measure for each of the periods presented.

   
2015
   
2014
   
2013
   
2012
   
2011
 
Net Income
  $ 18,598     $ 15,571     $ 19,498     $ 10,321     $ 13,884  
  Add:
                                       
    Interest expense
    2,232       1,042       520       547       699  
    Derivative (gains) losses on interest rate swap
    (15 )     378       301       359       414  
    Depreciation and amortization
    9,060       5,676       4,039       3,573       3,220  
    Income tax expense
    9,764       7,147       8,147       5,904       6,505  
EBITDA
    39,639       29,814       32,505       20,704       24,722  
                                         
  Add:
                                       
    Share-based compensation
    2,353       2,141       1,215       515       872  
    Equity in (earnings) losses of AMAK
    5,325       1,072       (4,703 )     211       1,018  
    Gain from additional equity issuance by AMAK
    -       -       (3,997 )     -       (8,850 )
Adjusted EBITDA
  $ 47,317     $ 33,027     $ 25,020     $ 21,430     $ 17,762  

Item 7.  Management’s Discussion and Analysis of Financial Condition and Results of Operations.

Forward Looking Statements

Statements in Items 7 and 7A, as well as elsewhere in or incorporated by reference in, this Annual Report on Form 10-K regarding the Company’s financial position, business strategy and plans and objectives of the Company’s management for future operations and other statements that are not historical facts, are “forward-looking statements” as that term is
 
 
19


defined under applicable Federal securities laws. In some cases, “forward-looking statements” can be identified by terminology such as “may,” “will,” “should,” “expects,” “plans,” “anticipates,” “contemplates,” “proposes,” “believes,” “estimates,” “predicts,” “potential” or “continue” or the negative of such terms and other comparable terminology. Forward-looking statements are subject to risks, uncertainties and other factors that could cause actual results to differ materially from those expressed or implied by such statements. Such risks, uncertainties and factors include, but are not limited to, general economic conditions domestically and internationally; insufficient cash flows from operating activities; difficulties in obtaining financing; outstanding debt and other financial and legal obligations; lawsuits; competition; industry cycles; feedstock, product and mineral prices; feedstock availability; technological developments; regulatory changes; environmental matters; foreign government instability; foreign legal and political concepts; and foreign currency fluctuations, as well as other risks detailed in the Company’s filings with the U.S. Securities and Exchange Commission, including this Annual Report on Form 10-K, all of which are difficult to predict and many of which are beyond the Company’s control.
 
Overview

The following discussion and analysis of our financial results, as well as the accompanying consolidated financial statements and related notes to consolidated financial statements to which they refer, are the responsibility of the management of the Company.  Our accounting and financial reporting fairly reflect our business model involving the manufacturing and marketing of petrochemical products and specialty waxes.  Our business model involves the manufacture and sale of tangible products and providing custom processing services.  Our consistent approach to providing high purity products and quality services to our customers has helped to sustain our current position as a preferred supplier of various petrochemical products.

Business Environment and Risk Assessment

We believe we are well-positioned to participate in new investments to grow the Company.  While petrochemical prices are volatile on a short-term basis and depend on the demand of our customers’ products, our investment decisions are based on our long-term business outlook using a disciplined approach in selecting and pursuing the most attractive investment opportunities.

Petrochemical Operations

Worldwide petrochemical demand improved during 2015, and we benefitted from continued operational excellence and competitive advantages achieved through our business mix and focus on producing high quality products and outstanding customer service.

During 2015 feedstock prices continued the decline which began in the fourth quarter of 2014.  Average price fell $0.46 per gallon from end of year 2014 to end of year 2015.  Typically, during falling prices we experience better margins since almost 60% of our selling prices are on formula pricing which follows market prices calculated upon the prior month.

Specialty Wax Operations

Key applications for polyolefin waxes are in hot melt adhesives (HMA), plastic processing, PVC lubricants, inks, paints and coatings, where they act as surface or rheology modifiers. The HMA market is expected to grow at a higher rate than GDP growth due to growth in the developing markets and increases in packaging requirements due to changes in consumer purchasing (shift to home deliveries via the internet) in developed economies. Road marking paints are also expected to grow at rates exceeding GDP growth in developed economies due to new infrastructure build-outs.  New construction and upgrades to the existing water network should encourage the PVC market to grow at GDP growth rates. Global demand for polyethylene and polypropylene waxes, our target market, is expected to grow to around 2 billion pounds globally by 2020. We expect to penetrate a larger percentage of the market with our enhanced quality product by giving customers an alternative to synthetic Fischer-Tropsch waxes.


20


Liquidity and Capital Resources

Working Capital

Our approximate working capital days are summarized as follows:

   
December 31, 2015
   
December 31, 2014
   
December 31, 2013
 
Days sales outstanding in accounts receivable
    29.4       35.6       34.1  
Days sales outstanding in inventory
    23.8       16.1       18.6  
Days sales outstanding in accounts payable
    12.2       12.0       11.4  
Days of working capital
    41.0       39.8       41.4  

Our days sales outstanding in accounts receivable decreased from 2014 to 2015 due to decreases in deferred sales revenue and increased from 2013 to 2014 due to increases in deferred sales revenue.  Deferred sales revenue decreased by approximately $1.4 million from 2014 to 2015 and increased by approximately $0.4 million from 2013 to 2014.  Deferred sales are not recognized until the customer accepts delivery of the product and title has transferred.  The majority of these sales are to foreign customers with longer payment terms due to increased shipping times.

Our days sales outstanding in inventory increased from 2014 to 2015 due to additional inventory on hand at TC.  Due to TC’s primary raw material supplier being required to sell additional material, TC chose to purchase that material rather than it being sold to a competitor.  This significantly increased TC’s inventory because of the additional production from that raw material.

Sources and Uses of Cash

Cash and cash equivalents increased by $10.1 million during the year ended December 31, 2015.  The change in cash and cash equivalents is summarized as follows:

   
2015
   
2014
   
2013
 
Net cash provided by (used in)
 
(in thousands)
 
  Operating activities
  $ 39,565     $ 23,205     $ 13,242  
  Investing activities
    (31,294 )     (88,942 )     (12,702 )
  Financing activities
    1,846       66,635       (2,440 )
Increase (decrease) in cash and equivalents
  $ 10,117     $ 898     $ (1,900 )
Cash and cash equivalents
  $ 18,623     $ 8,506     $ 7,608  

Operating Activities

Operating activities generated cash of $39.6 million during fiscal 2015 as compared with $23.2 million of cash provided during fiscal 2014.  The Company’s net income increased by $3.0 million from 2014 to 2015 and cash provided by operations increased by $16.4 million due primarily to the following factors:

·  
Net income for 2015 included a non-cash equity in loss from AMAK of $5.3 million as compared to equity in loss from AMAK $1.1 million in 2014;

·  
Net income for 2015 included a non-cash depreciation and amortization charge of $9.1 million (due to the incorporation of TC’s charges for a full year) as compared to 2014 which included a charge of $5.7 million (included only one quarter of TC’s charges);

·  
Net income for 2015 included a non-cash deferred income tax charge of $5.6 million as compared to 2014 which included a deferred income tax benefit of $1.9 million;

·  
Trade receivables decreased approximately $8.8 million in 2015 (due to a 27.1% decrease in the average per gallon selling price) as compared to an increase of approximately $3.4 million in 2014 (due to  a 9.9% increase in volume sold during the fourth quarter and receivables acquired from the Acquisition);

·  
Prepaid expenses and other assets decreased $1.2 million in 2015 (primarily due to expensing of loan fees and disbursement of the prepayment of a lawsuit settlement) as compared to an increase of  $1.4 million in 2014 (primarily due to prepaid loan fees associated with the debt from the Acquisition, prepayment of a lawsuit settlement, and prepaids acquired from the Acquisition); and


21

 
·  
Other liabilities increased $2.2 million in 2015 (due to customer funding of capital projects for custom processing) as compared to an increase of $0.1 million in 2014 (due to deferred revenue acquired from the Acquisition offset by recognition of deferred revenue during 2014).

These significant sources of cash were partially offset by the following decreases in cash provided by operations:

·  
Income tax receivable increased $7.2 million in 2015 (primarily due to estimated tax payments being made prior to the update of tax laws passed in December 2015) as compared to a decrease of $0.1 million in 2014;
 
 
·  
Inventory increased $3.0 million in 2015 (due to TC’s increase in raw material receipts from their primary supplier which translated into additional finished goods production) as compared to a decrease of $2.6 million in 2014 (due to a 31.9% decrease in cost per gallon); and

·  
Accounts payable and accrued liabilities decreased $2.4 million in 2015 (primarily due to construction projects being completed during the year) as compared to an increase of $1.8 million in 2014 (primarily due to the working capital adjustment payable for the Acquisition).

Operating activities generated cash of $23.2 million during fiscal 2014 as compared with $13.2 million of cash provided during fiscal 2013.  Although the Company’s net income decreased by $3.9 million from 2013 to 2014, the cash provided by operations increased by $10.0 million due primarily to the following factors:

·  
Net income for 2014 included a non-cash equity in loss from AMAK of $1.1 million as compared to equity in earnings from AMAK $4.7 million and gain on equity issued in AMAK of $4.0 million in 2013;

·  
Net income for 2014 included a non-cash depreciation and amortization charge of $5.7 million as compared to 2013 which included a non-cash depreciation charge of $4.0 million;

·  
Net income for 2014 included a non-cash share-based compensation charge of $2.1 million as compared to 2013 which included a non-cash share-based compensation charge of $1.2 million;

·  
Trade receivables increased approximately $3.4 million in 2014 (due to  a 9.9% increase in volume sold during the fourth quarter and receivables acquired from the Acquisition) as compared to an increase of approximately $6.3 million (due to a 40.1% increase in volume sold during the fourth quarter) in 2013;

·  
Inventory decreased approximately $2.6 million in 2014 (due to a 31.9% decrease in cost per gallon) as compared to an increase of approximately $2.2 million (due to a 58.8% increase in deferred sales) in 2013; and
·  
Accounts payable and accrued liabilities increased $1.8 million in 2014 (primarily due to the working capital adjustment payable for the Acquisition) as compared to an increase of $1.4 million (primarily due to an increase in the accrual for raw materials) in 2013.

These significant sources of cash were partially offset by the following decreases in cash provided by operations:

·  
Net income for 2014 included non-cash deferred income tax benefits of $1.9 million as compared to charges of $1.5 million in 2013;

·  
Prepaid expenses and other assets increased $1.4 million in 2014 (primarily due to prepaid loan fees associated with the debt from the Acquisition, prepayment of a lawsuit settlement, and prepaids acquired from the Acquisition) as compared to an increase of $1.0 million in 2013 (primarily due to an increase in prepaid insurance and notes receivable from processing customers); and

·  
Other liabilities increased $0.1 million in 2014 (due to deferred revenue acquired from the Acquisition offset by recognition of deferred revenue during 2014) as compared to an increase of $3.0 million in 2013 (due to the receipt of funds from toll processing customers for modifications of toll processing facilities within the plant).

 
22


Investing Activities

Cash used by investing activities during fiscal 2015 was approximately $31.3 million, representing a decrease of approximately $57.6 million over the corresponding period of 2014.  The majority of the decrease was due to the 2014 Acquisition for $74.8 million, net of $0.1 million in cash acquired as discussed in Note 3.  During 2015 we expended $13.3 million on the D-train expansion, $1.8 million on tank farm improvements, $0.6 million on spare equipment, $2.8 on pipeline upgrades, $1.5 million on transportation equipment, $2.2 million on the Oligomerization project (costs fully paid by the customer), $2.1 million on the hydrogenation project, $1.3 million on a wax stripping column, and $5.6 million on various plant improvements and equipment.

Cash used by investing activities during fiscal 2014 was approximately $88.9 million, representing an increase of approximately $76.2 million over the corresponding period of 2013.  The majority of the increase was due to the Acquisition for $74.8 million, net of $0.1 million in cash acquired as discussed in Note 3.  During 2014 we also expended $6.8 million on the D-train expansion, $0.9 million on tank farm improvements, $2.4 million on spare equipment, $0.3 on pipeline upgrades, and $4.4 million on various plant improvements and equipment.

Financing Activities

Cash provided by financing activities during fiscal 2015 was approximately $1.8 million versus cash provided of $66.6 million during the corresponding period of 2014.  During 2015 we made principal payments of $7.0 million on our term debt and $6.2 million on our line of credit.  We drew $15.0 million on our term debt at year end 2015 to pre-fund the new reformer project approved for 2016 since borrowing availability for that particular financing was set to expire on December 31, 2015.

Cash provided by financing activities during fiscal 2014 was approximately $66.6 million versus cash used of $2.4 million during the corresponding period of 2013.  During 2014 we entered into an amended and restated loan agreement with the bank as discussed in Note 12 for the Acquisition, financing for the D-train expansion and a working capital line.  We also made principal payments of $9.2 million on our term debt and $11.5 million on our line of credit.

Credit Agreement

On October 1, 2014, TOCCO, SHR, GSPL, and TC (SHR, GSPL and TC collectively the “Guarantors”) entered into an Amended and Restated Credit Agreement (“ARC Agreement”) with the lenders which from time to time are parties to the ARC Agreement (collectively, the “Lenders”) and Bank of America, N.A., a national banking association, as Administrative Agent for the Lenders, and Merrill Lynch, Pierce, Fenner & Smith Incorporated as Lead Arranger.

Subject to the terms and conditions of the ARC Agreement, TOCCO may (a) borrow, repay and re-borrow revolving loans (collectively, the “Revolving Loans”) from time to time during the period ending September 30, 2019, up to but not exceeding at any one time outstanding $40.0 million (the “Revolving Loan Commitment”) and (b) request up to $5.0 million of letters of credit and $5.0 million of swingline loans.  Each of the issuance of letters of credit and the advance of swingline loans shall be considered usage of the Revolving Loan Commitment.  All outstanding loans under the Revolving Loans must be repaid on October 1, 2019.  As of December 31, 2015, TOCCO had outstanding borrowings under the Revolving Loans aggregating $1.0 million.

Under the ARC Agreement, TOCCO also borrowed $70.0 million in a single advance term loan (the “Acquisition Term Loan”) to partially finance the Acquisition.  As of December 31, 2015, TOCCO had outstanding borrowings under the Acquisition Term Loan aggregating $61.3 million.

Under the ARC Agreement, TOCCO also has the right to borrow $25.0 million in a multiple advance loan (the “Term Loans,” together with the Revolving Loans and Acquisition Term Loan, collectively the “Loans”).  Borrowing availability under the Term Loans ended on December 31, 2015.  The Term Loans convert from a multiple advance loan to a “mini-perm” loan once TOCCO has fulfilled certain obligations such as certification that construction of D-Train was completed in a good and workmanlike manner, receipt of applicable permits and releases from governmental authorities, and receipt of releases of liens from the contractor and each subcontractor and supplier.  The Loans also include a $40,000,000 uncommitted increase option (the “Accordion Option”).  As of December 31, 2015, TOCCO had borrowed funds under this agreement aggregating $20.0 million.

 
23

 
All of the Loans under the ARC Agreement will accrue interest at the lower of (i) a London interbank offered rate (“Eurodollar Rate”) plus a margin of between 2.00% and 2.50% based on the total leverage ratio of TOCCO and its subsidiaries on a consolidated basis, or (ii) a base rate (“Base Rate”) equal to the highest of the federal funds rate plus 0.50%, the rate announced by Bank of America, N.A. as its prime rate, and Eurodollar Rate plus 1.0%, plus a margin of between 1.00% to 1.50% based on the total leverage ratio of TOCCO and its subsidiaries on a consolidated basis.  The Revolving Loans will accrue a commitment fee on the unused portion thereof at a rate between 0.25% and 0.375% based on the total leverage ratio of TOCCO and its subsidiaries on a consolidated basis.  Interest on the Revolving Loans will be payable quarterly, with principal due and payable at maturity.  Interest on the Acquisition Term Loan became payable quarterly using a ten year commercial style amortization, commencing on December 31, 2014.  The Acquisition Term Loan was also payable as to principal beginning on December 31, 2014, and continuing on the last business day of each March, June, September and December thereafter, each payment in an amount equal to $1,750,000, provided that the final installment on the September 30, 2019, maturity date shall be in an amount equal to the then outstanding unpaid principal balance of the Acquisition Term Loan.  Interest on the Term Loans will be payable quarterly using a fifteen year commercial style amortization, with interest only through December 31, 2015, and principal payments to commence March 31, 2016.  Interest on the Loans will be computed (i) in the case of Base Rate Loans, on the basis of a 365-day or 366-day year, as the case may be, and (ii) in the case of Eurodollar Rate Loans, on the basis of a 360-day year, in each case for the actual number of days elapsed in the period during which it accrues.

The Loans may be prepaid in whole or in part without premium or penalty (Eurodollar Rate Loans are prepayable only on the last days of related interest periods or upon payment of any breakage costs) and the lenders’ commitments relative thereto reduced or terminated.  Subject to certain exceptions and thresholds, outstanding Loans shall be prepaid by an amount equal to 100% of the net cash proceeds from: (i) all sales, transfers, licenses, lease or other disposition of any property by TOCCO and Guarantors (other than a permitted transfer); (ii) any equity issuance by TOCCO or the Guarantors; (iii) any debt issuance by TOCCO or the Guarantors; or (iv) the receipt of any cash received by TOCCO or the Guarantors not in the ordinary course of business.  Amounts prepaid in connection with the mandatory repayments described above will be applied first, to the principal repayment installments of the Acquisition Term Loan in inverse order of maturity, second, to the principal repayment installments of the Term Loans in inverse order of maturity and, third, to the Revolving Loans in the manner set forth in the Amended and Restated Credit Agreement.

All amounts owing under the ARC Agreement and all obligations under the guarantees will be secured in favor of the Lenders by substantially all of the assets of TOCCO and its subsidiaries and guaranteed by its subsidiaries.

The ARC Agreement contains, among other things, customary covenants, including restrictions on the incurrence of additional indebtedness, the granting of additional liens, the making of investments, the disposition of assets and other fundamental changes, the transactions with affiliates and the declaration of dividends and other restricted payments.  The ARC Agreement also includes the following financial covenants, each tested on a quarterly basis for TOCCO and its subsidiaries on a consolidated basis: a maximum total leverage ratio of 3.25 to 1, a minimum fixed charge coverage ratio of 1.25 to 1, and an asset coverage test of greater than 1.1 to 1.  The ARC Agreement further includes customary representations and warranties and events of default, and upon occurrence of such events of default the outstanding obligations under the ARC Agreement may be accelerated and become immediately due and payable and the commitment of the Lenders to make loans under the ARC Agreement may be terminated.  TOCCO was in compliance with all covenants at December 31, 2015.

Our average floating interest rate on debt outstanding under our credit facility at December 31, 2015, was 2.42%.

Anticipated Cash Needs

We believe that the Company is capable of supporting its operating requirements and capital expenditures through internally generated funds supplemented with borrowings under our credit facility.

Results of Operations

Comparison of Years 2015, 2014, 2013

The tables containing financial and operating information set forth below are presented to facilitate the discussion of the results of operations, and should not be considered a substitute for, and should be read in conjunction with, the audited consolidated financial statements.

 
24

 
Specialty Petrochemical Segment

   
2015
   
2014
   
Change
   
%Change
 
   
(in thousands)
       
Petrochemical Product Sales
  $ 212,431     $ 277,623     $ (65,192 )     (23.5 %)
Processing
    5,802       6,722       (920 )     (13.7 %)
Gross Revenue
  $ 218,233     $ 284,345     $ (66,112 )     (23.3 %)
                                 
Volume of petrochemical sales (thousand gallons)
    86,908       82,785       4,123       5.0 %
                                 
Cost of Sales
  $ 163,088     $ 238,455     $ (75,367 )     (31.6 %)
Total Operating Expense*
    54,299       52,275       2,024       3.9 %
Natural Gas Expense*
    4,190       6,362       (2,172 )     (34.1 %)
Operating Labor Costs*
    13,764       12,238       1,526       12.5 %
Transportation Costs*
    24,836       23,176       1,660       7.2 %
General & Administrative Expense
    11,453       12,330       (877 )     (7.2 %)
Depreciation**
    4,484       4,064       420       10.4 %
                                 
Capital Expenditures
  $ 24,358     $ 13,987       10,371       74.1 %
*Included in cost of sales
**Includes $3,872 and $3,523 for 2015 and 2014 which is included in cost of sales and operating expenses

   
2014
   
2013
   
Change
   
%Change
 
   
(in thousands)
       
Petrochemical Product Sales
  $ 277,623     $ 230,643     $ 46,980       20.4 %
Processing
    6,722       5,584       1,138       20.4 %
Gross Revenue
  $ 284,345     $ 236,227     $ 48,118       20.4 %
                                 
Volume of petrochemical sales (thousand gallons)
    82,785       67,066       15,719       23.4 %
                                 
Cost of Sales
  $ 238,455     $ 201,064     $ 37,391       18.6 %
Total Operating Expense*
    52,275       44,158       8,117       18.4 %
Natural Gas Expense*
    6,362       5,204       1,158       22.3 %
Operating Labor Costs*
    12,238       10,624       1,614       15.2 %
Transportation Costs*
    23,176       18,398       4,778       26.0 %
General & Administrative Expense
    12,330       10,971       1,359       12.4 %
Depreciation**
    4,064       4,039       25       0.6 %
                                 
Capital Expenditures
  $ 13,987     $ 6,828     $ 7,159       104.8 %
*Included in cost of sales
**Includes $3,523 and $3,518 for 2014 and 2013 which is included in cost of sales and operating expenses

Gross Revenue

2014-2015

Revenues decreased from 2014 to 2015 by 23.3% primarily due to a decrease in the average selling price per gallon of 27.1% and a decrease in processing fees of 13.7%.

2013-2014

Revenues increased from 2013 to 2014 by approximately 20.4% primarily due to an increase in sales volume of 23.4% and an increase in processing fees of 20.4%.

Petrochemical Product Sales

2014-2015

Petrochemical product sales revenue decreased 23.5% from 2014 to 2015 due to a decrease in the average selling price of 27.1%.  We saw a significant decline in raw material prices beginning in the fourth quarter of 2014 which continued
 
 
25


throughout 2015.  Since our selling prices are based on raw material prices, they declined as well.  Deferred sales volume remained steady from 2014 to 2015; however, deferred sales revenue declined 19.8% due to the decrease in the average selling price.  Foreign sales volume accounted for approximately 25.2% of volume and 27.9% of revenue for petrochemical product sales during 2015 as compared to 27.7% of volume and 30.8% of revenue during 2014.

2013-2014

Petrochemical product sales increased 20.4% from 2013 to 2014 due to an increase in total sales volume of 23.4% while average selling price declined slightly by 2.5%.  We saw a significant decline in raw material prices during the fourth quarter of 2014 which caused our average selling price for the year to decline.  Deferred sales volume increased 12.6% from the end of 2013 to 2014 which delayed recognition until 2015.

Processing

2014-2015

Processing revenues decreased 13.7% from 2014 to 2015 due to lower run rates being required by our customers.

2013-2014

Processing revenues increased 20.4% from 2013 to 2014 due to the continued benefit from renegotiated contacts.
We remain dedicated to maintaining a certain level of toll processing business in the facility and continue to pursue opportunities.

Cost of Sales (includes but is not limited to raw materials, total operating expense, natural gas, operating labor and transportation)

2014-2015

Cost of Sales decreased 31.6% from 2014 to 2015 due primarily to a 46.9% decrease in the average cost per gallon of raw material.  This was offset slightly by higher raw material volumes being processed in order to support the 5.0% increase in sales volume.  Our raw material composition fluctuated during the year.  We use natural gasoline as feedstock which is the heavier liquid remaining after butane and propane are removed from liquids produced by natural gas wells.  The material is a commodity product in the oil/petrochemical markets and generally is readily available.  We continue to investigate alternative feedstock sources which contain lower percentages of less desirable components in an effort to reduce the amount of byproduct sold into secondary markets at lower margins, thereby increasing overall profitability.

2013-2014

Cost of Sales increased 18.6% from 2013 to 2014 due in part to a 19.4% increase in volumes processed to support the increase in sales volume slightly offset by a 4.4% decrease in the average cost per gallon of raw material.

Total Operating Expense (includes but is not limited to natural gas, operating labor and transportation)

2014-2015

Total Operating Expense increased 3.9% from 2014 to 2015.  Natural gas, labor and transportation are the largest individual expenses in this category; however, not all of these increased.

The cost of natural gas purchased decreased 34.1% from 2014 to 2015 due to a decrease in the average per unit cost and lower volume used.  The average price per MMBTU for 2015 was $2.94 whereas, for 2014 the average per unit cost was $4.49.  Volume consumed decreased to approximately 1,402,000 MMBTU from about 1,417,000 MMBTU.

Operating labor costs were higher by 12.5% mainly due to a cost of living adjustment that was given mid-year 2015, additional profit sharing distributions based upon profitability, and an increase in our employee count for the petrochemical segment.  Employee count increased approximately 9.5% from year end 2014 to year end 2015 as support for the D-train expansion and in preparation for construction of the new reformer unit.

 
26

 
Transportation costs were higher by 7.2% primarily due to an increase in rail freight which includes car rental.  The number of cars in our rail fleet remained significant during 2015 in support of our oil sands customer.  As we approached year end, we began trading some of the smaller railcars which were on lease for larger railcars which are more acceptable to our customers.  These costs are typically recovered through our selling price.  Higher transportation costs accounted for 82.0% of the increase in operating expense.

2013-2014

Total Operating Expense increased 18.4% from 2013 to 2014.  Natural gas, labor and transportation are the largest individual expenses in this category.

The cost of natural gas purchased increased 22.3% from 2013 to 2014 due to an increase in the average per unit cost and additional volume used.  The average price per MMBTU for 2014 was $4.49 whereas, for 2013 the average per unit cost was $3.89.  Volume consumed increased to approximately 1,417,000 MMBTU from about 1,342,000 MMBTU.

Operating labor costs were higher by 15.2% mainly due to a cost of living adjustment that was given mid-year 2014, additional profit sharing distributions based upon profitability, and an increase in our employee count for the petrochemical segment.  Employee count increased approximately 33% from year end 2013 to year end 2014 as construction for the D-train expansion was underway.

Transportation costs were higher by 26.0% primarily due to an increase in rail freight.  We increased our rail fleet by 25.5%, and shipments increased by 32.5%. These costs are typically recovered through our selling price.  Higher transportation costs accounted for 58.9% of the increase in operating expense.

General and Administrative Expense

2014-2015

General and Administrative costs decreased from 2014 to 2015 due primarily to management expenses being recorded at the corporate level instead of at the petrochemical level and a decrease in consulting fees.  During 2014 consulting fees were higher than normal due to costs associated with the Acquisition.

2013-2014

General and Administrative costs increased from 2013 to 2014 due primarily to expenses recorded for administrative payroll costs, 401(k) contributions, insurance premiums, consulting fees, legal fees and property taxes. Payroll costs increased approximately $0.4 million due to a cost of living adjustment, increased profit sharing distributions, and an increase in personnel.  Group health insurance premiums increased 8.2% due to the health insurance environment and an increase in personnel.   Property insurance premiums increased 4.7% due to an increase in the insured basis.  Consulting fees increased $0.5 million due to the hiring of consultants to assist with the Acquisition.  Property taxes increased 11.8% due to the increase in the taxable basis because of recent expansions and additions.
 
 
Depreciation

2014-2015

Depreciation expense increased 11.0% from 2014 to 2015 primarily due to D-train coming online during the fourth quarter of 2015.

2013-2014

Depreciation expense increased only slightly by 0.6% from 2013 to 2014.  Many of the capital expenditures for 2014 remained in construction in progress accounts at year end.


27


Capital Expenditures

2014-2015

Capital expenditures increased 74.1% from 2014 to 2015. See discussion under “Capital Resources and Requirements” below for more detail.

2013-2014

Capital expenditures increased 104.8% from 2013 to 2014. See discussion under “Capital Resources and Requirements” below for more detail.

Specialty Wax Segment

Due to the Acquisition on October 1, 2014, the following table only includes fourth quarter 2014 results as compared to full year 2015; therefore, no variances are displayed or explained.

   
2015
   
2014
 
Product Sales
  $ 15,506     $ 3,242  
Processing
    8,237       2,056  
Gross Revenue
    23,743       5,298  
                 
Cost of Sales*
    19,519       5,444  
General & Administrative Expense
    4,138       958  
Depreciation
    4,550       1,612  
                 
Capital Expenditures
  $ 6,889     $ 780  
                      *includes depreciation and amortization of $4,464 and $1,122, respectively

Capital expenditures for 2015 include $2.2 million on the Oligomerization project (cost fully paid for by the customer), $2.1 million on the hydrogenation project, and $1.3 million on a wax stripping column.

Corporate Segment

   
2015
   
2014
   
Change
   
%Change
 
   
(in thousands)
       
General & Administrative Expense
  $ 7,011     $ 6,413     $ 598       9.3 %
Depreciation
    26       -       26       100.0 %
Equity in earnings (losses) of AMAK
    (5,325 )     (1,072 )     (4,253 )     396.7 %

   
2014
   
2013
   
Change
   
%Change
 
   
(in thousands)
       
General & Administrative Expense
  $ 6,413     $ 3,701     $ 2,712       42.3 %
Equity in earnings(losses) of AMAK
    (1.072 )     4,703       (5.775 )     (122.8 %)
Gain from additional equity issuance by AMAK
  $ -     $ 13,987       (3,997 )     (100.0 %)

General and Administrative Expenses

2014-2015

General corporate expenses increased from 2014 to 2015 primarily due to increases in officer compensation which were re-classed from the petrochemical company, directors’ fees and accounting fees offset by decreases in consulting fees and investor relations expenses.  Directors’ fees increased approximately $208,000 because of the addition of one director and reassessment of directors’ compensation during 2015.  Accounting fees increased due to costs associated with the Acquisition.  Consulting fees decreased $0.5 million due to the hiring of consultants for the Acquisition during 2014 and investor relations fees decreased $0.1 million due to a change in our investor relations firm.


28

 
2013-2014

General corporate expenses increased from 2013 to 2014 primarily due to increases in officer compensation, consulting fees, insurance expense, and administrative expenses in Saudi Arabia.  Officer compensation increased $2.0 million due to the award of options and an increase in the executive bonus based upon 2014 performance.  Consulting fees increased $0.6 million due to the hiring of consultants for the Acquisition.  Administrative expenses in Saudi Arabia increased $0.1 million due to additional staffing requirements.

Equity in Earnings (Losses) of AMAK/Gain on Equity Issuance of AMAK

2014-2015

Equity in Losses of AMAK increased 396.7% from 2014 to 2015 due to a number of reasons as discussed below.

AMAK’s performance, like the rest of the mining sector, was severely impacted by the continued fall in metal demand and prices (average spot prices for zinc and copper in fourth quarter 2015 were down approximately 13% and 7%, respectively, compared to third quarter 2015).  The mine also suffered from significant raw material outages and operating inefficiencies.

Shipments decreased 7.4% from 2014 to 2015 as indicated in the table below.  There was one shipment of zinc in the first quarter, one shipment of copper in the second quarter, one shipment of copper and two shipments of zinc in the third quarter and one shipment of copper (to two customers) in the fourth quarter.  AMAK volumes in dry metric tons (dmt) for 2015 and 2014 were as follows:

   
2015
   
2014
   
Variance
 
 
Ore tons processed
    591,419       670,812       (79,393 )
 
Concentrate to the port
                       
  Copper
    24,218       28,402       (4,184 )
  Zinc
    35,447       32,515       2,932  
      59,665       60,917       (1,252 )
                         
Shipments
                       
   Copper
    26,378       25,691       687  
   Zinc
    24,547       29,326       (4,779 )
      50,925       55,017       (4,092 )

In November 2015 the decision was made to temporarily close the mine and to terminate the contract with the operator.  This allows AMAK to preserve asset value while the mill and underground assets are returned to their original condition and equipment upgrades are installed.

Renovation work began at the AMAK facility in December 2015 with zinc and copper production expected to resume in the fourth quarter of 2016.  During the renovation, AMAK’s focus remains on improving recoveries overall and upgrading the precious metals circuit through the installation of SART modifications which should lower chemical use; thereby, reducing operating costs once processing resumes.  In addition, processing of the gold-bearing waste dumps from historical mining at the newly acquired Guyan mining license area are also scheduled to begin in the fourth quarter of 2016.  An exploration program for the rest of Guyan mining lease will commence shortly, along with a systematic program of infill drilling to extend the overall life of the copper and zinc mine.

The renovation work at AMAK is proceeding on schedule and installation of new equipment is expected to finish early in the fourth quarter of 2016.  We believe that AMAK has sufficient capital to complete the planned improvements.  AMAK will self-operate the mine after start-up and has signed a manpower agreement with a Turkish company that will provide greater technical know-how and required management skills in combination with significant cost savings.


29


2013-2014

Equity in Earnings (Losses) of AMAK decreased 122.8% from 2013 to 2014.  Our equity in AMAK’s results of operations for 2013 also included a gain from the additional equity issuance by AMAK of $4.0 million.  There was no such gain in 2014.

Shipments decreased by 26.0% from 2013 to 2014 as indicated in the table below.  There were no shipments in the first quarter of 2014 due to logistics delays and the rebuilding of warehouse stocks.  Shipments in the second quarter of 2014, while up in number (4), were limited by volume shipped.  Shipments in the third and fourth quarters were also limited by volume shipped.  AMAK volumes in dry metric tons (dmt) for 2014 and 2013 were as follows:

   
2014
   
2013
   
Variance
 
 
Ore tons processed
    670,812       699,316       (28,504 )
 
Concentrate to the port
                       
  Copper
    28,402       36,722       (8,320 )
  Zinc
    32,515       35,685       (3,170 )
      60,917       72,407       (11,490 )
                         
Shipments
                       
   Copper
    25,691       35,908       (10,217 )
   Zinc
    29,326       38,430       (9,104 )
      55,017       74,338       (19,321 )

Capital Resources and Requirements

2014-2015

Capital expenditures increased 74.1% from 2014 to 2015.  During 2015 we expended $13.3 million on the D-train expansion, $1.8 million on tank farm improvements, $0.6 million on spare equipment, $2.8 on pipeline upgrades, $1.5 million on transportation equipment, $2.2 million on the Oligomerization project (costs fully paid by the customer), $2.1 million on the hydrogenation project, $1.3 million on a wax stripping column, and $5.6 million on various plant improvements and equipment.

2013-2014

Capital expenditures increased 104.8% from 2013 to 2014.  During 2014 we expended $6.8 million to begin construction on our D-train expansion, $2.4 million to purchase spare equipment for future use, $0.9 million for tank farm improvements, $1.9 million for various plant upgrades, $0.6 million for a new warehouse and building improvements, $0.5 million for loading rack expansion capabilities, and $.3 million for pipeline upgrades.

Capital expenditures typically average $7.0 million per year for facility improvements.  At December 31, 2015, there was $39.0 million available on the Company’s line of credit.  We believe that operating cash flows along with credit availability will be sufficient to finance our 2016 operations and capital expenditures.

The table below summarizes the following contractual obligations of the Company:

   
Payments due by period
 
Contractual Obligations
 
Total
   
Less than 1 year
   
1-3 years
   
3-5 years
   
More than 5 years
 
   
(thousands of dollars)
 
Operating Lease Obligations
  $ 13,846     $ 3,309     $ 4,667     $ 3,805     $ 2,065  
Long-Term Debt Obligations
    82,250       8,333       16,667       57,250       -  
Total
  $ 96,096     $ 11,642     $ 21,334     $ 61,055     $ 2,065  

The anticipated source of funds for payments due within three years that relate to contractual obligations is from a combination of continuing operations and long-term debt refinancing.


30

 
Investment in AMAK

Information concerning our investment in AMAK is set forth in Note 10 of the Notes to Consolidated Financial Statements.

New Accounting Standards

In May 2014 the Financial Accounting Standards Board ("FASB") issued Accounting Standards Update ("ASU") 2014-09, Revenue from Contracts with Customers ("ASU 2014-09"). ASU 2014-09 supersedes the revenue recognition requirements of FASB Accounting Standards Codification ("ASC") Topic 605, Revenue Recognition and most industry-specific guidance throughout the Accounting Standards Codification, resulting in the creation of FASB ASC Topic 606, Revenue from Contracts with Customers. ASU 2014-09 requires entities to recognize revenue in a way that depicts the transfer of promised goods or services to customers in an amount that reflects the consideration to which the entity expects to be entitled to in exchange for those goods or services. This ASU provides alternative methods of retrospective adoption and is effective for fiscal years, and interim periods within those years, beginning after December 15, 2017. Early adoption would be permitted but not before annual periods beginning after December 15, 2016.  The Company is currently assessing the potential impact of adopting this ASU on its consolidated financial statements and related disclosures.

In June 2014 the FASB issued ASU No. 2014-12, Compensation – Stock Compensation (Topic 718): Accounting for Share-Based Payments When the Terms of an Award Provide That a Performance Target Could Be Achieved after the Requisite Service Period. The new standard requires that a performance target that affects vesting, and that could be achieved after the requisite service period, be treated as a performance condition. As such, the performance target should not be reflected in estimating the grant date fair value of the award. This update further clarifies that compensation cost should be recognized in the period in which it becomes probable that the performance target will be achieved and should represent the compensation cost attributable to the periods for which the requisite service has already been rendered. The new standard is effective for fiscal years, and interim periods within those fiscal years, beginning after December 15, 2015 and can be applied either prospectively or retrospectively to all awards outstanding as of the beginning of the earliest annual period presented as an adjustment to opening retained earnings. Early adoption is permitted. The Company is currently assessing the potential impact of adopting this ASU on its consolidated financial statements and related disclosures.

In April 2015 the FASB issued ASU No. 2015-03, Interest - Imputation of Interest (Subtopic 835-30): Simplifying the Presentation of Debt Issuance Costs. The amendments in this ASU 2015-03 require that debt issuance costs related to a recognized debt liability be presented in the balance sheet as a direct deduction from the carrying amount of that debt liability, consistent with debt discounts. The recognition and measurement guidance for debt issuance costs are not affected by the amendments in this ASU 2015-03. In August 2015 the FASB issued ASU No. 2015-15, Interest - Imputation of Interest (Subtopic 835-30): Presentation and Subsequent Measurement of Debt Issuance Costs Associated with Line-of-Credit Arrangements - Amendments to SEC Paragraphs Pursuant to Staff Announcement at June 18, 2015 EITF Meeting. ASU 2015-15 was issued to address presentation or subsequent measurement of debt issuance costs related to line-of-credit arrangements that were not found ASU 2015-03.   Given the absence of authoritative guidance within ASU 2015-03 for debt issuance costs related to line-of-credit arrangements, the SEC staff would not object to an entity deferring and presenting debt issuance costs as an asset and subsequently amortizing the deferred debt issuance costs ratably over the term of the line-of-credit arrangement, regardless of whether there are any outstanding borrowings on the line-of-credit arrangement. These standards are effective for fiscal years, and interim periods within those fiscal years, beginning after December 15, 2015, and should be applied retrospectively.  Early adoption is permitted. The Company is currently assessing the potential impact of adopting ASU 2015-03 and ASU 2015-15 on its consolidated financial statements and related disclosures.

In November 2015 the FASB issued ASU No. 2015-17, Income Taxes (Topic 740): Balance Sheet Classification of Deferred Taxes. The new standard eliminates the current requirement for organizations to present deferred tax liabilities and assets as current and noncurrent in a classified balance sheet. Instead, organizations will be required to classify all deferred tax assets and liabilities as noncurrent. The amendments are effective for financial statements issued for annual periods beginning after December 15, 2016, and interim periods within those annual periods. The Company is currently assessing the potential impact of adopting this ASU on its consolidated financial statements and related disclosures.


31

 
In February 2016 the FASB issued ASU No. 2016-02, Leases (Topic 842). The ASU was issued to increase transparency and comparability among organizations by recognizing lease assets and lease liabilities on the balance sheet and disclosing key information about leasing arrangements. This ASU affects any entity that enters into a lease, with some specified scope exemptions. The guidance in this Update supersedes FASB ASC 840, Leases. The amendments in this ASU are effective for fiscal years beginning after December 15, 2018, including interim periods within those fiscal years. The Company is currently assessing the impact of adopting this ASU on its consolidated financial statements and related disclosures.

Critical Accounting Policies

Our consolidated financial statements are based on the selection and application of significant accounting policies.  The preparation of consolidated financial statements in conformity with US GAAP requires management to make estimates and assumptions that affect the reported amounts of assets and liabilities and the reported amounts of net sales, expenses and allocated charges during the reported period.  Actual results could differ from those estimates.  However, we are not currently aware of any reasonably likely events or circumstances that would result in materially different results.

We believe the following accounting policies and estimates are critical to understanding the financial reporting risks present currently. These matters, and the judgments and uncertainties affecting them, are essential to understanding our reported results.  See Note 2 to the Notes to the Consolidated Financial Statements for further information.

Inventories

Finished products and feedstock are recorded at the lower of cost, determined on the last-in, first-out method (LIFO); or market for SHR.  For TC, inventory is recorded at the lower of cost or market as follows:  (1) raw material cost is calculated using the weighted-average cost method and (2) product inventory cost is calculated using the specific cost method.  See Note 7 to the Notes to the Consolidated Financial Statements for more information.

Revenue recognition

Revenue is recorded when (1) the customer accepts delivery of the product and title has been transferred or when the service is performed and we have no significant obligations remaining to be performed; (2) a final understanding as to specific nature and terms of the agreed upon transaction has occurred; (3) price is fixed and determinable; and (4) collection is assured. For our product sales these criteria are generally met, and revenue is recognized, when the product is delivered or title is transferred to the customer.  Sales are presented net of discounts, allowances, and sales taxes.  Freight costs billed to customers are recorded as a component of revenue.  For our custom processing we recognize revenue when the service has been provided to the customer.  Revenues received in advance of future sales of products or prior to the performance of services are presented as deferred revenues.

Long-lived Assets

Long-lived assets are reviewed for impairment whenever events or changes in circumstances indicate that the carrying amount may not be recoverable from estimated future undiscounted cash flows.  If the estimated future undiscounted cash flows are less than the carrying value of the assets, we calculate the amount of impairment if the carrying value of the long-lived assets exceeds the fair value of the assets.    Our long-lived assets include our petrochemical facility and our specialty synthetic wax facility.

Our petrochemical facility and specialty synthetic wax facility are currently our revenue generating assets.  The facilities were in full operation at December 31, 2015.

Goodwill and other intangible assets

Goodwill and indefinite-lived intangible assets are tested for impairment at least annually; however, these tests are performed more frequently when events or changes in circumstances indicate that the asset may be impaired.  Impairment exists when carrying value exceeds fair value.


32

 
Definite-lived intangible assets are being amortized using discounted estimated future cash flows over the term of the related agreements.  We continually evaluate the reasonableness of the useful lives of these assets.  Once these assets are fully amortized, they will be removed from the consolidated balance sheets.

See Note 9 to the Notes to the Consolidated Financial Statements for additional information.

Investment in AMAK

We account for our investment in AMAK using the equity method of accounting under which we record in income our share of AMAK’s income or loss for each period.  The amount recorded is also adjusted to reflect the amortization of certain differences between the basis in our investment in AMAK and our share of the net assets of AMAK as reflected in AMAK’s financial statements. See Note 10 to the Notes to the Consolidated Financial Statements.

We assess our investment in AMAK for impairment when events are identified, or there are changes in circumstances that may have an adverse effect on the fair value of the investment.  We consider recoverable ore reserves and the amount and timing of the cash flows to be generated by the production of those reserves, as well as, recent equity transactions within AMAK.  Factors which may affect carrying value include, but are not limited to, mineral prices, capital cost estimates, equity transactions, the estimated operating costs of any mines and related processing, ore grade and related metallurgical characteristics, the design of any mines and the timing of any mineral production. There are no assurances that we will not be required to take a material write-down of any of our mineral properties.

Environmental Liabilities

Our operations are subject to the rules and regulations of the TCEQ which inspects the facilities at various times for possible violations relating to air, water and industrial solid waste requirements. As noted in Item 1. Business, evidence of groundwater contamination was discovered at SHR in 1993. The recovery process, initiated in 1998, is proceeding as planned and is expected to continue for many years. See Note 15 to the Notes to the Consolidated Financial Statements.

Share-Based Compensation

We expense the cost of employee services received in exchange for an award of equity instruments based on the grant date fair value of such instruments. For options we use the Black-Sholes model to calculate the fair value of the equity instrument on the grant date.  See Note 16 to the Notes to the Consolidated Financial Statements.

Off Balance Sheet Arrangements

Off balance sheet arrangements as defined by the SEC means any transaction, agreement or other contractual arrangement to which an entity unconsolidated with the registrant is a party, under which the registrant has (i) obligations under certain guarantees or contracts, (ii) retained or contingent interest in assets transferred to an unconsolidated entity or similar arrangements, (iii) obligations under certain derivative arrangements, and (iv) obligations arising out of a material variable interest in an unconsolidated entity.  Our guarantee for AMAK’s debt is considered an off balance sheet arrangement.  Please see further discussion under “Investment in AMAK” in Item 1. Business.

Income Taxes

In determining our income tax provision, we assess the likelihood our deferred tax assets will be recovered through future taxable income.  Based on this assessment, a valuation allowance against all or a portion of our deferred tax asset that will, more likely than not, be realized.  If these estimates, assumptions, or actual results of operations change in the future, we may reverse the valuation allowance against deferred tax assets. Income tax liabilities are determined based on judgment and estimates assuming it is more likely than not that the position will be sustained upon examination by a taxing authority.  There are no uncertain income tax positions taken or expected to be taken at January 1, 2007 (adoption date), and at December 31, 2015. See Note 17 to the Notes to the Consolidated Financial Statements.

Derivative Instruments

We use financial commodity agreements to hedge the cost of natural gasoline, the primary source of feedstock, and natural gas used as fuel to operate our plant to manage risks generally associated with price volatility.  The commodity agreements are recorded in our consolidated balance sheets as either an asset or liability measured at fair value. Our
 
 
33

 
commodity agreements are not designated as hedges; therefore, all changes in estimated fair value are recognized in cost of petrochemical product sales and processing in the consolidated statements of income.

On March 21, 2008, SHR entered into a pay-fixed, receive-variable interest rate swap agreement with Bank of America related to the $10.0 million term loan secured by plant, pipeline and equipment. The effective date of the interest rate swap agreement was August 15, 2008, and terminates on December 15, 2017.  The notional amount of the interest rate swap was $2.75 million at December 31, 2015.  We receive credit for payments of variable rate interest made on the term loan at the loan’s variable rates, which are based upon the London InterBank Offered Rate (LIBOR), and pay Bank of America an interest rate of 5.83% less the credit on the interest rate swap.  We had originally designated the interest rate swap as a cash flow hedge under ASC Topic 815 (see Note 22); however, due to the new debt agreements associated with the Acquisition in 2014, we believed that the hedge was no longer entirely effective.  Due to the time required to make the determination and the immateriality of the hedge, we began treating the interest rate swap as ineffective as of October 1, 2014, and the unrealized loss associated with the swap of approximately $378,000 was recognized in the consolidated statement of income.  The fair value of the derivative liability associated with the interest rate swap at December 31, 2015, and 2014 totaled $0.2 million and $0.4 million, respectively.

We assess the fair value of the interest rate swap using a present value model that includes quoted LIBOR rates and the nonperformance risk of the Company and Bank of America based on the Credit Default Swap Market (Level 2 of fair value hierarchy).  See Notes 5 and 22 to the Notes to the Consolidated Financial Statements.

Item 7A. Quantitative and Qualitative Disclosures about Market Risk.

The market risk inherent in our financial instruments represents the potential loss resulting from adverse changes in interest rates, foreign currency rates and commodity prices. Our exposure to interest rate changes results from our variable rate debt instruments which are vulnerable to changes in short term United States prime interest rates. At December 31, 2015, 2014 and 2013, we had approximately $82.3 million, $80.5 million and $13.2 million, respectively, in variable rate debt outstanding. A hypothetical 10% change in interest rates underlying these borrowings would result in annual changes in our earnings and cash flows of approximately $199,000, $215,000 and $30,000 at December 31, 2015, 2014 and 2013, respectively.

We do not view exchange rates exposure as significant and have not acquired or issued any foreign currency derivative financial instruments.

We purchase all of our raw materials, consisting of feedstock and natural gas, on the open market. The cost of these materials is a function of spot market oil and gas prices. As a result, our revenues and gross margins could be affected by changes in the price and availability of feedstock and natural gas. As market conditions dictate, from time to time we engage in various hedging techniques including financial swap and option agreements. We do not use such financial instruments for trading purposes and are not a party to any leveraged derivatives. Our policy on such hedges is to buy positions as opportunities present themselves in the market and to hold such positions until maturity, thereby offsetting the physical purchase and price of the materials.

At the end of 2015, market risk for 2016 was estimated as a hypothetical 10% increase in the cost of natural gas and feedstock over the market price prevailing on December 31, 2015.   Assuming that 2016 total petrochemical product sales volumes stay at the same rate as 2015, the 10% market risk increase will result in an increase in the cost of natural gas and feedstock of approximately $10.6 million in fiscal 2016.

Item 8. Financial Statements and Supplementary Data.

The consolidated financial statements of the Company and the consolidated financial statement schedules, including the report of our independent registered public accounting firm thereon, are set forth beginning on Page F-1.

Item 9. Changes In and Disagreements with Accountants on Accounting and Financial Disclosure.

None

 
34

 
Item 9A.  Controls and Procedures.

(a)  
Disclosure Controls and Procedures.

We maintain disclosure controls and procedures (as defined in Rule 13a-15(e) and 15d-15(e)) under the Securities Exchange Act of 1934, as amended (“Exchange Act”) that are designed to provide reasonable assurance that the information that we are required to disclose in the reports we file or submit under the Exchange Act is recorded, processed, summarized and reported within the time periods specified in the SEC’s rules and forms, and such information is accumulated and communicated to our management, including our Chief Executive Office and Chief Financial Officer, as appropriate, to allow timely decisions regarding required disclosure .  It should be noted that because of inherent limitations, our disclosure controls and procedures, however well designed and operated, can provide only reasonable, and not absolute, assurance that the objective of the disclosure controls and procedures are met.

As required by paragraph (b) of Rules 13a-15 and 15d-15 under the Exchange Act, our Chief Executive Officer,  and Chief Financial Officer have evaluated the effectiveness of our disclosure controls and procedures (as such term is defined in Rules 13a-15(e) and 15d-15(e) under the Exchange Act) as of the end of the period covered by this report.  Based on such evaluation, our Chief Executive Officer and Chief Financial Officer have concluded, as of the end of the period covered by this report, that our disclosure controls and procedures were effective at a reasonable assurance level to ensure that the information that we are required to disclose in the reports we file or submit under the Exchange Act is recorded, processed, summarized and reported within the time periods specified in SEC rules and forms and such information is accumulated and communicated to our management, including our Chief Executive Officer and Chief Financial Officer as appropriate, to allow timely decisions regarding required disclosure.

(b)  
Management’s Annual Report on Internal Control over Financial Reporting.

Our management is responsible for establishing and maintaining adequate internal control over financial reporting.  Our internal control over financial reporting is a process that is designed under the supervision of our Chief Executive Officer and Chief Financial Officer, and effected by our Board of Directors, management and other personnel, to provide assurance regarding the financial reporting and the preparation of the financial statements for external purposes in accordance with accounting principles generally accepted in the United States.  Our internal control of financial reporting includes those policies and procedures that:

·  
Pertain to the maintenance of records that, in reasonable detail, accurately and fairly reflect the transactions and dispositions of our assets;
·  
Provide reasonable assurance that transactions are recorded as necessary to permit preparation of financial statements in accordance with accounting principles generally accepted in the United States, and that receipts and expenditures recorded by us are being made only in accordance with authorizations of our management and Board of Directors; and
·  
Provide reasonable assurance regarding prevention or timely detection of unauthorized acquisition, use or disposition of our assets that could have a material effect on our financial statements.

Because of its inherent limitations, internal control over financial reporting may not prevent or detect misstatements.  Also, projections of any evaluation of effectiveness to future periods are subject to the risk that controls may become inadequate because of changes in conditions, or that the degree of compliance with the policies and procedures may deteriorate.

Management has conducted its evaluation of the effectiveness of our internal control over financial reporting as of December 31, 2015, based upon the framework in Internal Control – Integrated Framework (2013) by the Committee of Sponsoring Organizations of the Treadway Commission.  Management’s assessment included an evaluation of the design of our internal control over financial reporting and testing the operating effectiveness of our internal control over financial reporting.  Management reviewed the results of the assessment with the Audit Committee of the Board of Directors.  Based on its assessment and review with the Audit Committee, management concluded that our internal control over financial reporting was effective as of December 31, 2015.
 
 
35

 
(c)  
Attestation Report of the Registered Public Accounting Firm.

BKM Sowan Horan, LLP, an independent registered public accounting firm, has audited the consolidated financial statements included in this Annual Report on Form 10-K and, as part of their audit, has issued their report, included herein, on the effectiveness of our internal control over financial reporting.

(d) Changes in Internal Control over Financial Reporting.
 
There have been no changes in our internal control over financial reporting during the fourth quarter of 2015 that have materially affected, or are reasonable likely to materially affect, our internal control over financial reporting.  From time to time, we make changes to our internal control over financial reporting that are intended to enhance its effectiveness and which do not have a material effect on our overall internal control over financial reporting.

 
36


REPORT OF INDEPENDENT REGISTERED PUBLIC ACCOUNTING FIRM

The Board of Directors and Stockholders
Trecora Resources

We have audited Trecora Resources’ internal control over financial reporting as of December 31, 2015, based on criteria established in Internal Control – Integrated Framework (2013) issued by the Committee of Sponsoring Organizations of the Treadway Commission (COSO). Trecora Resources’ management is responsible for maintaining effective internal control over financial reporting and for its assessment of the effectiveness of internal control over financial reporting, included in the accompanying Management’s Report on Internal Control Over Financial Reporting. Our responsibility is to express an opinion on the Company’s internal control over financial reporting based on our audit.

We conducted our audit in accordance with the standards of the Public Company Accounting Oversight Board (United States). Those standards require that we plan and perform the audit to obtain reasonable assurance about whether effective internal control over financial reporting was maintained in all material respects. Our audit of internal control over financial reporting including obtaining an understanding of internal control over financial reporting, assessing the risk that a material weakness exists, and testing and evaluating the design and operating effectiveness of internal control based on the assessed risk. Our audit also included performing such other procedures as we considered necessary in the circumstances. We believe that our audit provides a reasonable basis for our opinion.

A company’s internal control over financial reporting is a process designed to provide reasonable assurance regarding the reliability of financial reporting and the preparation of financial statements for external purposes in accordance with generally accepted accounting principles. A company’s internal over financial reporting includes those policies and procedures that (1) pertain to the maintenance of records that, in reasonable detail, accurately and fairly reflect the transactions and dispositions of the company; (2) provide reasonable assurance that transactions are recorded as necessary to permit preparation of financial statements in accordance with generally accepted accounting principles, and that receipts and expenditures of the company are being made only in accordance with authorizations of management and directors of the company; and (3) provide reasonable assurance regarding prevention or timely detection of unauthorized acquisition, use, or disposition of the company’s assets that could have a material effect on the financial statements.

Because of its inherent limitations, internal control over financial reporting may not prevent or detect misstatements. Also, projections of any evaluation of effectiveness to future periods are subject to the risk that controls may become inadequate because of changes in conditions, or that the degree of compliance with the policies and procedures may deteriorate.

In our opinion, Trecora Resources maintained, in all material respects, effective internal control over financial reporting as of December 31, 2015, based on the COSO criteria.

We have also audited, in accordance with the standards of the Public Company Accounting Oversight Board (United States), the consolidated balance sheets of Trecora Resources as of December 31, 2015 and 2014 and the related consolidated statements of income, comprehensive income, stockholders’ equity and cash flows for each of the three years in the period ended December 31, 2015, and our report dated March 11, 2016 expressed an unqualified opinion.

/s/ BKM Sowan Horan, LLP
Addison, Texas
March 11, 2016


37


Item 9B.  Other Information.

None

PART III

Item 10. Directors, Executive Officers and Corporate Governance.

Incorporated by reference from our Proxy Statement for our 2016 Annual Meeting of Stockholders to be filed with the SEC within 120 days after the end of the year ended December 31, 2015.

We have adopted a Code of Ethics that applies to the Company’s principal executive officer, principal financial officer, principal accounting officer and controller, and to persons performing similar functions.  A copy of the Code of Ethics has been filed as an exhibit to this Annual Report on Form 10-K and is available on our website.

Item 11.  Executive Compensation.

Incorporated by reference from our Proxy Statement for our 2016 Annual Meeting of Stockholders to be filed with the SEC within 120 days after the end of the year ended December 31, 2015.

Item 12.  Security Ownership of Certain Beneficial Owners and Management and Related Stockholder Matters.

Incorporated by reference from our Proxy Statement for our 2016 Annual Meeting of Stockholders to be filed with the SEC within 120 days after the end of the year ended December 31, 2015.

Item 13. Certain Relationships, Related Transactions, and Director Independence.

Incorporated by reference from our Proxy Statement for our 2016 Annual Meeting of Stockholders to be filed with the SEC within 120 days after the end of the year ended December 31, 2015.

Item 14.  Principal Accounting Fees and Services.

Incorporated by reference from our Proxy Statement for our 2016 Annual Meeting of Stockholders to be filed with the SEC within 120 days after the end of the year ended December 31, 2015.

PART IV

ITEM 15. Exhibits, Financial Statement Schedules.
 
(a)1.    The following financial statements are filed with this Report:
 
Reports of Independent Registered Public Accounting Firm
 
Consolidated Balance Sheets dated December 31, 2015 and 2014
 
Consolidated Statements of Income for the three years ended December 31, 2015
 
Consolidated Statements of Comprehensive Income for the three years ended December 31, 2015
 
Consolidated Statement of Stockholders’ Equity for the three years ended December 31, 2015
 
Consolidated Statements of Cash Flows for the three years ended December 31, 2015
 
Notes to Consolidated Financial Statements

   2.     The following financial statement schedules are filed with this Report:
 
Schedule II -- Valuation and Qualifying Accounts for the three years ended December 31, 2015.
 
   3.  The following financial statements are filed with this Report:
 
 
38

 
The financial statements of Al Masane Al Kobra Mining Company (AMAK) for the years ended December 31, 2015, 2014, and 2013, required by Rule 3-09 of Regulation S-X.
4.  The following documents are filed or incorporated by reference as exhibits to this Report. Exhibits marked with an asterisk (*) are management contracts or a compensatory plan, contract or arrangement.

Exhibit
Number
Description
3(a)
- Certificate of Incorporation of the Company as amended through the Certificate of Amendment filed with the Delaware Secretary of State on May 22, 2014 (incorporated by reference to Exhibit 3(a) to the Company’s Quarterly Report on Form 10-Q for the quarter ended June 30, 2014 (File No. 001-33926))
 
3(b)
- Restated Bylaws of the Company dated August 1, 2014 (incorporated by reference to Exhibit 3(b) to the Company’s Quarterly Report on Form 10-Q for the quarter ended June 30, 2014 (File No. 001-33926))
 
10(a)*
- Retirement Awards Program dated January 15, 2008 between Trecora Resources and Hatem El Khalidi (incorporated by reference to Exhibit 10(h) to the Company’s Quarterly Report on Form 10-Q for the quarter ended March 31, 2008 (file No. 001-33926))
 
10(b)*
- Arabian American Development Company Stock and Incentive Plan adopted April 3, 2012 (incorporated by reference to Exhibit A to the Company’s Form DEF 14A filed April 25, 2012 (file No. 001-33926))
 
10(c)
- Articles of Association of Al Masane Al Kobra Mining Company, dated July 10, 2006 (incorporated by reference to Exhibit 10(m) to the Company’s Annual Report on Form 10-K for the year ended December 31, 2009 (file No. 001-33926))
 
10(d)
- Bylaws of Al Masane Al Kobra Mining Company (incorporated by reference to Exhibit 10(n) to the Company’s Annual Report on Form 10-K for the year ended December 31, 2009 (file No. 001-33926))
 
10(e)
- Letter Agreement dated August 5, 2009, between Trecora Resources and the other Al Masane Al Kobra Company shareholders named therein (incorporated by reference to Exhibit 10.1 to the Company’s Form 8-K filed on August 27, 2009 (file No. 001-33926))
 
10(f)
- Limited Guarantee dated October 24, 2010, between Trecora Resources and the Saudi Industrial Development Fund (incorporated by reference to Exhibit 10.1 to the Company’s Form 8-K filed on October 27, 2010 (file No. 001-33926))
 
10(g)
- Amended and Restated Credit Agreement dated October 1, 2014, between Texas Oil & Chemical Co. II, Inc. and certain subsidiaries and Bank of America, N.A. as administrative agent (incorporated by reference to Exhibit 10.2 to the Company’s Form 8-K filed on October 3, 2014 (file No. 001-33926))
 
10(h)
- Stock Purchase Agreement dated September 19, 2014, between Trecora Resources, Texas Oil & Chemical co. II, Inc. SSI Chusei, Inc. and Schumann/Steier Holdings, LLC (incorporated by reference to Exhibit 2.1 to the Company’s Form 8-K filed on September 25, 2014 (file No. 001-33926))
 
14
- Code of Ethics for Senior Financial Officers (incorporated by reference to Exhibit 14 to the Company’s Annual Report on Form 10-K for the year ended December 31, 2003 (File No. 0-6247))


39


Exhibit
Number
 
 
Description
16
- Letter re change in certifying accountant (incorporated by reference to Exhibit 16.1 to the Company’s Current Report on Form 8-K dated June 21, 2010 (File No. 001-33926))
 
21
- Subsidiaries (incorporated by reference to Exhibit 21 to the Company’s Annual Report on Form 10-K for the year ended December 31, 2014 (File 001-33926))
 
23.1
- Consents of Independent Registered Public Accounting Firms
 
24
- Power of Attorney (set forth on the signature page hereto).
 
31.1
- Certification of Chief Executive Officer pursuant to Rule 13A-14(A) of the  Securities Exchange Act of 1934
 
31.2
- Certification of Executive Vice President pursuant to Rule 13A-14(A) of the  Securities Exchange Act of 1934
 
31.3
- Certification of Chief Financial Officer pursuant to Rule 13A-14(A) of the  Securities Exchange Act of 1934
 
32.1
- Certification of Chief Executive Officer pursuant to 18 U.S.C. Section 1350, as adopted pursuant to Section 906 of the Sarbanes-Oxley Act of 2002
 
32.2
- Certification of Executive Vice President pursuant to 18 U.S.C. Section 1350, as adopted pursuant to Section 906 of the Sarbanes-Oxley Act of 2002
 
32.3
- Certification of Chief Financial Officer pursuant to 18 U.S.C. Section 1350, as adopted pursuant to Section 906 of the Sarbanes-Oxley Act of 2002
 
101.INS
- XBRL Instance Document
 
101.SCH
- XBRL Taxonomy Schema Document
 
101.CAL
- XBRL Taxonomy Calculation Linkbase  Document
 
101.LAB
- XBRL Taxonomy Label Linkbase Document
 
101.PRE
- XBRL Taxonomy Extension Presentation Linkbase Document
 
101.DEF
- XBRL Taxonomy Extension Definition Linkbase Document
 
(b)  
Exhibits required by Regulation 601 S-K
See (a) 3 of this Item 15
(c)  
Financial Statement Schedules
See (a) 2 of this Item 15

 
40


POWER OF ATTORNEY

KNOW ALL MEN BY THESE PRESENTS that each of Trecora Resources, a Delaware corporation, and the undersigned directors and officers of Trecora Resources, hereby constitutes and appoints Simon Upfill-Brown its or his true and lawful attorney-in-fact and agent, for it or him and in its or his name, place and stead, in any and all capacities, with full power to act alone, to sign any and all amendments to this Report, and to file each such amendment to the Report, with all exhibits thereto, and any and all other documents in connection therewith, with the Securities and Exchange Commission, hereby granting unto said attorney-in-fact and agent full power and authority to do and perform any and all acts and things requisite and necessary to be done in and about the premises as fully to all intents and purposes as it or he might or could do in person, hereby ratifying and confirming all that said attorney-in-fact and agent may lawfully do or cause to be done by virtue hereof.

SIGNATURES

Pursuant to the requirements of Section 13 or 15(d) of the Securities Exchange Act of 1934, the Registrant has duly caused this Report to be signed on its behalf by the undersigned, thereunto duly authorized.

TRECORA RESOURCES


Dated: March 11, 2016              By: /s/ Simon Upfill-Brown
                                                      Simon Upfill-Brown
                                                      President and Chief Executive Officer


41


Pursuant to the requirements of the Securities Exchange Act of 1934, this Report has been signed below by the following persons on behalf of the Registrant in the capacities indicated on March 11, 2016.

Signature
Title
/s/ Simon Upfill-Brown
Simon Upfill-Brown
 
 
President, Chief Executive Officer and Director
(principal executive officer)
/s/ Connie Cook
Connie Cook
Chief Financial Officer
(principal financial and accounting officer)
/s/ Nicholas Carter
Nicholas Carter
Chairman of the Board and Director
/s/ John R. Townsend
John R. Townsend
Director
/s/ Allen P. McKee
Allen P. McKee
Director
/s/ Joseph P. Palm
Joseph P. Palm
Director
/s/ Gary K. Adams
Gary K. Adams
Director
/s/ Karen A. Twitchell
Karen A. Twitchell
Director


42


INDEX TO FINANCIAL STATEMENTS
 
Page
 
F-2
   
F-3
   
F-5
   
F-6
   
F-7
   
F-8
   
F-10
   
INDEX TO FINANCIAL STATEMENT SCHEDULES
 
   
F-37
   
F-38


F-1


REPORT OF INDEPENDENT REGISTERED PUBLIC ACCOUNTING FIRM

To the Board of Directors and Stockholders
Trecora Resources

We have audited the accompanying consolidated balance sheets of Trecora Resources and Subsidiaries (the Company) as of December 31, 2015 and 2014, and the related consolidated statements of income, comprehensive income, stockholders’ equity and cash flows for each of the three years in the period ended December 31, 2015. Our audit also includes the financial statement schedule listed in the index at Item 15(a). Trecora Resources’s management is responsible for these financial statements and schedule. Our responsibility is to express an opinion on these consolidated financial statements and schedule based on our audits.

We conducted our audits in accordance with the standards of the Public Company Accounting Oversight Board (United States). Those standards require that we plan and perform the audit to obtain reasonable assurance about whether the financial statements are free of material misstatement. An audit includes examining, on a test basis, evidence supporting the amounts and disclosures in the financial statements. An audit also includes assessing the accounting principles used and significant estimates made by management, as well as evaluating the overall financial statement presentation. We believe that our audits provide a reasonable basis for our opinion.

In our opinion, the consolidated financial statements referred to above present fairly, in all material respects, the financial position of Trecora Resources and subsidiaries as of December 31, 2015 and 2014, and the results of their operations and their cash flows for each of the three years in the period ended December 31, 2015 in conformity with U. S. generally accepted accounting principles. Also in our opinion, the related financial statement schedule, when considered in relation to the basic financial statements taken as a whole present fairly, in all material respects, the information set forth therein.

We also have audited, in accordance with the standards of the Public Company Accounting Oversight Board (United States), Trecora Resources’s internal control over financial reporting as of December 31, 2015, based on criteria established in Internal Control – Integrated Framework (2013) issued by the Committee of Sponsoring Organizations of the Treadway Commission (COSO), and our report dated March 11, 2016 expressed an unqualified opinion on the effectiveness of the Company’s internal control over financial reporting.


/s/ BKM Sowan Horan, LLP
Addison, Texas
March 11, 2016


F-2


TRECORA RESOURCES AND SUBSIDIARIES

CONSOLIDATED BALANCE SHEETS


December 31,
 
   
2015
   
2014
 
   
(thousands of dollars)
 
ASSETS
           
CURRENT ASSETS
           
  Cash and cash equivalents
  $ 18,623     $ 8,506  
  Trade receivables, net (Note 6)
    19,474       28,271  
  Prepaid expenses and other assets
    2,664       3,257  
  Inventories (Note 7)
    15,804       12,815  
  Deferred income taxes (Note 17)
    2,116       1,652  
  Taxes receivable
    7,672       434  
                 
          Total current assets
    66,353       54,935  
                 
  PLANT, PIPELINE, AND EQUIPMENT – AT COST
    143,471       113,130  
    LESS ACCUMULATED DEPRECIATION
    (46,564 )     (39,319 )
                 
  PLANT, PIPELINE, AND EQUIPMENT, NET (Note 8)
    96,907       73,811  
                 
  GOODWILL (Notes 3 and 9)
    21,798       21,750  
  OTHER INTANGIBLE ASSETS, net (Notes 3 and 9)
    24,549       26,235  
  INVESTMENT IN AMAK (Note 10)
    47,697       53,023  
  MINERAL PROPERTIES IN THE UNITED STATES (Note 11)
    588       588  
  OTHER ASSETS
    919       1,732  
                 
TOTAL ASSETS
  $ 258,811     $ 232,074  


See notes to the consolidated financial statements.

 
F-3


TRECORA RESOURCES AND SUBSIDIARIES

CONSOLIDATED BALANCE SHEETS - Continued


December 31,
 
   
2015
   
2014
 
   
(thousands of dollars)
 
LIABILITIES
           
  CURRENT LIABILITIES
           
    Accounts payable
  $ 8,090     $ 9,535  
    Current portion of derivative instruments (Notes 5 and 22)
    118       362  
    Accrued liabilities (Note 13)
    4,062       5,020  
    Accrued liabilities in Saudi Arabia (Note 14)
    -       495  
    Current portion of post-retirement benefit (Note 23)
    294       286  
    Current portion of long-term debt (Note 12)
    8,333       7,000  
    Current portion of other liabilities
    2,050       2,183  
                 
          Total current liabilities
    22,947       24,881  
                 
  LONG-TERM DEBT, net of current portion (Note 12)
    73,917       73,450  
  POST- RETIREMENT BENEFIT, net of current portion (Note 23)
    649       649  
                 
  DERIVATIVE INSTRUMENTS, net of current portion (Notes 5 and 22)
    59       196  
  OTHER LIABILITIES, net of current portion
    2,351       1,039  
  DEFERRED INCOME TAXES (Note 17)
    16,503       10,471  
                 
          Total liabilities
    116,426       110,686  
                 
COMMITMENTS AND CONTINGENCIES (Note 15)
               
                 
EQUITY
               
  Common Stock - authorized 40 million shares of $.10 par value; issued and outstanding, 24.2 million and 24.0 million shares in 2015 and 2014, respectively
    2,416       2,397  
  Additional Paid-in Capital
    50,662       48,282  
  Retained Earnings
    89,018       70,420  
 Total Trecora Resources Stockholders’ Equity
    142,096       121,099  
 Noncontrolling interest
    289       289  
       Total equity
    142,385       121,388  
 
               
     TOTAL LIABILITIES AND EQUITY
  $ 258,811     $ 232,074  

See notes to the consolidated financial statements.

 
F-4


TRECORA RESOURCES AND SUBSIDIARIES

CONSOLIDATED STATEMENTS OF INCOME
 
For the years ended December 31,

   
2015
   
2014
   
2013
 
   
(thousands of dollars)
 
Revenues
                 
  Petrochemical and product sales
  $ 227,937     $ 280,866     $ 230,643  
  Processing
    14,039       8,777       5,584  
      241,976       289,643       236,227  
Operating costs and expenses
                       
  Cost of petrochemical, product sales, and processing (including depreciation and amortization of $8,335, $5,116, and $3,518, respectively)
    182,607       243,900       201,064  
   Gross Profit
    59,369       45,743       35,163  
                         
General and Administrative Expenses
                       
  General and administrative
    22,603       19,701       14,672  
  Depreciation
    725       560       521  
      23,328       20,261       15,193  
                         
Operating income
    36,041       25,482       19,970  
                         
Other income (expense)
                       
  Interest expense
    (2,217 )     (1,042 )     (520 )
  Losses on cash flow hedge reclassified from OCI
    -       (378 )     (301 )
  Equity in earnings (loss) of AMAK (Note 10)
    (5,325 )     (1,072 )     4,703  
  Gain from additional equity issuance by AMAK
   (Note 10)
    --       --       3,997  
  Miscellaneous expense
    (137 )     (272 )     (204 )
      (7,679 )     (2,764 )     7,675  
 Income before income tax expense
    28,362       22,718       27,645  
                         
Income tax expense
    9,764       7,147       8,147  
 
                       
   Net income
    18,598       15,571       19,498  
                         
Net loss attributable to Noncontrolling Interest
    --       --       --  
                         
Net income attributable to Trecora Resources
  $ 18,598     $ 15,571     $ 19,498  
                         
Net income per common share
                       
    Basic earnings per share (dollars)
  $ 0.76     $ 0.64     $ 0.81  
    Diluted earnings per share (dollars)
  $ 0.74     $ 0.63     $ 0.79  
                         
Weighted average number of common
                       
  shares outstanding
                       
     Basic
    24,370       24,188       24,115  
     Diluted
    25,181       24,896       24,745  

See notes to the consolidated financial statements.


F-5


TRECORA RESOURCES AND SUBSIDIARIES

CONSOLIDATED STATEMENTS OF COMPREHENSIVE INCOME
 
For the years ended December 31,

   
2015
   
2014
   
2013
 
   
(thousands of dollars)
 
                   
NET INCOME
  $ 18,598     $ 15,571     $ 19,498  
                         
OTHER COMPREHENSIVE INCOME, NET OF TAX
                       
      Unrealized holding gains  arising during period
    -       744       515  
      Less: reclassification adjustment included in net income
    -       378       301  
                         
OTHER COMPREHENSIVE INCOME , NET OF TAX (Note 22)
    -       366       214  
                         
 COMPREHENSIVE INCOME
  $ 18,598     $ 15,937     $ 19,712  


See notes to the consolidated financial statements.


F-6


TRECORA RESOURCES AND SUBSIDIARIES

CONSOLIDATED STATEMENTS OF STOCKHOLDERS’ EQUITY

For the years ended December 31, 2015, 2014, and 2013

   
TRECORA RESOURCES STOCKHOLDERS
                   
                     
Accumulated
                         
               
Additional
   
Other
               
Non-
       
   
Common Stock
   
Paid-In
   
Comprehensive
   
Retained
         
Controlling
   
Total
 
   
Shares
   
Amount
   
Capital
   
Income (Loss)
   
Earnings
   
Total
   
Interest
   
Equity
 
   
(thousands)
   
(thousands of dollars)
 
JANUARY 1, 2013
    23,805     $ 2,381     $ 44,791     $ (580 )   $ 35,351     $ 81,943     $ 289     $ 82,232  
                                                                 
Stock options
                                                               
  Issued to Directors
    -       -       377       -       -       377       -       377  
  Issued to Employees
    -       -       559       -       -       559       -       559  
  Issued to Former Director
    -       -       97       -       -       97       -       97  
Warrants
    -       -       181       -       -       181       -       181  
Common Stock
                                                               
  Issued to Directors
    12       1       6       -       -       7       -       7  
  Issued to Employees
    15       1       53       -       -       54       -       54  
Other Comprehensive Income (net of income tax expense of $115)
    -       -       -       214       -       214       -       214  
Net Income
    -       -       -       -       19,498       19,498       -       19,498  
                                                                 
DECEMBER 31, 2013
    23,832     $ 2,383     $ 46,064     $ (366 )   $ 54,849     $ 102,930     $ 289     $ 103,219  
                                                                 
Stock options
                                                               
  Issued to Directors
    -       -       330       -       -       330       -       330  
  Issued to Employees
    -       -       1,555       -       -       1,555       -       1,555  
  Issued to Former Director
    -       -       97       -       -       97       -       97  
Warrants
    -       -       79       -       -       79       -       79  
Common Stock
                                                               
  Issued to Directors
    88       9       (8 )     -       -       1       -       1  
  Issued to Employees
    55       5       165       -       -       170       -       170  
Other Comprehensive Income
    -       -       -       366       -       366       -       366  
Net Income
    -       -       -       -       15,571       15,571       -       15,571  
                                                                 
DECEMBER 31, 2014
    23,975     $ 2,397     $ 48,282     $ -     $ 70,420     $ 121,099     $ 289     $ 121,388  
                                                                 
Stock options
                                                               
  Issued to Directors
    -       -       274       -       -       274       -       274  
  Issued to Employees
    -       -       1,274       -       -       1,274       -       1,274  
  Issued to Former Director
    -       -       97       -       -       97       -       97  
Restricted common stock
                                                               
  Issued to Employees
    14       -       587       -       -       587       -       587  
  Issued to Directors
    -       -       43       -       -       43       -       43  
Warrants
    5       1       (1 )     -       -       -       -       -  
Common stock
                                                               
  Issued to Directors
    100       10       (10 )     -       -       -       -       -  
  Issued to Employees
    64       8       116       -       -       124       -       124  
Net Income
    -       -       -       -       18,598       18,598       -       18,598  
                                                                 
DECEMBER 31, 2015
    24,158     $ 2,416     $ 50,662     $ -     $ 89,018     $ 142,096     $ 289     $ 142,385  


See notes to the consolidated financial statements.


F-7


TRECORA RESOURCES AND SUBSIDIARIES
 
CONSOLIDATED STATEMENTS OF CASH FLOWS
 
For the years ended December 31,
   
2015
   
2014
   
2013
 
   
(thousands of dollars)
 
Operating activities
                 
  Net income attributable to Trecora Resources
  $ 18,598     $ 15,571     $ 19,498  
  Adjustments to reconcile net income
                       
    of Trecora Resources to Net cash provided by operating
     activities:
                       
    Depreciation
    7,177       5,205       4,039  
    Amortization of intangible assets
    1,883       471       -  
    Unrealized (gain) loss on derivative instruments
    (381 )     376       57  
    Share-based compensation
    2,353       2,141       1,215  
    Deferred income taxes
    5,567       (1,903 )     1,495  
    Postretirement obligation
    7       8       5  
    Equity in (income) loss of AMAK
    5,325       1,072       (4,703 )
    Gain from additional equity issuance by  AMAK
    -       -       (3,997 )
  Changes in operating assets and liabilities:
                       
    (Increase) decrease in trade receivables
    8,797       (3,380 )     (6,267 )
    (Increase) decrease in tax receivable
    (7,238 )     137       611  
    (Increase) decrease in inventories
    (2,989 )     2,587       (2,223 )
    (Increase) decrease in prepaid expenses and other assets
    935       (337 )     (90 )
    (Increase) decrease in other assets
    274       (1,024 )     (871 )
    Increase in other liabilities
    2,151       90       3,048  
    Increase (decrease) in accounts payable and accrued liabilities
    (2,399 )     1,836       1,421  
    Increase (decrease) in accrued liabilities in Saudi Arabia
    (495 )     355       4  
    Net cash provided by operating activities
    39,565       23,205       13,242  
                         
Investing activities
                       
  Additions to plant, pipeline and equipment
    (31,247 )     (14,766 )     (6,828 )
  Acquisition of TC, Inc., net of cash of $107 purchased in 2014
    (47 )     (74,712 )     -  
  Advances to AMAK, net
    -       536       1,626  
  Addition to Investment in AMAK
    -       -       (7,500 )
    Net cash used in investing activities
    (31,294 )     (88,942 )     (12,702 )
                         
Financing Activities
                       
   Issuance of common stock
    46       91       60  
  Additions to long-term debt
    15,000       87,200       6,000  
  Repayment of long-term debt
    (13,200 )     (20,656 )     (8,500 )
    Net cash provided by (used) in financing activities
    1,846       66,635       (2,440 )


See notes to the consolidated financial statements.


F-8


TRECORA RESOURCES AND SUBSIDIARIES
 
CONSOLIDATED STATEMENTS OF CASH FLOWS - continued
 
For the years ended December 31,
 
   
2015
   
2014
   
2013
 
   
(thousands of dollars)
 
                   
Net increase (decrease) in cash and cash equivalents
    10,117       898       (1,900 )
                         
Cash and cash equivalents at beginning of year
    8,506       7,608       9,508  
                         
Cash and cash equivalents at end of year
  $ 18,623     $ 8,506     $ 7,608  

Supplemental disclosure of cash flow information:
                 
  Cash payments for interest
  $ 2,103     $ 995     $ 802  
  Cash payments (net of refunds) for taxes
  $ 11,428     $ 8,959     $ 6,006  
                         
Supplemental disclosure of non-cash items:
                       
  Other liabilities for capital expansion amortized to
    depreciation expense
  $ 972     $ 1,649     $ 1,284  
  Unrealized gain on interest rate swap, net of tax
     expense
  $ -     $ 366     $ 214  


See notes to the consolidated financial statements.


F-9


Trecora Resources, formerly Arabian American Development Company, (the “Company”) was organized as a Delaware corporation in 1967.  The Company’s principal business activities are the manufacturing of various specialty petrochemical products, specialty waxes and providing custom processing services.  The Company owns 35% of a Saudi Arabian joint stock company, Al Masane Al Kobra Mining Company (“AMAK”) (see Note 10) and approximately 55% of the capital stock of a Nevada mining company, Pioche Ely Valley Mines, Inc. (“PEVM”), which does not conduct any substantial business activity but owns undeveloped properties in the United States.

The Company’s petrochemical operations are primarily conducted through a wholly-owned subsidiary, Texas Oil and Chemical Co. II, Inc. (“TOCCO”).  TOCCO owns all of the capital stock of South Hampton Resources Inc. (“SHR”) and Trecora Chemical, Inc. (“TC”).  SHR owns all of the capital stock of Gulf State Pipe Line Company, Inc. (“GSPL”).  SHR owns and operates a specialty petrochemical product facility near Silsbee, Texas which manufactures high purity hydrocarbons used primarily in polyethylene, packaging, polypropylene, expandable polystyrene, poly-iso/urethane foams, Canadian tar sands, and in the catalyst support industry.  TC owns and operates a facility located in Pasadena, Texas which manufactures specialty waxes and provides custom processing services.  These specialty waxes are used in the production of coatings, hot melt adhesives and lubricants.  GSPL owns and operates pipelines that connect the SHR facility to a natural gas line, to SHR’s truck and rail loading terminal and to a major petroleum pipeline owned by an unaffiliated third party.

We attribute revenues to countries based upon the origination of the transaction.  All of our revenues for the years ended December 31, 2015, 2014, and 2013, originated in the United States.  In addition, all of our long-lived assets are in the United States.

For convenience in this report, the terms “Company”, “our”, “us” or “we” may be used to refer to Trecora Resources and its subsidiaries.

 
NOTE 2 - SUMMARY OF SIGNIFICANT ACCOUNTING POLICIES

Principles of Consolidation – The consolidated financial statements include the balance sheets, statements of income, comprehensive income, stockholders’ equity, and cash flows of the Company, TOCCO, TC, SHR, GSPL and PEVM. Other entities which are not controlled but over which the Company has the ability to exercise significant influence such as AMAK, are accounted for using the equity method of accounting. All intercompany profits, transactions and balances have been eliminated.

Cash, Cash Equivalents and Short-Term Investments - Our principal banking and short-term investing activities are with local and national financial institutions.  Short-term investments with an original maturity of three months or less are classified as cash equivalents.

Inventories - Finished products and feedstock are recorded at the lower of cost, determined on the last-in, first-out method (LIFO); or market for SHR.  For TC, inventory is recorded at the lower of cost or market as follows:  (1) raw material cost is calculated using the weighted-average cost method and (2) product inventory cost is calculated using the specific cost method.

Accounts Receivable and Allowance for Doubtful Accounts – We evaluate the collectability of our accounts receivable and adequacy of the allowance for doubtful accounts based upon historical experience and any specific customer financial difficulties of which we become aware.  For the years ended December 31, 2015, 2014, and 2013, the allowance balance was not increased.  We track customer balances and past due amounts to determine if customers may be having financial difficulties.  This, along with historical experience and a working knowledge of each customer, helps determine accounts that should be written off.  No amounts were written off in 2015, 2014 or 2013.

Notes Receivable – We periodically make changes in or expand our custom processing units at the request of the customer.  The cost to make these changes is shared by the customer.  Upon completion of a project a non-interest


F-10

 
note receivable is recorded with an imputed interest rate.  Interest rate used on outstanding notes during December 31, 2015, and 2014, was 4%.  The unearned interest is reflected as a discount against the note balance.  The Company evaluates the collectability of notes based upon a working knowledge of the customer.  The notes are receivable from custom processing customers with whom we maintain a close relationship.  Thus, all amounts due under the notes receivable are considered collectible, and no allowance was recorded at December 31, 2015 and 2014.

Mineral Exploration and Development Costs - All costs related to the acquisition, exploration, and development of mineral deposits are capitalized until such time as (1) the Company commences commercial exploitation of the related mineral deposits at which time the costs will be amortized, (2) the related project is abandoned and the capitalized costs are charged to operations, or (3) when any or all deferred costs are permanently impaired.  At December 31, 2015, and 2014, our only remaining mining assets were held by PEVM, and we do not foresee them reaching the commercial exploitation stage.  No indirect overhead or general and administrative costs have been allocated to this project.

Plant, Pipeline and Equipment - Plant, pipeline and equipment are stated at cost.  Depreciation is provided over the estimated service lives using the straight-line method.  Gains and losses from disposition are included in operations in the period incurred.  Maintenance and repairs are expensed as incurred.  Major renewals and improvements are capitalized.

Interest costs incurred to finance expenditures during construction phase are capitalized as part of the historical cost of constructing the assets.  Construction commences with the development of the design and ends when the assets are ready for use.  Capitalized interest costs are included in plant, pipeline and equipment and are depreciated over the service life of the related assets.

Platinum catalyst is included in plant, pipeline and equipment at cost.  Amortization of the catalyst is based upon cost less estimated salvage value of the catalyst using the straight line method over the estimated useful life (see Note 8).

Goodwill and Other Intangible Assets – Goodwill represents the future economic benefits arising from other assets acquired in the acquisition of TC that are not individually identified and separately recognized.  Goodwill and indefinite-lived intangible assets are tested for impairment at least annually; however, these tests are performed more frequently when events or changes in circumstances indicate that the asset may be impaired.  Impairment exists when carrying value exceeds fair value.  Estimates of fair value are based on appraisals, market prices for comparable assets, or internal estimates of future net cash flows.

Definite-lived intangible assets consist of customer relationships, licenses, permits and developed technology that were acquired as part of the Acquisition.  The majority of these assets are being amortized using discounted estimated future cash flows over the term of the related agreements.  Intangible assets associated with customer relationships are being amortized using the discounted estimated future cash flows method based upon assumed rates of annual customer attrition.  We continually evaluate the reasonableness of the useful lives of these assets.  Once these assets are fully amortized, they will be removed from the consolidated balance sheets.

Business Combinations and Related Business Acquisition Costs – Assets and liabilities associated with business acquisitions are recorded at fair value using the acquisition method of accounting.  We allocate the purchase price of acquisitions based upon the fair value of each component which may be derived from various observable and unobservable inputs and assumptions.  We may use third-party valuation specialists to assist us in this allocation.  Initial purchase price allocations are preliminary and subject to revision within the measurement period, not to exceed one year from the date of acquisition.  The fair value of property, plant and equipment and intangible assets are based upon the discounted cash flow method that involves inputs that are not observable in the market (Level 3).  Goodwill assigned represents the amount of consideration transferred in excess of the fair value assigned to identifiable assets acquired and liabilities assumed.

Business acquisition costs are expensed as incurred and are reported as general and administrative expenses in the consolidated statements of income.  We define these costs to include finder’s fees, advisory, legal, accounting,


F-11

 
valuation, and other professional consulting fees, as well as, travel associated with the evaluation and effort to acquire specific businesses.

Investment in AMAK – We account for our investment in AMAK using the equity method of accounting under which we record in income our share of AMAK’s income or loss for each period.  The amount recorded is also adjusted to reflect the amortization of certain differences between the basis in our investment in AMAK and our share of the net assets of AMAK as reflected in AMAKs financial statements (see Note 10).

We assess our investment in AMAK for impairment when events are identified, or there are changes in circumstances that may have an adverse effect on the fair value of the investment.  We consider recoverable ore reserves and the amount and timing of the cash flows to be generated by the production of those reserves, as well as, recent equity transactions within AMAK.

Other Assets - Other assets include a license used in petrochemical operations, notes receivable, loan origination fees, and certain petrochemical assets.

Long-Lived Assets Impairment - Long-lived assets are reviewed for impairment whenever events or changes in circumstances indicate that the carrying amount may not be recoverable based on the undiscounted net cash flows to be generated from the asset’s use.  The amount of the impairment loss to be recorded is calculated by the excess of the asset's carrying value over its fair value. Fair value is generally determined using a discounted cash flow analysis although other factors including the state of the economy are considered.

Revenue Recognition – Revenue is recorded when (1) the customer accepts delivery of the product and title has been transferred or when the service is performed and we have no significant obligations remaining to be performed; (2) a final understanding as to specific nature and terms of the agreed upon transaction has occurred; (3) price is fixed and determinable; and (4) collection is assured. For our product sales these criteria are generally met, and revenue is recognized, when the product is delivered or title is transferred to the customer.  Sales are presented net of discounts, allowances, and sales taxes.  Freight costs billed to customers are recorded as a component of revenue.  For our custom processing we recognize revenue when the service has been provided to the customer.

Revenues received in advance of future sales of products or prior to the performance of services are presented as deferred revenues.

Shipping and Handling Costs - Shipping and handling costs are classified as cost of product sales and processing and are expensed as incurred.

Retirement Plan – We offer employees the benefit of participating in a 401(K) plan.  We match 100% up to 6% of pay with vesting occurring over 7 years.  For years ended December 31, 2015, 2014, and 2013, matching contributions of approximately $1,116,000, $641,000, and $554,000, respectively were made on behalf of employees.  The significant increase in 2015 was primarily due to the incorporation of TC.

Environmental Liabilities - Remediation costs are accrued based on estimates of known environmental remediation exposure.  Ongoing environmental compliance costs, including maintenance and monitoring costs, are expensed as incurred.

Other Liabilities – We periodically make changes in or expand our custom processing units at the request of the customer.  The cost to make these changes is shared by the customer.  Upon completion of a project a note receivable and a deferred liability are recorded to recover the project costs which are then capitalized.  At times instead of a note receivable being established, the customer pays an upfront cost.  The amortization of other liabilities is recorded as a reduction to depreciation expense over the life of the contract with the customer.  As of December 31 of each year, depreciation expense was reduced by approximately $1.0 million for 2015, $1.6 million for 2014, and $1.3 million for 2013.


F-12

 
Net Income Per Share - We compute basic income per common share based on the weighted-average number of common shares outstanding.  Diluted income per common share is computed based on the weighted-average number of common shares outstanding plus the number of additional common shares that would have been outstanding if potential dilutive common shares, consisting of stock options and shares which could be issued upon conversion of debt, had been issued (see Note 19).

Foreign Currency - The functional currency for the Company and each of the Company’s subsidiaries is the US dollar (USD).  Transaction gains or losses as a result of transactions denominated and settled in currencies other than the USD are reflected in the statements of income as foreign exchange transaction gains or losses.  We do not employ any practices to minimize foreign currency risks.  The functional and reporting currency of AMAK is the Saudi Riyal (SR).  In June 1986 the SR was officially pegged to the USD at a fixed exchange rate of 1 USD to 3.75 SR; therefore, we translate SR into our reporting currency of the USD for income statement and balance sheet purposes using the fixed exchange rate.  As of December 31, 2015, 2014 and 2013, foreign currency translation adjustments were not significant.

Management Estimates - The preparation of consolidated financial statements in conformity with accounting principles generally accepted in the United States of America requires management to make estimates and assumptions that affect the reported amounts of assets and liabilities and disclosure of contingent assets and liabilities at the date of the consolidated financial statements and the reported amounts of revenues and expenses during the reporting periods.  Significant estimates include allowance for doubtful accounts receivable; assessment of impairment of our long-lived assets, goodwill, intangible assets and investments, financial contracts, litigation liabilities, post-retirement benefit obligations, guarantee obligations, environmental liabilities and deferred tax valuation allowances.  Actual results could differ from these estimates.

Share-Based Compensation – We recognize share-based compensation of stock options granted based upon the fair value of options on the grant date using the Black-Scholes pricing model (see Note 16).  Share-based compensation expense recognized during the period is based on the fair value of the portion of share-based payments awards that is ultimately expected to vest.  Share-based compensation expense recognized in the consolidated statements of income for the years ended December 31, 2015, 2014, and 2013 includes compensation expense based on the estimated grant date fair value for awards that are ultimately expected to vest, and accordingly has been reduced for estimated forfeitures. Estimated forfeitures at the time of grant are revised, if necessary, in subsequent periods if actual forfeitures differ from those estimates.

Guarantees – We may enter into agreements which contain features that meet the definition of a guarantee under FASB ASC 460 “Guarantees” (see Note 15). These arrangements create two types of obligations:

a)  
We have a non-contingent and immediate obligation to stand ready to make payments if certain future triggering events occur. For certain guarantees, a liability is recognized for the stand ready obligation at the inception of the guarantee; and

b)  
We have an obligation to make future payments if those certain future triggering events do occur. A liability for the payment under the guarantee is recognized when 1) it becomes probable that one or more future events will occur, triggering the requirement to make payments under the guarantee and 2) when the payment can be reasonably estimated.

Derivatives – We record derivative instruments as either an asset or liability measured at fair value. Changes in the derivative instrument’s fair value are recognized currently in earnings unless specific hedge accounting criteria are met. Special accounting for qualifying hedges allows a derivative instrument’s gains and losses to offset related results on the hedged item in the income statement, to the extent effective, and requires that a company must formally document, designate and assess the effectiveness of transactions that receive hedge accounting.

Income Taxes – Deferred tax assets and liabilities are recognized for the future tax consequences attributable to differences between the financial statement carrying amounts of existing assets and liabilities and their respective tax


F-13

 
bases.  Deferred tax assets and liabilities are measured using enacted tax rates expected to apply to taxable income in the years in which those temporary differences are expected to be recovered or settled.  The effect on deferred tax assets and liabilities of a change in tax rates is recognized in income in the period that includes the enactment date.  A valuation allowance is recorded if there is uncertainty as to the realization of deferred tax assets.

Our estimate of the potential outcome of any uncertain tax issues is subject to management’s assessment of relevant risks, facts, and circumstances existing at that time. We use a more likely than not threshold for financial statement recognition and measurement of tax position taken or expected to be taken in a tax return.  To the extent that our assessment of such tax position changes, the change in estimate is recorded in the period in which the determination is made. We report tax-related interest and penalties as a component of income tax expense.  We recognized no material adjustment in the liability for unrecognized income tax benefits.  As of December 31, 2015, and 2014, no interest or penalties related to uncertain tax positions had been accrued.

New Accounting Pronouncements

In May 2014 the Financial Accounting Standards Board ("FASB") issued Accounting Standards Update ("ASU") 2014-09, Revenue from Contracts with Customers ("ASU 2014-09"). ASU 2014-09 supersedes the revenue recognition requirements of FASB Accounting Standards Codification ("ASC") Topic 605, Revenue Recognition and most industry-specific guidance throughout the Accounting Standards Codification, resulting in the creation of FASB ASC Topic 606, Revenue from Contracts with Customers. ASU 2014-09 requires entities to recognize revenue in a way that depicts the transfer of promised goods or services to customers in an amount that reflects the consideration to which the entity expects to be entitled to in exchange for those goods or services. This ASU provides alternative methods of retrospective adoption and is effective for fiscal years, and interim periods within those years, beginning after December 15, 2017. Early adoption would be permitted but not before annual periods beginning after December 15, 2016.The Company is currently assessing the potential impact of adopting this ASU on its consolidated financial statements and related disclosures.

In June 2014 the FASB issued ASU No. 2014-12, Compensation – Stock Compensation (Topic 718): Accounting for Share-Based Payments When the Terms of an Award Provide That a Performance Target Could Be Achieved after the Requisite Service Period. The new standard requires that a performance target that affects vesting, and that could be achieved after the requisite service period, be treated as a performance condition. As such, the performance target should not be reflected in estimating the grant date fair value of the award. This update further clarifies that compensation cost should be recognized in the period in which it becomes probable that the performance target will be achieved and should represent the compensation cost attributable to the periods for which the requisite service has already been rendered. The new standard is effective for fiscal years, and interim periods within those fiscal years, beginning after December 15, 2015 and can be applied either prospectively or retrospectively to all awards outstanding as of the beginning of the earliest annual period presented as an adjustment to opening retained earnings. Early adoption is permitted. The Company is currently assessing the potential impact of adopting this ASU on its consolidated financial statements and related disclosures.

In April 2015 the FASB issued ASU No. 2015-03, Interest - Imputation of Interest (Subtopic 835-30): Simplifying the Presentation of Debt Issuance Costs. The amendments in this ASU 2015-03 require that debt issuance costs related to a recognized debt liability be presented in the balance sheet as a direct deduction from the carrying amount of that debt liability, consistent with debt discounts. The recognition and measurement guidance for debt issuance costs are not affected by the amendments in this ASU 2015-03. In August 2015 the FASB issued ASU No. 2015-15, Interest - Imputation of Interest (Subtopic 835-30): Presentation and Subsequent Measurement of Debt Issuance Costs Associated with Line-of-Credit Arrangements - Amendments to SEC Paragraphs Pursuant to Staff Announcement at June 18, 2015 EITF Meeting. ASU 2015-15 was issued to address presentation or subsequent measurement of debt issuance costs related to line-of-credit arrangements that were not found ASU 2015-03.   Given the absence of authoritative guidance within ASU 2015-03 for debt issuance costs related to line-of-credit arrangements, the SEC staff would not object to an entity deferring and presenting debt issuance costs as an asset and subsequently amortizing the deferred debt issuance costs ratably over the term of the line-of-credit arrangement, regardless of whether there are any outstanding borrowings on the line-of-credit arrangement. These standards are effective for fiscal years, and interim periods within those fiscal years, beginning after December 15, 2015, and


F-14

 
should be applied retrospectively.  Early adoption is permitted. The Company is currently assessing the potential impact of adopting ASU 2015-03 and ASU 2015-15 on its consolidated financial statements and related disclosures.

In November 2015 the FASB issued ASU No. 2015-17, Income Taxes (Topic 740): Balance Sheet Classification of Deferred Taxes. The new standard eliminates the current requirement for organizations to present deferred tax liabilities and assets as current and noncurrent in a classified balance sheet. Instead, organizations will be required to classify all deferred tax assets and liabilities as noncurrent. The amendments are effective for financial statements issued for annual periods beginning after December 15, 2016, and interim periods within those annual periods. The Company is currently assessing the potential impact of adopting this ASU on its consolidated financial statements and related disclosures.

In February 2016 the FASB issued ASU No. 2016-02, Leases (Topic 842). The new standard was issued to increase transparency and comparability among organizations by recognizing lease assets and lease liabilities on the balance sheet and disclosing key information about leasing arrangements. This standard affects any entity that enters into a lease, with some specified scope exemptions. The guidance in this Update supersedes FASB ASC 840, Leases. The amendments in this ASU are effective for fiscal years beginning after December 15, 2018, including interim periods within those fiscal years. The Company is currently assessing the impact of adopting this ASU on its consolidated financial statements and related disclosures.

NOTE 3 – ACQUISITION OF TRECORA CHEMICAL, INC. (formerly SSI Chusei, Inc.)

On October 1, 2014, we acquired 100% of the Class A common stock of SSI Chusei, Inc. (“SSI”), a Texas corporation in exchange for a cash payment of $74.8 million which was funded by (i) $4,702,000 from TREC’s existing cash balances and (ii) $70,000,000 from the proceeds of a senior secured financing.    On November 15, 2014, SSI’s name was officially changed to Trecora Chemical, Inc.

TC is a leading manufacturer of specialty synthetic waxes and custom processing services located in Pasadena, Texas.  We believe the Acquisition increases our product diversification, expands our footprint in the industry, and provides geographic diversity.  TC makes up the specialty synthetic wax segment of our business.

We have accounted for the Acquisition in accordance with the acquisition method of accounting under Financial Accounting Standards Board Accounting Standards Codification Topic 805 “Business Combinations” (“ASC 805”). In accordance with ASC 805, we used our best estimates and assumptions to assign fair value to the tangible and intangible assets acquired and liabilities assumed at the Acquisition Date. Goodwill as of the Acquisition Date was measured as the excess of purchase consideration over the fair value of net tangible and identifiable intangible assets acquired.

The assets and certain liabilities acquired from TC on October 1, 2014, have been included in our consolidated balance sheets and our consolidated statements of income since the date of acquisition.  The sales and operating loss of TC that are included in the consolidated statements of income for the year ended December 31, 2014, was $5.3 million and $1.1 million, respectively.  In connection with the Acquisition, we incurred acquisition costs of $1.0 million which are reflected in general and administrative expenses in the consolidated statements of income.  The financial results of TC’s business are reported as a separate business segment.

The following table summarizes the consideration paid for TC (in thousands):

Cash paid at closing
  $ 2,902  
Cash paid for working capital adjustment
    1,916  
Debt
    70,000  
Total purchase consideration
  $ 74,818  

We recorded $21.8 million of Goodwill as a result of the Acquisition, all of which was recorded within TC’s operating segment.  Goodwill recognized in the Acquisition relates primarily to enhancing our strategic platform for expansion into other specialty products such as specialty waxes and custom processing services.  All of the


F-15

 
Goodwill recognized is expected to be deductible for income tax purposes.  The allocation of the aggregate purchase price is as follows (in thousands):

Purchase Price
        $ 74,818  
               
Cash
  $ 107          
Trade receivables
    2,821          
Inventories
    3,339          
Prepaid expenses and other assets
    743          
Plant, pipeline and equipment
    23,973          
Other intangible assets
    26,706          
Accounts payable
    (1,074 )        
Accrued liabilities
    (1,121 )        
Other liabilities
    (1,759 )        
Long-term debt, net of current portion
    (667 )     53,068  
Goodwill
          $ 21,750  

The components of the other intangible assets listed in the table above, based upon a third party appraisal, were as follows (in thousands):

Identifiable Intangible Asset
 
Value
   
Life (years)
 
Customer Relationships
  $ 16,852       15  
Non-compete Agreements
    94       5  
Licenses and Permits
    1,471    
various
 
Trade Name
    2,158    
indefinite
 
Developed Technology
    6,131       10  
Total
  $ 26,706          
Weighted average amortization period
            12.5  

The following unaudited pro forma financial information reflects the consolidated results of operation of the Company as if the Acquisition had taken place on January 1, 2013 (in thousands):

   
Years Ended December 31,
 
   
2014
   
2013
 
Sales
  $ 308,966     $ 259,348  
Net Income
  $ 16,623     $ 20,223  

Our historical financial information was adjusted to give effect to the pro forma events that were directly attributable to the Acquisition.  This unaudited pro forma financial information has been presented for illustrative purposes only and is not necessarily indicative of results of operations that would have been achieved had the pro forma events taken place on the dates indicated or the future consolidated results of operations of the combined Company.

For the year ended December 31, 2014, the unaudited pro forma financial information reflects adjustments to depreciation expense resulting from the adjustment to fair value of TC’s plant and equipment, amortization expense on other intangible assets, non-recurring acquisition costs, salary costs in connection with employment contracts with certain officers, interest expense on the secured financing, and estimated tax effect on the incremental change.

For the year ended December 31, 2013, the unaudited pro forma financial information reflects adjustments to depreciation expense resulting from the adjustment to fair value of TC’s plant and equipment, amortization expense on other intangible assets, salary costs in connection with employment contracts with certain officers, interest expense on the secured financing, and estimated tax effect on the incremental change.


F-16

 
NOTE 4 - CONCENTRATIONS OF REVENUES AND CREDIT RISK

We sell our products and services to companies in the chemical, plastics, and petroleum industries.  We perform periodic credit evaluations of our customers and generally do not require collateral from our customers.  For the year ended December 31, 2015, one customer accounted for 20.1% of total revenue.  For the year ended December 31, 2014, two customers accounted for 23.2% and 10.5% of total revenue.  For the year ended December 31, 2013, two customers accounted for 16.5% and 16.2% of total product sales.  The associated accounts receivable balances for those customers were approximately $7.6 million at December 31, 2015, and $9.5 million and $1.6 million as of December 31, 2014.  The carrying amount of accounts receivable approximates fair value at December 31, 2015.

Accounts receivable serves as collateral for our amended and restated loan agreement (see Note 12).

We market our products in many foreign jurisdictions.  For the years ended December 31, 2015, 2014 and 2013, petrochemical product sales revenue in foreign jurisdictions accounted for approximately 27.9%, 30.5%, and 26.2%, respectively.

SHR utilizes one major supplier for its feedstock supply. The feedstock is a commodity product commonly available from other suppliers if needed.  The percentage of feedstock purchased from the supplier during 2015, 2014, and 2013 was 100%, 100% and 99%, respectively.  At December 31, 2015, and 2014, we owed the supplier approximately $2.5 million and $1.0 million, respectively for feedstock purchases.

We hold our cash with various financial institutions that are insured by the Federal Deposit Insurance Corporation up to $250,000.  At times during the year, cash balances may exceed this limit.  We have not experienced any losses in such accounts and do not believe we are exposed to any significant risk of loss related to cash.

NOTE 5 – FAIR VALUE MEASUREMENTS

The carrying value of cash and cash equivalents, trade receivables, taxes receivable, accounts payable, accrued liabilities, accrued liabilities in Saudi Arabia and other liabilities approximate fair value due to the immediate or short-term maturity of these financial instruments. The fair value of variable rate long term debt and notes payable reflect recent market transactions and approximate carrying value.  We used other observable inputs that would qualify as Level 2 inputs to make our assessment of the approximate fair value of our cash and cash equivalents, trade receivables,  taxes receivable, accounts payable, accrued liabilities, accrued liabilities in Saudi Arabia, other liabilities and variable rate long term debt.  The fair value of the derivative instruments are described below.

We measure fair value by ASC Topic 820 Fair Value.  ASC Topic 820 defines fair value, establishes a framework for measuring fair value, and expands disclosures about fair value measurements.  ASC Topic 820 applies to reported balances that are required or permitted to be measured at fair value under existing accounting pronouncements; accordingly, the standard amends numerous accounting pronouncements but does not require any new fair value measurements of reported balances. ASC Topic 820 emphasizes that fair value, among other things, is based on exit price versus entry price, should include assumptions about risk such as nonperformance risk in liability fair values, and is a market-based measurement, not an entity-specific measurement. When considering the assumptions that market participants would use in pricing the asset or liability, ASC Topic 820 establishes a fair value hierarchy that distinguishes between market participant assumptions based on market data obtained from sources independent of the reporting entity (observable inputs that are classified within Levels 1 and 2 of the hierarchy) and the reporting entity’s own assumptions about market participant assumptions (unobservable inputs classified within Level 3 of the hierarchy). The fair value hierarchy prioritizes inputs used to measure fair value into three broad levels.

Level 1 inputs
Level 1 inputs utilize quoted prices (unadjusted) in active markets for identical assets or liabilities that the Company has the ability to access.
Level 2 inputs
Level 2 inputs are inputs other than quoted prices included in Level 1 that are observable for the asset or liability, either directly or indirectly.  Level 2 inputs may include quoted prices for similar assets and liabilities in active markets, as well as inputs that are observable for the asset or liability (other than quoted prices), such as interest rates, foreign exchange rates, and yield curves that are observable at commonly quoted intervals.
Level 3 inputs
Level 3 inputs are unobservable inputs for the asset or liability, which is typically based on an entity’s own assumptions, as there is little, if any, related market activity.


F-17

 
In instances where the determination of the fair value measurement is based on inputs from different levels of the fair value hierarchy, the level in the fair value hierarchy within which the entire fair value measurement falls is based on the lowest level input that is significant to the fair value measurement in its entirety. Our assessment of the significance of a particular input to the fair value measurement in its entirety requires judgment and considers factors specific to the asset or liability.

Commodity Financial Instruments

We periodically enter into financial instruments to hedge the cost of natural gasoline (the primary feedstock) and natural gas (used as fuel to operate the plants).  We use financial swaps on feedstock and options on natural gas to limit the effect of significant fluctuations in price on operating results.

We assess the fair value of the financial swaps on feedstock using quoted prices in active markets for identical assets or liabilities (Level 1 of fair value hierarchy).  At December 31, 2015, we had no derivative contracts outstanding.  At December 31, 2014, we had derivative contracts with settlement dates through January 2015.  For additional information see Note 22.

Interest Rate Swaps

In March 2008 we entered into an interest rate swap agreement with Bank of America related to the $10.0 million term loan secured by plant, pipeline and equipment.  The interest rate swap was designed to minimize the effect of changes in the LIBOR rate.  We had designated the interest rate swap as a cash flow hedge under ASC Topic 815 (see Note 22); however, due to the new debt agreements associated with the Acquisition, we believe that the hedge is no longer entirely effective.  Due to the time required to make the determination and the immateriality of the hedge, we began treating the interest rate swap as ineffective as of October 1, 2014, and the unrealized loss associated with the swap of approximately $378,000 was recognized in the Statement of Income for the year ended December 31, 2014.

We assess the fair value of the interest rate swap using a present value model that includes quoted LIBOR rates and the nonperformance risk of the Company and Bank of America based on the Credit Default Swap Market (Level 2 of fair value hierarchy).

The following items are measured at fair value on a recurring basis at December 31, 2015 and 2014:

   
Fair Value Measurements Using
 
December 31, 2015
 
Total
   
Level 1
   
Level 2
   
Level 3
 
   
(thousands of dollars)
 
Liabilities:
                       
Interest rate swap
  $ 177     $ -     $ 177     $ -  
 
   
Fair Value Measurements Using
 
December 31, 2014
 
Total
   
Level 1
   
Level 2
   
Level 3
 
   
(thousands of dollars)
 
Liabilities:
                       
Interest rate swap
  $ 378     $ -     $ 378     $ -  
Commodity financial instruments
    180       180                  

We have consistently applied valuation techniques in all periods presented and believe we have obtained the most accurate information available for the types of derivative contracts we hold.

 
F-18


NOTE 6 – TRADE RECEIVABLES

Trade receivables, net, at December 31, 2015, and 2014, respectively, consisted of the following:

   
2015
   
2014
 
   
(thousands of dollars)
 
             
Trade receivables
  $ 19,684     $ 28,481  
Less allowance for doubtful accounts
    (210 )     (210 )
                 
  Trade receivables, net
  $ 19,474     $ 28,271  

Trade receivables serves as collateral for our amended and restated loan agreement with a domestic bank (see Note 12).

NOTE 7 – INVENTORIES

Inventories include the following at December 31:

   
2015
   
2014
 
   
(thousands of dollars)
 
             
Raw material
  $ 2,905     $ 2,826  
Work in process
    56       49  
Finished products
    12,843       9,940  
                 
Total inventory
  $ 15,804     $ 12,815  

Inventory serves as collateral for our amended and restated loan agreement with a domestic bank (see Note 12).

The difference between the calculated value of inventory under the FIFO and LIFO bases generates either a recorded LIFO reserve (i.e., where FIFO value exceeds the LIFO value) or an unrecorded negative LIFO reserve (i.e., where the LIFO value exceeds the FIFO value).  In the latter case, in order to ensure that inventory is reported at the lower of cost or market and in accordance with ASC 330-10, we do not increase the stated value of our inventory to the LIFO value.
 
At December 31, 2015 and 2014, the LIFO value of inventory exceeded FIFO; therefore, in accordance with the above policy, no LIFO reserve was recorded.

Inventory included products in transit valued at approximately $2.7 million and $3.5 million at December 31, 2015, and 2014, respectively.

NOTE 8 – PLANT, PIPELINE AND EQUIPMENT

Plant, pipeline and equipment include the following at December 31:

   
2015
   
2014
 
   
(thousands of dollars)
 
Platinum catalyst
  $ 1,612     $ 1,612  
Land
    4,577       4,577  
Plant, pipeline and equipment
    128,302       95,351  
Construction in progress
    8,980       11,590  
Total plant, pipeline and equipment
    143,471       113,130  
    Less accumulated depreciation
    (46,564 )     (39,319 )
Net plant, pipeline and equipment
  $ 96,907     $ 73,811  


F-19


Plant, pipeline and equipment serve as collateral for our amended and restated loan agreement with a domestic bank (see Note 12).

Interest capitalized for construction for 2015 was approximately $141,000.  Interest capitalized for 2014 and 2013 was not significant to the consolidated financial statements.

Catalyst amortization relating to the platinum catalyst which is included in cost of sales was $84,269, $84,269 and $38,232 for 2015, 2014 and 2013, respectively.

NOTE 9 – GOODWILL AND INTANGIBLE ASSETS, NET

Goodwill

The following table summarizes changes in the carrying amount of goodwill for the year ended December 31, 2015 (in thousands):

   
Balance as of
 December 31, 2014
   
Adjustment
   
Balance as of
December 31, 2015
 
TC
  $ 21, 750     $ 48     $ 21,798  

We performed an impairment analysis on the value of Goodwill at December 31, 2015, and determined that no impairment existed.

 Intangible Assets

The following table summarizes the gross carrying amounts and accumulated amortization of intangible assets by major class (in thousands):

   
December 31, 2015
 
Intangible assets subject to amortization
(Definite-lived)
 
Gross
   
Accumulated
Amortization
   
Net
 
Customer relationships
  $ 16,852     $ (1,404 )   $ 15,448  
Non-compete agreements
    94       (24 )     70  
Licenses and permits
    1,471       (160 )     1,311  
Developed technology
    6,131       (766 )     5,365  
      24,548       (2,354 )     22,194  
Intangible assets not subject to amortization
(Indefinite-lived)
                       
Emissions Allowance
    197       -       197  
Trade name
    2,158       -       2,158  
Total
  $ 26,903     $ (2,354 )   $ 24,549  

   
December 31, 2014
 
Intangible assets subject to amortization
(Definite-lived)
 
Gross
   
Accumulated
Amortization
   
Net
 
Customer relationships
  $ 16,852     $ (281 )   $ 16,571  
Non-compete agreements
    94       (5 )     89  
Licenses and permits
    1,471       (32 )     1,439  
Developed technology
    6,131       (153 )     5,978  
      24,548       (471 )     24,077  
Intangible assets not subject to amortization
(Indefinite-lived)
                       
Trade name
    2,158       -       2,158  
Total
  $ 26,706     $ (471 )   $ 26,235  


F-20

 
Estimated amortization expense for the succeeding five fiscal years is as follows (in thousands):

2016
  $ 1,874  
2017
    1,861  
2018
    1,860  
2019
    1,853  
2020
    1,842  
Total
  $ 9,290  

NOTE 10 - INVESTMENT IN AL MASANE AL KOBRA MINING COMPANY (“AMAK”)

We have concluded that we have significant influence over the operating and financial policies of AMAK and, accordingly, should account for our investment in AMAK using the equity method.  As of December 31, 2015, and 2014, we had a non-controlling equity interest of approximately $47.7 million and $53.0 million, respectively.
 
 
We have received and attached to this Form 10-K the financial statements of AMAK prepared in accordance with generally accepted accounting principles in the United States of America as of December 31, 2015, and 2014, and for each of the three years ended December 31, 2015.  These financial statements have been prepared in the functional currency of AMAK which is the Saudi Riyal (SR).  In June 1986 the SR was officially pegged to the U.S. Dollar (USD) at a fixed exchange rate of 1 USD to 3.75 SR.

The summarized results of operation and financial position for AMAK are as follows:

Results of Operations

   
Years Ended December 31,
 
   
2015
   
2014
   
2013
 
   
(Thousands of Dollars)
 
Sales
  $ 50,744     $ 63,300     $ 104,990  
Gross profit
    (10,437 )     3,624       21,881  
General, administrative and other expenses
    8,796       10,487       12,360  
Net income (loss)
  $ (19,233 )   $ (6,863 )   $ 9,521  

Depreciation and amortization for the years ended December 31, 2015, 2014, and 2013 was $23.2 million, $23.7 million and $24.4 million, respectively.  Therefore, net income before depreciation and amortization was as follows:

   
Years Ended December 31,
 
   
2015
   
2014
   
2013
 
   
(Thousands of Dollars)
 
Net income before depreciation and amortization
  $ 4,016     $ 16,845     $ 33,878  


F-21


Financial Position

   
December 31,
 
   
2015
   
2014
 
   
(Thousands of Dollars)
 
Current assets
  $ 26,078     $ 14,893  
Noncurrent assets
    259,527       268,473  
Total assets
  $ 285,605     $ 283,366  
                 
Current liabilities
  $ 22,740     $ 23,034  
Long term liabilities
    89,364       67,598  
Shareholders' equity
    173,501       192,734  
Total liabilities and equity
  $ 285,605     $ 283,366  

The equity in the income or loss of AMAK reflected on the consolidated statements of income for the years ended December 31, 2015, 2014, and 2013, is comprised of the following:

   
2015
   
2014
   
2013
 
AMAK Net Income (Loss)
  $ (19,233 )   $ (6,863 )   $ 9,521  
Zakat tax applicable to Saudi Arabian shareholders only
    303       -       -  
AMAK Net Income (Loss) before Saudi Arabian shareholders' portion of Zakat
  $ (18,930 )   $ (6,863 )   $ 9,521  
                         
Company’s share of earnings (loss) reported by AMAK (35.25%)
  $ (6,672 )   $ (2,419 )   $ 3,356  
Amortization of difference between Company’s investment in AMAK
                       
  and Company’s share of net assets of AMAK
    1,347       1,347       1,347  
Equity in earnings (loss) of AMAK
  $ (5,325 )   $ (1,072 )   $ 4,703  

A gain of approximately $16.2 million for the difference between our initial investment in AMAK and our share of AMAK’s initial assets recorded at fair value was not recognized in 2008.  This basis difference is being amortized over the life of AMAK’s mine which is estimated to be twelve years beginning with its commencement of production in July 2012 as an adjustment to our equity in AMAK’s income or loss.

In December 2012 the Board of Directors of AMAK authorized the issuance of additional shares of AMAK in an amount equal to ten percent of the then outstanding shares to raise funds for working capital requirements and retirement of construction debt.  In January 2013 we entered into an agreement with AMAK to purchase an additional 937,500 shares of AMAK at 30 Saudi Riyals (USD $8.00) per share, for a total of USD $7.5 million.  Due to the continued improvement in the operations of AMAK and a desire to prevent a substantial dilution of its investment, we elected to purchase these additional shares.  As a result of this purchase and upon completion of the raise on May 27, 2013, our ownership percentage in AMAK became approximately 35%.  All existing AMAK shareholders had the opportunity to buy into the issue and all shares were placed within that group.  As a result of the equity raise in 2013, the Company’s share of the net assets of AMAK increased approximately $4.0 million which the Company recognized as a gain (with a corresponding increase in its investment) in accordance with ASC 323-10-40-1.

We assess our investment in AMAK for impairment when events are identified, or there are changes in circumstances that may have an adverse effect on the fair value or recoverability of the investment.  We consider recoverable ore reserves and the amount and timing of the cash flows to be generated by the production of those reserves, as well as, recent equity transactions within AMAK.  No impairment charges were recorded in 2015, 2014, or 2013.


F-22

 
NOTE 11 - MINERAL PROPERTIES IN THE UNITED STATES

The principal assets of PEVM are an undivided interest in 48 patented and 5 unpatented mining claims totaling approximately 1,500 acres, and a 300 ton-per-day mill located on the aforementioned properties in the PEVM Mining District in southeast Nevada.  In August 2001 seventy five unpatented claims were abandoned since they were deemed to have no future value to PEVM.  Due to the lack of capital, the properties held by PEVM have not been commercially operated for approximately 35 years.

NOTE 12 - LONG-TERM DEBT AND LONG-TERM OBLIGATIONS

Long-term debt and long-term obligations at December 31 are summarized as follows:

   
2015
   
2014
 
   
(thousands of dollars)
 
  Revolving note to domestic banks (A)
    1,000       7,200  
  Term note to domestic banks (B)
    61,250       68,250  
  Term note to domestic banks (C)
    20,000       5,000  
                 
     Total long-term debt
    82,250       80,450  
                 
  Less current portion
    8,333       7,000  
                 
     Total long-term debt, less current portion
  $ 73,917     $ 73,450  

(A)  
On October 1, 2014, TOCCO, SHR, GSPL and TC (SHR, GSPL and TC collectively the “Guarantors”) entered into an Amended and Restated Credit Agreement (“ARC Agreement”) with the lenders which from time to time are parties to the ARC Agreement (collectively, the “Lenders”) and Bank of America, N.A., a national banking association, as Administrative Agent for the Lenders, and Merrill Lynch, Pierce, Fenner & Smith Incorporated as Lead Arranger.

Subject to the terms and conditions of the ARC Agreement, TOCCO may (a) borrow, repay and re-borrow revolving loans (collectively, the “Revolving Loans”) from time to time during the period ending September 30, 2019, up to but not exceeding at any one time outstanding $40.0 million (the “Revolving Loan Commitment”) and (b) request up to $5.0 million of letters of credit and $5.0 million of swingline loans.  Each of the issuance of letters of credit and the advance of swingline loans shall be considered usage of the Revolving Loan Commitment.  All outstanding loans under the Revolving Loans must be repaid on October 1, 2019.  As of December 31, 2015, TOCCO had borrowed funds under the Revolving Loans aggregating $1.0 million with $39.0 million available to be drawn.

(B)  
Under the ARC Agreement, TOCCO also borrowed $70.0 million in a single advance term loan (the “Acquisition Term Loan”) to partially finance the Acquisition.

(C)  
Under the ARC Agreement, TOCCO also has the right to borrow $25.0 million in a multiple advance loan (the “Term Loans,” together with the Revolving Loans and Acquisition Term Loan, collectively the “Loans”).  Borrowing availability under the Term Loans ended on December 31, 2015.  The Term Loans convert from a multiple advance loan to a “mini-perm” loan once TOCCO has fulfilled certain obligations such as certification that construction of D-Train was completed in a good and workmanlike manner, receipt of applicable permits and releases from governmental authorities, and receipt of releases of liens from the contractor and each subcontractor and supplier.  The Loans also include a $40.0 million uncommitted increase option (the “Accordion Option”).  As of December 31, 2015, TOCCO had borrowed funds under the agreement aggregating $20.0 million with $0.0 million available to be drawn due to the expiration of the borrowing availability.


F-23

 
All of the Loans under the ARC Agreement will accrue interest at the lower of (i) a London interbank offered rate (“Eurodollar Rate”) plus a margin of between 2.00% and 2.50% based on the total leverage ratio of TOCCO and its subsidiaries on a consolidated basis, or (ii) a base rate (“Base Rate”) equal to the highest of the federal funds rate plus 0.50%, the rate announced by Bank of America, N.A. as its prime rate, and Eurodollar Rate plus 1.0%, plus a margin of between 1.00% to 1.50% based on the total leverage ratio of TOCCO and its subsidiaries on a consolidated basis.  The Revolving Loans will accrue a commitment fee on the unused portion thereof at a rate between 0.25% and 0.375% based on the total leverage ratio of TOCCO and its subsidiaries on a consolidated basis.  Interest on the Revolving Loans will be payable quarterly, with principal due and payable at maturity.  Interest on the Acquisition Term Loan will be payable quarterly using a ten year commercial style amortization, commencing on December 31, 2014.  The Acquisition Term Loan is also payable as to principal beginning on December 31, 2014, and continuing on the last business day of each March, June, September and December thereafter, each payment in an amount equal to $1,750,000, provided that the final installment on the September 30, 2019, maturity date shall be in an amount equal to the then outstanding unpaid principal balance of the Acquisition Term Loan.  Interest on the Term Loans will be payable quarterly using a fifteen year commercial style amortization, with interest only through December 31, 2015, and quarterly principal payments of $333,333 to commence March 31, 2016.  Interest on the Loans will be computed (i) in the case of Base Rate Loans, on the basis of a 365-day or 366-day year, as the case may be, and (ii) in the case of Eurodollar Rate Loans, on the basis of a 360-day year, in each case for the actual number of days elapsed in the period during which it accrues.  At December 31, 2015, the variable interest rate under the loans was 2.42%.

The Loans may be prepaid in whole or in part without premium or penalty (Eurodollar Rate Loans are prepayable only on the last days of related interest periods or upon payment of any breakage costs) and the lenders’ commitments relative thereto reduced or terminated.  Subject to certain exceptions and thresholds, outstanding Loans shall be prepaid by an amount equal to 100% of the net cash proceeds from: (i) all sales, transfers, licenses, lease or other disposition of any property by TOCCO and Guarantors (other than a permitted transfer); (ii) any equity issuance by TOCCO or the Guarantors; (iii) any debt issuance by TOCCO or the Guarantors; or (iv) the receipt of any cash received by TOCCO or the Guarantors not in the ordinary course of business.  Amounts prepaid in connection with the mandatory repayments described above will be applied first, to the principal repayment installments of the Acquisition Term Loan in inverse order of maturity, second, to the principal repayment installments of the Term Loans in inverse order of maturity and, third, to the Revolving Loans in the manner set forth in the Amended and Restated Credit Agreement.

All amounts owing under the ARC Agreement and all obligations under the guarantees will be secured in favor of the Lenders by substantially all of the assets of TOCCO and its subsidiaries and guaranteed by its subsidiaries.

The ARC Agreement contains, among other things, customary covenants, including restrictions on the incurrence of additional indebtedness, the granting of additional liens, the making of investments, the disposition of assets and other fundamental changes, the transactions with affiliates and the declaration of dividends and other restricted payments.  The ARC Agreement also includes the following financial covenants, each tested on a quarterly basis for TOCCO and its subsidiaries on a consolidated basis: a maximum total leverage ratio of 3.25 to 1, a minimum fixed charge coverage ratio of 1.25 to 1, and an asset coverage test of greater than 1.1 to 1.  The ARC Agreement further includes customary representations and warranties and events of default, and upon occurrence of such events of default the outstanding obligations under the ARC Agreement may be accelerated and become immediately due and payable and the commitment of the Lenders to make loans under the ARC Agreement may be terminated.  TOCCO was in compliance with all covenants at December 31, 2015.

 
F-24


     Principal payments of long-term debt for the next five years and thereafter ending December 31 are as follows:
 
Year Ending December 31,
 
Long-Term Debt
 
   
(thousands of dollars)
 
2016
  $ 8,333  
2017
    8,333  
2018
    8,334  
2019
    57,250  
Total
  $ 82,250  

NOTE 13 – ACCRUED LIABILITIES

Accrued liabilities at December 31 are summarized as follows:

   
2015
   
2014
 
   
(thousands of dollars)
 
Accrued state taxes
  $ 325     $ 317  
Accrued payroll
    1,293       1,708  
Accrued interest
    34       36  
Accrued officers’ compensation
    1,254       1,600  
Other liabilities
    1,156       1,359  
   Total
  $ 4,062     $ 5,020  


NOTE 14 – ACCRUED LIABILITIES IN SAUDI ARABIA

The following liabilities represent amounts owed to the former CEO who retired in 2009.  Accrued liabilities in Saudi Arabia at December 31 are summarized as follows:

   
2015
   
2014
 
   
(thousands of dollars)
 
Termination benefits
  $ -     $ -  
Lawsuit settlement
    -       495  
Other liabilities
    -       -  
                 
   Total
  $ -     $ 495  

NOTE 15 - COMMITMENTS AND CONTINGENCIES

Guarantees

On October 24, 2010, we executed a limited guarantee in favor of the Saudi Industrial Development Fund (“SIDF”) whereby we agreed to guaranty up to 41% of the SIDF loan to AMAK in the principal amount of 330.0 million Saudi Riyals (US$88.0 million) (the “Loan”). The term of the loan is through June 2019.  As a condition of the Loan, SIDF required all shareholders of AMAK to execute personal or corporate guarantees; as a result, the Company’s guarantee is for approximately 135.3 million Saudi Riyals (US$36.1 million). The loan was necessary to continue construction of the AMAK facilities and provide working capital needs.  Our current assessment is that the probability of contingent performance was remote based on our analysis of the contingent portion of the guarantee which included but was not limited to the following:  (1) the SIDF has historically not called guarantees, (2) the value of the assets exceeds the amount of the loan, (3) the other shareholders have indicated that they would prioritize their personal guarantees ahead of the corporate guarantee, and (4) according to Saudi Arabian legal counsel, assets outside of Saudi Arabia are protected from the Saudi Court System.  We received no consideration in connection with extending the guarantee and did so to maintain and enhance the value of our investment.  Our


F-25

 
non-contingent and immediate obligation to stand ready to make payments if the events of default under the guarantee occur was not material to the financial statements.  The total amount outstanding to the SIDF at December 31, 2015, and 2014 was 310.0 million and 259.8 million Saudi Riyals (US$82.7 million and US$69.3 million), respectively.

Operating Lease Commitments

We have operating leases for the rental of over 350 railcars for shipping purposes with expiration dates through 2026.  Invoices are received and paid on a monthly basis.  The total amount of the commitment is approximately $13.6 million over the next 11 years.

We also have an operating lease for our office space in Sugar Land, TX.  The expiration date for this lease is 2018.  The total amount of the commitment is approximately $0.2 million.  In addition, we are required to make periodic payments for property taxes, utilities and common area operating expenses.

Future minimum property and equipment lease payments under the non-cancelable operating leases at December 31, 2015, are as follows:

Year Ending December 31,
 
Long-Term Debt
 
   
(thousands of dollars)
 
2016
  $ 3,309  
2017
    2,540  
2018
    2,127  
2019
    1,976  
2020
    1,829  
Thereafter
    2,065  
Total
  $ 13,846  

Rental expense for these operating leases for the years ended December 31, 2015, 2014, and 2013 was $4.2 million, $2.5 million and $1.8 million, respectively.

Litigation -

On March 21, 2011, Mr. El Khalidi filed suit against the Company in Texas alleging breach of contract and other claims.  The 88th Judicial District Court of Hardin County, Texas dismissed all claims and counterclaims for want of prosecution in this matter on July 24, 2013.  The Ninth Court of Appeals subsequently affirmed the dismissal for want of prosecution and the Supreme Court of Texas denied Mr. El Khalidi’s petition for review.  On May 1, 2014, Mr. El Khalidi refiled his lawsuit against the Company for breach of contract and defamation in the 356th Judicial District Court of Hardin County, Texas.  The case was transferred to the 88th Judicial District Court of Hardin County, Texas where it is currently pending.  On April 6, 2015, Mr. El-Khalidi nonsuited his defamation claim.  We believe that the remaining claims are unsubstantiated and plan to vigorously defend the case.  Liabilities of approximately $1.0 million remain recorded, and the options will continue to accrue in accordance with their own terms until all matters are resolved.

On September 14, 2010, SHR received notice of a lawsuit filed in the 58th Judicial District Court of Jefferson County, Texas which was subsequently transferred to the 11th Judicial District Court of Harris County, Texas.  The suit alleges that the plaintiff became ill from exposure to asbestos.  There are approximately 44 defendants named in the suit.  On December 15, 2015, plaintiff agreed to settle all claims against SHR for a de minimis amount.

On April 30, 2015, TC and TREC received notice of a lawsuit filed in the 152nd Judicial District Court of Harris County, Texas.  The suit alleges that the plaintiff, an independent contractor employee, was injured while working on a product line at TC.  We have placed our insurers on notice and plan to vigorously defend the case. 

 
F-26

 
On or about August 3, 2015, SHR received notice of a lawsuit filed in the 14th Judicial District Court of Calcasieu Parish, Louisiana.  The suit alleges that the plaintiff became ill from exposure to benzene.  SHR placed its insurers on notice.  Its insurers retained a law firm based in Louisiana to defend SHR.

Environmental Remediation -

Amounts charged to expense for various activities related to environmental monitoring, compliance, and improvements were approximately $604,000 in 2015, $414,000 in 2014 and $386,000 in 2013.

NOTE 16 - SHARE-BASED COMPENSATION

Share-based compensation of approximately $2.3 million, $2.1 million, and $1.2 million was recognized in 2015, 2014, and 2013, respectively.

Restricted Common Stock

On May 20, 2015, we awarded 30,000 shares of restricted stock to a director at a grant date price of $12.39.  The restricted stock award vests over 5 years in 20% increments with the first tranche to be issued on May 19, 2016.  Compensation expense recognized during 2015 was approximately $43,000.

On April 14, 2015, we awarded 1,000 shares of restricted stock to two of our 30 year employees at a grant date price of $12.03.  The restricted stock award was fully vested.  Compensation expense recognized during 2015 was approximately $12,000.

On February 12, 2015, we awarded 18,000 shares of fully vested restricted stock to various employees at a grant date price of $14.34.  Compensation expense recognized during 2015 was approximately $258,000.

On February 10, 2015, we awarded 118,040 shares of restricted stock to our officers at a grant date price of $14.59.  The restricted stock award vests over 4 years in 25% increments with the first tranche to be issued on February 9, 2016.  Compensation expense recognized during 2015 was approximately $395,000.

A summary of the status of the Company’s restricted stock activity in 2015 is as follows:

   
Shares of Restricted
Stock
   
Weighted Average Grant Date Price per Share
 
             
Outstanding at January 1, 2015
    -     $ -  
   Granted
    167,040       14.15  
   Vested
    (19,000 )     14.22  
Outstanding at December 31, 2015
    148,040     $ 14.14  
Expected to vest
    148,040          

As of December 31, 2015, there was approximately $1.7 million of unrecognized compensation costs related to non-vested share-based compensation that is expected to be recognized over a weighted average period of 3.3 years.

In October 2014 we issued 7,000 shares of restricted common stock to the President of TC.  Compensation expense of $79,310 was recognized in connection with this issuance.


F-27

 
Stock Options and Warrant Awards

On April 3, 2012, the Board of Directors of the Company adopted the Trecora Resources Stock and Incentive Plan (the “Plan”) subject to the approval of Company’s shareholders.  Shareholders approved the Plan at the 2012 Annual Meeting of Shareholders on June 6, 2012.  We filed Form S-8 to register the 1,500,000 shares allocated to the Plan on May 8, 2013.

On April 7, 2008, the Board of Directors of the Company adopted the Stock Option Plan for Key Employees, as well as, the Non-Employee Director Stock Option Plan (hereinafter collectively referred to as the “Stock Option Plans”), subject to the approval of Company’s shareholders.  Shareholders approved the Stock Option Plans at the 2008 Annual Meeting of Shareholders on July 10, 2008.  We filed Form S-8 to register the 1,000,000 shares allocated to the Stock Option Plans on October 23, 2008.

Compensation expense recognized in connection with the following issuances was approximately $1,645,000, $2,063,000, and $1,214,000 for the years ended December 31, 2015, 2014, and 2013, respectively.

There were no stock options or warrant awards issued during 2015.

A summary of all 2014 issuances is as follows:

On February 21, 2014, we awarded 10 year options to various employees for 500,000 shares.  These options have an exercise price equal to the closing price of the stock on February 21, 2014, which was $12.26 and vest in 25% increments over a 4 year period.  Compensation expense recognized during 2015 and 2014 was approximately $1,108,000 and $955,000, respectively.  The fair value of the options granted was calculated using the Black-Scholes option valuation model with the following assumptions:

Expected volatility
84%
Expected dividends
None
Expected term (in years)
6.25
Risk free interest rate
1.95%

A summary of all 2013 issuances is as follows:

On May 29, 2013, we awarded 10 year options to Simon Upfill-Brown for 90,000 shares.  These options have an exercise price equal to the closing price of the stock on May 29, 2013, which was $7.71 and vest in 25% increments over a 4 year period.  Compensation expense recognized during 2015, 2014 and 2013 in connection with this award was approximately $ 126,000, $126,000 and $84,000, respectively.  The fair value of the options granted was calculated using the Black-Scholes option valuation model with the following assumptions:

Expected volatility
85%
Expected dividends
None
Expected term (in years)
6.25
Risk free interest rate
1.33%

On February 1, 2013, we issued a warrant for the purchase of 100,000 shares of common stock to Genesis Select Corporation (“Genesis”) at a strike price of $10.00 per share.  The term of the warrant is 5 years with 50% vesting in equal increments of 1/12th each calendar month throughout the first year.  The remaining 50% was scheduled to vest in equal increments of 1/36th each calendar month over years 2 through 4 contingent upon continuous investor relations service under the consulting agreement with Genesis.  Our agreement with Genesis was terminated effective September 30, 2014; therefore, no additional amounts will vest going forward.  Investor relations expense recognized in connection with this warrant was approximately $79,000 and $180,000 in 2014 and 2013, respectively.

 
F-28


A summary of all 2012 issuances is as follows:

On November 15, 2012, we awarded 10 year options to Director Gary Adams for 100,000 shares.  These options have an exercise price equal to the closing price of the stock on November 15, 2012, which was $7.14 and vest in 20% increments over a 5 year period.  Compensation expense recognized during 2015, 2014, and 2013 in connection with this award was approximately $ 120,000 each year.  The fair value of the options granted was calculated using the Black-Scholes option valuation model with the following assumptions:

Expected volatility
87%
Expected dividends
None
Expected term (in years)
6.5
Risk free interest rate
0.92%

A summary of all 2011 issuances is as follows:

On May 20, 2011, we awarded 10 year options to Director Joseph Palm for 19,333 shares with the intent to increase the aggregate grant to 100,000 shares as they become available.  The initial grant of 19,333 options has an exercise price equal to the closing price of the stock on May 20, 2011, which was $3.90 and vest after 1 year.  Compensation expense recognized during 2015, 2014, and 2013 in connection with this award was approximately $0.  On September 25, 2011, we awarded 10 year options to Director Joseph Palm for 80,000 shares with an exercise price equal to the closing price of the stock on September 23, 2011, (the latest closing date available) which was $3.52.  These options vest over 4.67 years with the first 20,000 vesting on May 19, 2013, and subsequent 20,000 share lots vesting each anniversary of that date subsequent until entirely vested.  Compensation expense recognized for 2015, 2014 and 2013 was approximately $65,000 each year.

On May 2, 2011, we awarded 10 year options to Director John Townsend for 100,000 shares.  These options have an exercise price equal to the closing price of the stock on May 2, 2011, which was $4.09 and vest in 20% increments over a 5 year period.  Compensation expense recognized during 2015, 2014, and 2013 in connection with this award was approximately $80,000 each year.

On January 12, 2011, we awarded 10 year options to key employees for 391,000 shares.  These options have an exercise price equal to the closing price of the stock on January 12, 2011, which was $4.86 and vest in 25% increments over a 4 year period.  Compensation expense recognized during 2015, 2014, and 2013 in connection with this award was approximately $40,000, $475,000 and $475,000, respectively.

The fair value of the 2011 options granted was calculated using the Black-Scholes option valuation model with the following range of assumptions:

Expected volatility
96% to 413%
Expected dividends
None
Expected term (in years)
5-10
Risk free interest rate
1.26% to 3.34%

A summary of all 2010 issuances is as follows:

In February 2010 we awarded 500,000 options to non-employee directors for their service during 2010 subject to attendance and service requirements.  These options vest over a 5 year period.  The exercise price of these options is $2.82 based upon the closing price on February 23, 2010.  Directors’ fee expense recognized during 2015, 2014 and 2013 in connection with this award was approximately $9,000, $66,000 and $113,000, respectively.

 
F-29


The fair value of the 2010 options granted was calculated using the Black-Scholes option valuation model with the following range of assumptions:

Expected volatility
338% to 467%
Expected dividends
None
Expected term (in years)
5-10
Risk free interest rate
2.37% to 3.68%

A summary of unvested 2009 issuances is as follows:

On July 2009 we awarded two stock options to Mr. Hatem El Khalidi and his wife, Ingrid El Khalidi, tied to the performance of AMAK as follows: (1) an option to purchase 200,000 shares of the Company’s common stock with an exercise price of $3.40 per share, equal to the closing sale price of such a share as reported on the Nasdaq National Market System on July 2, 2009, provided that said option may not be exercised until such time as the first shipment of ore from the Al Masane mining project is transported for commercial sale by AMAK, and further that said option shall terminate and be immediately forfeited if not exercised on or before June 30, 2012; and (2) an option to purchase 200,000 shares of the Company’s common stock with an exercise price equal to the closing sale price of such a share as reported on the Nasdaq Stock Market on July 2, 2009, provided that said option may not be exercised until such time as the Company receives its first cash dividend distribution from AMAK, and further that said option shall terminate and be immediately forfeited if not exercised on or before June 30, 2019.  Compensation expense of approximately $97,000, $97,000 and $97,000 was recognized during the years ended December 31, 2015, 2014, and 2013, respectively, related to the options awarded to Mr. El Khalidi. Approximately $413,000 was reversed during 2012 due to the performance condition associated with 200,000 shares in options not being met as required by the terms of the award by June 30, 2012.  Previously, on May 9, 2010, the Board of Directors determined that Mr. El Khalidi forfeited all options and other retirement benefits when he made various demands against the Company and other AMAK Saudi shareholders which would benefit him personally and were not in the best interests of the Company and its shareholders.  As discussed in Note 15 we are currently in litigation with Mr. El Khalidi and in connection therewith, we are currently reviewing our legal right to withdraw the options and benefits.  However, as of December 31, 2015, the options vesting upon a cash dividend distribution from AMAK continue to be shown as outstanding.

A summary of the status of the Company’s stock option and warrant awards is presented below:

   
Stock Options and Warrants
   
Weighted
Average
Exercise
Price
Per Share
   
Weighted
Average
Remaining
Contractual
Life
   
Intrinsic
Value
(in thousands)
 
Outstanding at December 31, 2014
    1,598,191     $ 7.16              
   Granted
    -       -              
   Expired
    -       -              
   Exercised
    (221,754 )     3.94              
   Forfeited
    -       -              
Outstanding at December 31, 2015
    1,376,437     $ 7.68       6.1     $ 6,483  
Expected to vest
    522,500     $ 10.63       7.8     $ 920  
Exercisable at December 31, 2015
    653,937     $ 6.63       5.6     $ 3,767  

The aggregate intrinsic value of options was calculated as the difference between the exercise price of the underlying awards and the quoted price of our common stock.  At December 31, 2015, options and warrants to purchase approximately 1.4 million shares of common stock were in-the-money.


F-30

 
The weighted average grant-date fair value per share of options granted during the years 2015, 2014, and 2013 was $0, $12.26 and $7.71, respectively.  During 2015, 2014 and 2013 the aggregate intrinsic value of options exercised was approximately $2,300,000, $1,600,000 and $142,000 respectively, determined as of the date of option exercise.

The Company received approximately $123,000, $91,000 and $60,000 in cash from the exercise of options during 2015, 2014 and 2013, respectively.  Some of the options were exercised via a net transaction.  The tax benefit realized from the exercise was insignificant.

A summary of the status of the Company’s non-vested options that are expected to vest is presented below:

   
Shares
   
Weighted
Average
Grant-Date
Fair Value
Per Share
 
Non-vested at January 1, 2015
    825,250     $ 9.59  
   Granted
    -       -  
   Forfeited
    -       -  
   Vested
    (325,250 )     7.79  
Non-vested at December 31, 2015
    500,000     $ 10.76  

Total fair value of options that vested during 2014 was approximately $1,496,000.

As of December 31, 2015, there was approximately $2.9 million of unrecognized compensation costs related to non-vested share-based compensation that is expected to be recognized over a weighted average period of 2.0 years.

The Company expects to issue shares upon exercise of options and warrants from its authorized but unissued common stock.

 
NOTE 17 – INCOME TAXES

The provision for income taxes consisted of the following:

   
Year ended December 31,
 
   
2015
   
2014
   
2013
 
   
(thousands of dollars)
 
Current federal provision
  $ 4,062     $ 8,756     $ 6,748  
Current state provision
    285       296       233  
                         
Deferred federal provision (benefit)
    5,367       (1,893 )     1,173  
Deferred state provision (benefit)
    50       (12 )     (7 )
                         
Income tax expense
  $ 9,764     $ 7,147     $ 8,147  


F-31


The difference between the effective tax rate in income tax expense and the Federal statutory rate of 35% for the years ended December 31, 2015, 2014, and 2013, is as follows:

   
2015
   
2014
   
2013
 
   
(thousands of dollars)
 
Income taxes at U.S. statutory rate
  $ 9,927     $ 7,952     $ 9,675  
State taxes, net of federal benefit
    230       181       139  
Permanent and other items
    (393 )     (915 )     (644 )
Increase (decrease) in valuation allowance
    -       (71 )     (1,023 )
    Total tax expense
  $ 9,764     $ 7,147     $ 8,147  

The Texas margin tax rate was reduced in a legislative reduction effective January 1, 2015.  Permanent differences are primarily due to the Federal manufacturer’s deduction and stock options.

Tax effects of temporary differences that give rise to significant portions of federal and state deferred tax assets and deferred tax liabilities were as follows:

   
December 31,
 
   
2015
   
2014
 
   
(thousands of dollars)
 
Deferred tax liabilities:
           
  Plant, pipeline and equipment
  $ (14,996 )   $ (8,352 )
  Intangible assets
    (284 )     -  
  Other assets
    (14 )     -  
  Investment in AMAK
    ( 2,522 )     ( 4,382 )
  Total deferred tax liabilities
  $ (17,816 )   $ (12,734 )
                 
Deferred tax assets:
               
  Accounts receivable
    283       276  
  Inventory
    1,785       1,018  
  Mineral interests
    376       376  
  Unrealized loss on swap agreements
    62       196  
  Post-retirement benefits
    330       327  
  Stock-based compensation
    969       1,705  
  Intangible assets
    -       229  
  Deferred revenue
    -       164  
    Gross deferred tax assets
    3,805       4,291  
  Valuation allowance
    (376 )     (376 )
  Total net deferred tax assets
  $ 3,429     $ 3,915  
    Net deferred tax liabilities
  $ (14,387 )   $ (8,819 )

The current and non-current classifications of the deferred tax balances are as follows:

   
2015
   
2014
 
   
(thousands of dollars)
 
Current:
           
Deferred tax asset
  $ 2,116     $ 1,652  
Non-current:
               
Deferred tax assets
    4,637       3,269  
Deferred tax liability
    (20,764 )     (13,364 )
Valuation allowance
    (376 )     (376 )
Non-current deferred tax liability, net
    (16,503 )     (10,471 )
Total deferred liabilities, net
  $ (14,387 )   $ (8,819 )


F-32

 
We have provided a valuation allowance in 2015 and 2014 against certain deferred tax assets because of uncertainties regarding their realization.  The 2014 decrease in the valuation allowance of $71,000 is due largely to changes in our environmental accrual.  The 2013 decrease in the valuation allowance of $1,023,000 is due largely to changes in our investment in AMAK.

We had no Saudi Arabian income tax liability in 2015, 2014, or 2013.

We file an income tax return in the U.S. federal jurisdiction and a margin tax return in Texas. Tax returns for various jurisdictions remain open for examination for the years 2011 through 2014.

NOTE 18 – SEGMENT INFORMATION

As discussed in Note 1, in October 2014 we began operating in two business segments; petrochemical and specialty waxes.  We operate through business segments according to the nature and economic characteristics of our products as well as the manner in which the information is used internally by our key decision maker, who is our Chief Executive Officer.  The accounting policies of the reporting segments are the same as those described in Note 2.

Our petrochemical segment includes SHR and GSPL.  Our specialty wax segment includes TC.  We also separately identify our corporate overhead and investing which includes financing and administrative activities such as legal, accounting, consulting, investor relations, officer and director compensation, corporate insurance, and other administrative costs.

The table below reflects full year 2015.

   
Year Ended December 31, 2015
 
   
Petrochemical
   
Specialty Wax
   
Corporate
   
Consolidated
 
   
(in thousands)
 
Net revenues
  $ 218,233     $ 23,743     $ -     $ 241,976  
Operating profit before depreciation and amortization
    47,565       4,549       (7,013 )     45,101  
Operating profit (loss)
    43,081       (1 )     (7,039 )     36,041  
Depreciation and amortization
    4,484       4,550       26       9,060  
Capital expenditures
    24,358       6,889       -       31,247  

      Year Ended December 31, 2015
           
      Petrochemical         Specialty Wax        Corporate        Eliminations        Consolidated  
      (in thousands)  
Goodwill and intangible assets, net
  $ -     $ 46,347     $ -     $ -     $ 46,347  
Total assets
    196,378       86,076       98,728       (122,371)       258,811  

The table below reflects only fourth quarter 2014 transactions for TC since that is the time period affected by segment reporting.

   
Year Ended December 31, 2014
 
   
Petrochemical
   
Specialty Wax
   
Corporate
   
Consolidated
 
   
(in thousands)
 
Net revenues
  $ 284,345     $ 5,298     $ -     $ 289,643  
Operating profit before depreciation and amortization
    37,083       16       (6,412 )     30,687  
Operating profit (loss)
    33,019       (1,125 )     (6,412 )     25,482  
Depreciation and amortization
    4,064       1,612       -       5,676  
Capital expenditures
    13,986       780       -       14,766  


F-33


      Year Ended December 31, 2014
      Petrochemical          Specialty Wax        Corporate        Eliminations        Consolidated   
    (in thousands)
Goodwill and intangible assets, net
  $ -     $ 47,985     $ -     $ -     $ 47,985  
Total assets
    172,945       79,135       99,360       (119,366 )     232,074  

NOTE 19 - NET INCOME PER COMMON SHARE

   
Year ended December 31,
 
   
2015
   
2014
   
2013
 
   
(thousands of dollars)
 
                   
Net income
  $ 18,598     $ 15,571     $ 19,498  
                         
Basic earnings per common share:
                       
    Weighted average shares outstanding
    24,370       24,188       24,115  
                         
    Per share amount (dollars)
  $ 0.76     $ 0.64     $ 0.81  
Diluted earnings per common share:
                       
    Weighted average shares outstanding
    25,181       24,896       24,745  
                         
    Per share amount (dollars)
  $ 0.74     $ 0.63     $ 0.79  

Weighted average shares-denominator
  basic computation
    24,370       24,188       24,115  
Unvested restricted stock grant
    141       -       -  
Effect of dilutive stock options
    670       708       630  
Weighted average shares, as adjusted
  denominator diluted computation
    25,181       24,896       24,745  

At December 31, 2015, 2014, and 2013, 1,376,437, 1,598,191 and 1,326,360 potential common stock shares, respectively, were issuable upon the exercise of options and warrants.

The earnings per share calculations for the periods ended December 31, 2015, 2014, and 2013, include 300,000 shares of the Company that are held in the treasury of TOCCO.

NOTE 20 - QUARTERLY RESULTS OF OPERATIONS (UNAUDITED)

The quarterly results of operations shown below are derived from unaudited financial statements for the eight quarters ended December 31, 2015 (in thousands, except per share data):

   
Year Ended December 31, 2015
 
   
First Quarter
   
Second Quarter
   
Third Quarter
   
Fourth Quarter
   
Total
 
                               
Revenues
  $ 55,143     $ 59,350     $ 66,938     $ 60,545     $ 241,976  
Gross profit
    15,713       15,184       16,625       11,847       59,369  
Net income
    5,784       6,374       5,318       1,122       18,598  
Basic EPS
  $ 0.24     $ 0.26     $ 0.21     $ 0.05     $ 0.76  
Diluted EPS
  $ 0.23     $ 0.25     $ 0.21     $ 0.05     $ 0.74  


F-34


Year Ended December 31, 2014
 
   
First Quarter
   
Second Quarter
   
Third Quarter
   
Fourth Quarter
   
Total
 
                               
Revenues
  $ 64,100     $ 74,553     $ 76,917     $ 74,073     $ 289,643  
Gross profit
    8,714       11,700       13,044       12,285       45,743  
Net income
    2,599       5,000       5,774       2,198       15,571  
Basic EPS
  $ 0.11     $ 0.20     $ 0.24     $ 0.09     $ 0.64  
Diluted EPS
  $ 0.11     $ 0.20     $ 0.23     $ 0.09     $ 0.63  


NOTE 21 – RELATED PARTY TRANSACTIONS

Consulting fees of approximately $25,000, $52,000 and $98,000 were incurred during 2015, 2014, and 2013, respectively from IHS Global FZ LLC of which Company Director Gary K. Adams holds the position of Chief Advisor – Chemicals.  At December 31, 2015, and 2014, we had no outstanding liability payable to IHS Global FZ LLC.

NOTE 22 – DERIVATIVE INSTRUMENTS
 
Commodity Financial Instruments

Hydrocarbon based manufacturers, such as SHR, are significantly impacted by changes in feedstock and natural gas prices.  Not considering derivative transactions, feedstock and natural gas used for the years ended December 31, 2015, 2014, and 2013, represented approximately 69.3%, 78.0% and 80.6% of SHR’s operating expenses, respectively.

On February 26, 2009, the Board of Directors rescinded its original commodity trading resolution from 1992 and replaced it with a new resolution.  The 2009 resolution allows the Company to establish a commodity futures account for the purpose of maximizing our resources and reducing risk as pertaining to our purchases of natural gas and feedstock for operational purposes by employing a four step process. This process, in summary, includes, (1) education of employees who are responsible for carrying out the policy, (2) adoption of a derivatives policy by the Board explaining the objectives for use of derivatives including accepted risk limits, (3) implementation of a comprehensive derivative strategy designed to clarify the specific circumstances under which we will use derivatives, and (4) establishment and maintenance of a set of internal controls to ensure that all of the derivatives transactions taking place are authorized and in accord with the policies and strategies that have been enacted.  On August 31, 2009, the Company adopted a formal risk management policy which incorporates the above process, as well as, established a “hedge committee” for derivative oversight.

We endeavor to acquire feedstock and natural gas at the lowest possible cost.  The primary feedstock (natural gasoline) is traded over the counter and not on organized futures exchanges.  Financially settled instruments (fixed price swaps) are the principal vehicle used to give some predictability to feed prices. We do not purchase or hold any derivative financial instruments for trading purposes.

The following tables detail (in thousands) the impact the feedstock and natural gas instruments had on the financial statements:

   
December 31,
 
   
2015
   
2014
   
2013
 
                   
Realized gain (loss)
  $ (180 )   $ (452 )   $ 40  
Unrealized gain (loss)
    180       (132 )     (48 )
Net loss
  $ -     $ (584 )   $ (8 )


F-35


December 31,
 
   
2015
   
2014
 
             
Fair value of derivative liability
  $ -     $ 180  

Realized and unrealized gains / (losses) are recorded in Cost of Petrochemical Product Sales and Processing for the years ended December 31, 2015, 2014, and 2013.

 
Interest Rate Swaps

On March 21, 2008, SHR entered into a pay-fixed, receive-variable interest rate swap agreement with Bank of America related to the $10.0 million (later increased to $14 million) term loan secured by plant, pipeline and equipment. The effective date of the interest rate swap agreement was August 15, 2008, and terminates on December 15, 2017.  The notional amount of the interest rate swap was $2.75 million at December 31, 2015.  We receive credit for payments of variable rate interest made on the term loan at the loan’s variable rates, which are based upon the London InterBank Offered Rate (LIBOR), and pay Bank of America an interest rate of 5.83% less the credit on the interest rate swap.  We originally designated the transaction as a cash flow hedge according to ASC Topic 815, Derivatives and Hedging.  Beginning on August 15, 2008, the derivative instrument was reported at fair value with any changes in fair value reported within other comprehensive income (loss) in the Company’s Statement of Stockholders’ Equity.  We entered into the interest rate swap to minimize the effect of changes in the LIBOR rate.

The following tables detail (in thousands) the impact the agreement had on the financial statements:

   
December 31,
 
   
2015
   
2014
   
2013
 
Accumulated Other Comprehensive Income (Loss)
                 
    Cumulative loss
  $ -     $ -     $ (563 )
    Deferred tax benefit
    -       -       197  
    Net cumulative loss
  $ -     $ -     $ (366 )
                         
Interest expense reclassified from other
  comprehensive income (loss)
  $ -     $ 378     $ 301  

   
December 31,
 
   
2015
   
2014
 
             
Fair value of derivative liability
  $ 177     $ 378  

Due to the new debt agreements associated with the Acquisition, we believe that the hedge is no longer entirely effective.  Due to the time required to make the determination and the immateriality of the hedge, we began treating the interest rate swap as ineffective as of October 1, 2014, and the unrealized loss associated with the swap of approximately $378,000 was recognized in the Statement of Income.

NOTE 23- POST-RETIREMENT OBLIGATIONS

In January 2008 an amended retirement agreement, replacing the February 2007 agreement, was entered into with Hatem El Khalidi. The amended agreement provided $6,000 per month in benefits to Mr. El Khalidi upon his retirement for the remainder of his life. Additionally, upon his death $4,000 per month would be paid to his surviving spouse for the remainder of her life. A health insurance benefit was also to be provided.  An additional $382,000 was accrued in January 2008 for the increase in benefits. A liability of approximately $911,000 based upon an annuity single premium value contract was outstanding at December 31, 2015, and was included in post-retirement benefits.  Mr. El Khalidi retired effective June 30, 2009.  As of December 31, 2015, no payments have been made pursuant to this agreement.


F-36

 
In June 2009 the Company’s Board of Directors awarded Mr. El Khalidi a retirement bonus in the amount of $31,500 for 42 years of service.  While there is no written policy regarding retirement bonus compensation, the Company has historically awarded all employees (regardless of job position) a retirement bonus equal to $750 for each year of service.  Since Mr. El Khalidi was employed by the Company for 42 years, the Board of Directors voted to award him a $31,500 retirement bonus, consistent with that provided to all other retired employees. This amount was outstanding at December 31, 2015, and was included in post-retirement benefits.

On May 9, 2010, the Board of Directors terminated the retirement agreement, options, retirement bonus, and any outstanding directors’ fees due to Mr. El Khalidi; however, due to the litigation discussed in Note 15, all amounts remain outstanding until a resolution is achieved.


F-37


TRECORA RESOURCES AND SUBSIDIARIES

VALUATION AND QUALIFYING ACCOUNTS
 
Three years ended December 31, 2015

Description
 
Beginning
balance
   
Charged
(credited)
to earnings
   
Deductions
   
Ending
balance
 
ALLOWANCE FOR DEFERRED
  TAX ASSET
                       
                         
December 31, 2013
    1,470,034       (1,023,115 )     -       446,919  
December 31, 2014
    446,919       (122,500 )     51,618       376,037  
December 31, 2015
    376,037       -       -       376,037  


Description
 
Beginning
balance
   
Charged
to earnings
   
Deductions
   
Ending
balance
 
ALLOWANCE FOR DOUBTFUL
  ACCOUNTS
                       
                         
December 31, 2013
    210,000       -       -       210,000  
December 31, 2014
    210,000       -       -       210,000  
December 31, 2015
    210,000       -       -       210,000  


F-38


AL MASANE AL KOBRA MINING COMPANY

Financial Statements
with
Report of Independent Registered Public Accounting Firm

December 31, 2015, 2014, and 2013

 
F-39 

 
AL MASANE AL KOBRA MINING COMPANY

Table of Contents


Page
   
Report of Independent Registered Public Accounting Firm
1
   
Financial Statements:
 
   
   Balance Sheets
2 - 3
   
   Statements of Operations
4
   
   Statements of Changes in Shareholders’ Equity
5
   
   Statements of Cash Flows
6 - 7
   
Notes to Financial Statements
8 - 26


REPORT OF INDEPENDENT REGISTERED PUBLIC ACCOUNTING FIRM

To the Board of Directors and
Shareholders of Al Masane Al Kobra Mining Company
Najran, Kingdom of Saudi Arabia

We have audited the accompanying balance sheets of Al Masane Al Kobra Mining Company (the Company) as of December 31, 2015 and 2014, and the related statements of operations, shareholders’ equity, and cash flows for each of the years in the three-year period ended December 31, 2015. The Company’s management is responsible for these financial statements. Our responsibility is to express an opinion on these financial statements based on our audits.

We conducted our audits in accordance with the standards of the Public Company Accounting Oversight Board (United States). Those standards require that we plan and perform the audits to obtain reasonable assurance about whether the financial statements are free of material misstatement. The Company is not required to have, nor were we engaged to perform, an audit of its internal control over financial reporting. Our audits included consideration of internal control over financial reporting as a basis for designing audit procedures that are appropriate in the circumstances, but not for the purpose of expressing an opinion on the effectiveness of the Company’s internal control over financial reporting. Accordingly, we express no such opinion. An audit also includes examining, on a test basis, evidence supporting the amounts and disclosures in the financial statements, assessing the accounting principles used and significant estimates made by management, as well as evaluating the overall financial statement presentation. We believe that our audits provide a reasonable basis for our opinion.

In our opinion, the financial statements referred to above present fairly, in all material respects, the financial position of Al Masane Al Kobra Mining Company as of December 31, 2015 and 2014, and the results of its operations and its cash flows for each of the years in the three-year period ended December 31, 2015 in conformity with accounting principles generally accepted in the United States of America.

As discussed in Notes 1 and 3 to the financial statements, the Company shut down their mining operations in the fourth quarter of 2015 with plans on recommencing production in the fourth quarter of 2016. Our opinion is not modified with respect to that matter.


Mamdouh Al Majed Certified Accounts
Riyadh, Kingdom of Saudi Arabia
March 6, 2016
 

- 1 -


AL MASANE AL KOBRA MINING COMPANY
             
Balance Sheets


December 31,
 
   
2015
   
2014
 
   
(Expressed in Saudi Riyals)
 
ASSETS
           
Current assets:
           
Cash and cash equivalents
    30,413,832       2,980,169  
Accounts receivable
    28,351,618       9,096,731  
Inventories
    31,630,132       28,321,222  
Due from shareholders
    298,562       179,546  
Advances to contractors and other
    7,096,846       15,271,913  
                 
Total current assets
    97,790,990       55,849,581  
                 
Non-current assets:
               
Deferred finance costs, net
    14,675,567       16,823,211  
Property and equipment, net
    739,935,227       749,328,973  
Development costs, net
    209,680,505       230,570,684  
Deferred mine closure costs
    8,934,000       10,050,750  
                 
Total non-current assets
    973,225,299       1,006,773,618  
                 
 
    1,071,016,289       1,062,623,199  
                 
LIABILITIES AND SHAREHOLDERS’ EQUITY
               
Current liabilities:
               
Long-term debt, current portion
    -       30,000,000  
Pre-export advance payments
    9,150,880       3,823,258  
Accounts payable and accrued liabilities
    74,868,227       47,762,021  
Zakat and income tax liability
    1,254,419       -  
Capital lease obligations, current portion
    -       4,792,531  
                 
Total current liabilities
    85,273,526       86,377,810  
                 
Non-current liabilities
               
Provision for mine closure costs
    14,488,028       13,998,094  
Long-term debt, net of current portion
    310,000,000       229,808,000  
End-of-service indemnities
    1,745,433       1,543,015  
Deferred income taxes
    8,881,490       8,145,274  
                 
Total non-current liabilities
    335,114,951       253,494,383  


See accompanying notes to financial statements.
 
- 2 -


AL MASANE AL KOBRA MINING COMPANY
             
 Balance Sheets - (Continued)


December 31,
 
   
2015
   
2014
 
   
(Expressed in Saudi Riyals)
 
Commitments and contigencies
           
             
Shareholders' equity
           
Share capital
    740,000,000       550,000,000  
Share premium
    -       190,000,000  
Accumulated deficit
    (89,372,188 )     (17,248,994 )
                 
Total shareholders' equity
    650,627,812       722,751,006  
                 
 
    1,071,016,289       1,062,623,199  


See accompanying notes to financial statements.
 
- 3 -


AL MASANE AL KOBRA MINING COMPANY
                   
Statements of Operations


December 31,
 
   
2015
   
2014
   
2013
 
   
(Expressed in Saudi Riyals)
       
                   
Revenues
    190,290,543       237,374,741       393,713,017  
                         
Costs of revenues
    229,428,965       223,784,222       311,658,686  
                         
Gross margin
    (39,138,422 )     13,590,519       82,054,331  
 
                       
General and
                       
administrative expenses
    24,633,457       26,119,478       25,817,039  
                         
Income (loss) from operations
    (63,771,879 )     (12,528,959 )     56,237,292  
 
                       
Other income (expense)
                       
Finance charges
    (6,360,680 )     (10,481,803 )     (14,472,280 )
Other income (expense)
    -       152,053       (793,782 )
                         
      (6,360,680 )     (10,329,750 )     (15,266,062 )
                         
Income (loss) before taxes
    (70,132,559 )     (22,858,709 )     40,971,230  
                         
Provision for zakat and income taxes
    (1,990,635 )     (2,877,516 )     (5,267,758 )
                         
Net income (loss)
    (72,123,194 )     (25,736,225 )     35,703,472  


See accompanying notes to financial statements.
 
- 4 -


AL MASANE AL KOBRA MINING COMPANY
                         
Statements of Shareholders' Equity


(Expressed in Saudi Riyals)
             
               
Retained
       
               
Earnings
       
   
Share
   
Share
   
(Accumulated
       
   
Capital
   
Premium
   
Deficit)
   
Total
 
                         
Balance at December 31, 2012
    500,000,000       90,000,000       (27,216,241 )     562,783,759  
 
                               
Capital increase and sale of shares
    50,000,000       100,000,000       -       150,000,000  
                                 
Net income
    -       -       35,703,472       35,703,472  
                                 
Balance at December 31, 2013
    550,000,000       190,000,000       8,487,231       748,487,231  
                                 
Net loss
    -       -       (25,736,225 )     (25,736,225 )
                                 
Balance at December 31, 2014
    550,000,000       190,000,000       (17,248,994 )     722,751,006  
                                 
Conversion in share premium to
                               
    share capital
    190,000,000       (190,000,000 )     -       -  
                                 
Net loss
    -       -       (72,123,194 )     (72,123,194 )
                                 
Balance at December 31, 2015
    740,000,000       -       (89,372,188 )     650,627,812  

See accompanying notes to financial statements.
 
- 5 -


AL MASANE AL KOBRA MINING COMPANY
                   
Statements of Cash Flows


December 31,
 
   
2015
   
2014
   
2013
 
   
(Expressed in Saudi Riyals)
       
Cash flows from operating activities:
                 
Net income (loss)
    (72,123,194 )     (25,736,225 )     35,703,472  
Adjustments to reconcile net income (loss) to net cash
                       
provided by operating activities:
                       
Depreciation and amortization
    87,183,080       88,903,533       91,340,865  
Accretion of deferred mine closure costs
    489,934       473,366       457,357  
Amortization of deferred finance costs
    2,147,644       2,641,114       4,724,634  
Loss (gain) on disposal of property and equipment
    -       (152,053 )     716,003  
Deferred income taxes
    736,216       2,877,516       5,267,758  
Changes in operating assets and liabilities:
                       
Accounts receivable
    (19,254,887 )     1,517,429       691,022  
Inventories
    (3,308,910 )     (19,544,150 )     48,550,634  
Advances to contractors and other
    8,175,068       10,887,630       (5,481,850 )
Accounts payable and accrued liabilities
    27,106,206       1,740,228       (9,813,050 )
Zakat and income tax liability
    1,254,419       -       -  
Pre-export advance payment
    5,327,622       3,823,258       (58,395,180 )
End-of-service indemnities
    202,418       147,685       319,546  
                         
Net cash provided by operating activities
    37,935,616       67,579,331       114,081,211  
                         
Cash flows from investing activities:
                       
Additions to property and equipment
    (55,782,406 )     (89,228,705 )     (101,928,773 )
Cash received from disposal of property and equipment
    -       -       1,410,180  
                         
Net cash used in investing activities
    (55,782,406 )     (89,228,705 )     (100,518,593 )
                         

See accompanying notes to financial statements.
 
- 6 -


AL MASANE AL KOBRA MINING COMPANY
                   
Statements of Cash Flows - (Continued)


December 31,
 
   
2015
   
2014
   
2013
 
   
(Expressed in Saudi Riyals)
       
Cash flows from financing activities:
                 
Deferred finance costs
    -       (1,725,000 )     (4,202,000 )
Issuance of share capital and premium
    -       -       150,000,000  
Payments on capital lease obligations
    (4,792,531 )     (18,432,290 )     (18,872,496 )
Payments on long-term debt
    -       (20,000,000 )     (206,250,000 )
Proceeds from long-term debt
    50,192,000       -       138,120,000  
Net advances from (repayments to) shareholders
    (119,016 )     (2,290,152 )     (28,238,159 )
                         
Net cash provided by (used in) financing activities
    45,280,453       (42,447,442 )     30,557,345  
                         
Net change in cash and cash equivalents
    27,433,663       (64,096,816 )     44,119,963  
                         
Cash and cash equivalents, beginning of period
    2,980,169       67,076,985       22,957,022  
                         
Cash and cash equivalents, end of period
    30,413,832       2,980,169       67,076,985  
                         
See Note 15 for supplemental cash flow information


See accompanying notes to financial statements.
 
- 7 -

 
AL MASANE AL KOBRA MINING COMPANY
 
Notes to Financial Statements


Note 1 – Organization and Business

Organization
Al Masane Al Kobra Mining Company is a Saudi Arabian closed joint stock company approved by the Minister of Commerce and Industry Decree Number 247/Q dated 9/10/1428 (October 21, 2007) and registered in Jeddah under Commercial Registration No. 4030175345 on 7/1/1429 (January 16, 2008). During 2015, the head office was moved from Jeddah to Najran. Accordingly, Najran Commercial Registration No. 5950017523 dated 03/11/1431H (October 11, 2010) was modified to be the main Commercial Registration. Unless the context requires otherwise, references to “we”, “us”, “our”, “AMAK”, and the “Company” are intended to mean Al Masane Al Kobra Mining Company. All amounts are expressed in Saudi Riyals (SR) unless otherwise noted.

During 2009 the authorized capital of the Company was 450,000,000 consisting of 45 million shares of 10 each of which 50% were issued for cash. The remaining 50% were issued for the contribution of mining rights and assets from Trecora Resources (Trecora) subject to Trecora’s liability for a loan in the amount of 41,250,000 due to the Ministry of Finance and National Economy. The mining rights in Al Masane mine were originally granted by Royal Decree Number M/17 effective 1/12/1413 (May 22, 1993) for a period of thirty years, with a right of renewal for a further period of twenty years to Trecora. The mining rights granted Trecora the right of exploitation in Al Masane mine located in Najran, Saudi Arabia, with an area of 44 square kilometers for a surface rental of 10,000 per square kilometer per year, i.e. 440,000 per year.  As  per  the  Ministry  of  Petroleum  and  Mineral  Resources  resolution  dated 13/9/1429   (13/9/2008)   and   the   ministry   subsequent   letter   dated   2/1/1430   (30/12/2008),   the aforementioned rights were transferred to us.

During 2011 the Company increased its authorized share capital by SR50,000,000 to SR500,000,000 and issued 5,000,000 shares of 10 each at a price of SR28 each resulting in a share premium of SR90,000,000. The entire 5,000,000 shares were issued for cash to Arab Mining Company (ARMICO) headquartered in Amman, Jordan.

During 2013 the Company increased its authorized share capital by SR50,000,000 to SR550,000,000 and issued 5,000,000 shares of 10 each at a price of SR30 each resulting in a share premium of SR100,000,000. The shares were issued for cash to existing shareholders.

During 2015 the Company increased its authorized share capital by SR190,000,000 to SR 740,000,000 and issued 19,000,000 shares of 10 each by transferring from share premium accounts.

 
- 8 -

 
Note 1 – Organization and Business – (Continued)

Organization - continued
Except for Trecora and ARMICO, all other shareholders are Saudi nationals or companies wholly owned by Saudi nationals. Our share capital is owned by the shareholders as follows:

   
Shares
   
Ownership
Percentage
   
Paid-In
Capital
 
                   
Saudi shareholders
    36,449,642       49.26       364,496,420  
Trecora (US Company)
    26,085,000       35.25       260,850,000  
ARMICO (Pan Arab Organization)
    11,465,358       15.49       114,653,580  
                         
      74,000,000       100.00       740,000,000  

Business and operations
Our principal activity is to produce zinc and copper concentrates and silver and gold doré as per the license Number 993/2 dated 16/7/1428 (July 31, 2007) issued by Saudi Arabian General Investment Authority (SAGIA). We commenced our commercial production on July 1, 2012. During 2015, we received a new mining lease for an area near our current mining area for the Guyan ancient mine.

On 16/11/1428 (November 26, 2007), while the Company was in the registration process, the Company signed a contract with China National Geological and Mining Corporation (CGM) for underground mine rehabilitation, pre-production activity, and on-going mine development/production and with Nesma & Partners Contracting Company Limited for engineering, procurement, construction, commissioning and hand over of the concentrator surface works and the related infrastructure facilities. The handover of these facilities was finalized on November 28, 2011. In late 2014, we renegotiated a more favorable plant operations and maintenance contract with CGM. CGM ran our mining operations until November 2015, at which time the Board of Directors cancelled the CGM contract and temporarily suspended operations of the Company. This planned, temporary shutdown of the facility was due to the continued depressed commodity price environment as well as needs for renovation and maintenance. We expect to resume operations in the fourth quarter of 2016. In February 2016, we entered into a new operating and rehabilitation contract under more favorable terms.


- 9 -


Note 1 – Organization and Business – (Continued)

During the renovation, our focus remains on improving recoveries overall and upgrading the precious metals circuit through the installation of SART (sulfidization, acidification, recycling, and thickening) modifications which are expected to lower chemical use, thereby reducing operating costs. In addition, processing of certain gold-bearing waste dumps from historical mining at the newly acquired Guyan mining license area may begin in the second quarter of 2016. An additional exploration program for the rest of the Guyan mining lease will commence shortly.


Note 2 - Summary of Significant Accounting Policies

The accompanying financial statements have been prepared using U.S. generally accepted accounting principles. The following is a summary of our significant accounting policies:

Subsequent events
We have evaluated events and transactions subsequent to the date of the financial statements for matters requiring recognition or disclosure in the financial statements. The accompanying financial statements consider events through March 6, 2016, the date on which the financial statements were available to be issued.

Cash and cash equivalents
We consider all highly-liquid investments purchased with an original maturity of three months or less to be cash equivalents.

Accounts receivable
We evaluate the collectability of our accounts receivable and the adequacy of the allowance for doubtful accounts based upon historical experience and any specific customer financial difficulties of which the Company becomes aware. During the years ended December 31, 2015, 2014, and 2013, we sold our concentrates and doré pursuant to a sales contract with one customer. No amounts have been written off for the years ended December 31, 2015, 2014, and 2013. In addition, we determined that an allowance for doubtful accounts was not necessary at December 31, 2015 and 2014.


- 10 -


Note 2 - Summary of Significant Accounting Policies - (Continued)

Inventories
The components of inventories include mill stockpiles, precious metal doré, chemicals, and mining supplies. Inventories are stated at the lower of weighted-average cost or market. Costs of mill stockpiles inventory include labor and benefits, supplies, energy, depreciation, depletion, amortization, and other necessary costs incurred with the extraction and processing of ore. Corporate general and administrative costs are not included in inventory costs.

Because it is generally impracticable to determine the minerals contained in mill stockpiles by physical count, reasonable estimation methods are employed. The quantity of material delivered to the mill stockpiles is based on surveyed volumes of mined material and daily production records. Expected mineral recovery rates from the mill stockpiles are determined by various metallurgical testing methods.

Property and equipment
Property and equipment is carried at cost less accumulated depreciation. Expenditures for replacements and improvements are capitalized. Costs related to periodic maintenance are expensed as incurred. Depletion of the mining assets is determined using the unit-of-production method based on total estimated proven and probable reserves. Depletion and amortization using the unit-of-production method is recorded upon extraction of the ore, at which time it is allocated to inventory cost and then included as a component of cost of goods sold. Other assets are depreciated on a straight-line basis over their estimated useful lives ranging from 3 to 20 years.

Borrowing costs that are directly attributable to the acquisition, construction or production of assets are capitalized as part of the cost of those assets. Assets under construction are capitalized in the construction in progress account. Upon completion, the cost of the related asset is transferred to the appropriate category of property and equipment.


- 11 -


Note 2 - Summary of Significant Accounting Policies - (Continued)

Development costs
Mineral exploration costs, as well as drilling and other costs incurred for the purpose of converting mineral resources to proven and probable reserves or identifying new mineral resources are charged to expense as incurred. Development costs are capitalized beginning after proven and probable reserves have been established. Development costs include costs incurred in mine pre-production activities undertaken to gain access to proven and probable reserves, including shafts, drifts, ramps, permanent excavations, infrastructure and removal of overburden. These costs are deferred net of the proceeds from the sale of any production during the development period and then amortized using an estimated unit-of-production method. If a mine is no longer considered economical, the accumulated costs are charged to the statement of operations in the year in which the determination is made.

Asset impairment
We review and evaluate our long-lived assets for impairment when events or changes in circumstances indicate that the carrying amounts may not be recoverable. Long-lived assets are evaluated for impairment under the two-step model. When events or circumstance suggest impairment of long-lived assets, estimated undiscounted future net cash flows are calculated using future estimated commodity prices, proven and probable reserves, and estimated net proceeds from the disposition of assets on retirement, less operating, sustaining capital, and reclamation costs. If it is determined that an impairment exists, an impairment loss is measured as the amount by which the asset carrying value exceeds its fair value. Fair value is generally determined using valuation techniques such as estimated future cash flows. Because the cash flows used to assess recoverability of our long-lived assets and measure fair value of our mining operations require us to make several estimates and assumptions that are subject to risk and uncertainty, changes in these estimates and assumptions could result in the impairment of our long-lived asset values.

We recorded no impairment losses during the years ended December 31, 2015, 2014 and 2013.

End-of-service indemnities
Employee end-of-service benefits are accrued for the benefit of employees under the terms and conditions of Saudi Labor Law and Regulations and their employment contracts. End-of-service indemnities are provided for and accrued in the financial statements based on the respective employees' salaries and length of service.

 
- 12 -


Note 2 - Summary of Significant Accounting Policies - (Continued)

Deferred finance costs
Deferred finance costs are primarily comprised of the Saudi Industrial Development Fund (SIDF) loan origination charges which are amortized over the period of the related loan which approximates the interest method. Deferred finance costs are shown net of accumulated amortization of SR13,399,433 and SR11,251,789 at December 31, 2015 and 2014, respectively. Amortization expense of deferred finance costs was approximately SR2,148,000, SR2,622,000, and SR3,166,000 for the years ended December 31, 2015, 2014, and 2013, respectively.

Foreign currency
Our functional currency is the Saudi Riyal (SR). In June 1986, the Saudi Riyal was officially pegged to the U.S. Dollar at a fixed exchange rate of 1 U.S. Dollar to 3.75 riyals. Foreign currency transactions are translated into Saudi Riyals at the rates of exchange prevailing at the time of the transactions. Monetary assets and liabilities denominated in foreign currencies at the balance sheet date are translated at the exchange rates prevailing at that date. Any gains and losses from settlement and translation of foreign currency transactions are included in the statement of operations. There were no material foreign-currency exchange gains or losses or translation adjustments during the years ended December 31, 2015, 2014, and 2013.

Leasing arrangements
We periodically lease operating equipment, facilities, and office buildings. Rentals payable under operating leases are charged to the statements of operations on a straight line basis over the term of the relevant lease. For any capital leases, the present value of future minimum lease payments at the inception of the lease is reflected as an asset and a liability in the balance sheet. Amounts due within one year are classified as short-term liabilities and the remaining balance as long-term liabilities. Finance charges are charged to the statement of operations. At December 31, 2015, we had no outstanding capital lease obligations.

Operating lease expense amounted to approximately SR696,000, SR867,000, and SR456,000 for the years ended December 31, 2015, 2014 and 2013, respectively.

Environmental costs
Environmental costs are expensed or capitalized, depending upon their future economic benefits. Accruals for such expenditures are recorded when it is probable that obligations have been incurred and the costs can reasonably be estimated. Ongoing compliance costs are expensed as incurred.


- 13 -

 
Note 2 - Summary of Significant Accounting Policies - (Continued)

Asset retirement obligations and costs
We record the fair value of our estimated asset retirement obligations (AROs) associated with tangible long-lived assets in the period in which the obligation is incurred. AROs associated with long-lived assets are those for which there is a legal obligation to settle under various laws, statues, or regulations. These obligations, which are initially estimated based on discounted cash flow estimates, are accreted to full value over time through charges to cost of revenues. In addition, asset retirement costs (ARCs) are capitalized as part of the related asset’s carrying value and are depreciated (primarily on a unit-of-production basis) over the asset’s respective useful life. Our AROs consist primarily of costs associated with mine reclamation and closure activities and are included in deferred mine closure costs on the accompanying balance sheets. At least annually, we review our ARO estimates for changes in the projected timing and changes in cost estimates and additional AROs incurred during the period.

Zakat and income tax
We are subject to the Regulations of the Directorate of Zakat and Income Tax (DZIT) in the Kingdom of Saudi Arabia. Under these regulations, Zakat is payable at 2.5% on the basis of the portion of our Zakat base attributable to our Saudi stockholders, and income tax is payable at 20% on the portion of our taxable income attributable to our non-Saudi stockholders. Zakat and income tax are provided on an accrual basis. Any difference in the estimate is recorded when the final assessment is approved, at which time the provision is cleared.

We account for deferred income taxes on non-Saudi owners utilizing an asset and liability method, whereby deferred tax assets and liabilities are recognized based on the tax effects of temporary differences between the financial statements and the income tax basis of assets and liabilities, as measured by the effective tax rate. When appropriate, we evaluate the need for a valuation allowance based on a more likely than not threshold to reduce deferred tax assets to estimated recoverable amounts.

We account for uncertain income tax positions using a threshold and measurement attribute for the financial statement recognition and measurement of a tax position taken or expected to be taken in a tax return. We report tax-related interest and penalties as a component of Zakat and income tax expense. We recognized no material adjustment for unrecognized income tax liabilities. Zakat and income tax returns for the years from 2009 to 2014 are currently under review with DZIT.

 
- 14 -


Note 2 - Summary of Significant Accounting Policies - (Continued)

Reclassifications
Certain reclassifications have been made to the prior periods to conform with current year presentation.

Revenue recognition
We sell our products pursuant to sales contracts entered into with a customer who acts as an intermediary and resells our products to end users. Revenue is recognized when title and risk of loss pass to the customer and when collectability is reasonably assured. The passing of title and risk of loss to the customer is based on terms of the sales contract, generally upon shipment or delivery of product.

Sales are recorded based on a provisional sales price or a final sales price calculated in accordance with the terms specified in the relevant sales contract. Under the long-established structure of sales agreements prevalent in the industry, the copper and zinc contained in concentrate is generally “provisionally” priced at the time of shipment. The provisional price received at the time of shipment is later adjusted to a “final” price based on quoted monthly average spot prices on the London Metal Exchange (LME) for a specified future month.  We record revenues at the time of shipment (when title and risk of loss pass) based on then-current LME prices, and we account for any changes between the sales price recorded at the time of shipment and subsequent changes in the LME prices through the date of final pricing as gains or losses from a derivative embedded in the sales contract (a futures contract initiated at the date of shipment and settled upon the determination of the “final price”) which is bifurcated and separately accounted for at fair value. See Note 17.

Revenues from concentrate sales are recorded net of treatment and refining charges. These allowances are a negotiated term of each contract. Treatment and refining charges represent payments or price adjustments to smelters and refiners and are either fixed, or in certain cases, vary with the price of metals (referred to as price participation).


- 15 -


Note 2 - Summary of Significant Accounting Policies - (Continued)

Management estimates
The preparation of financial statements in conformity with accounting principles generally accepted in the United States of America requires management to make estimates and assumptions that affect the reported amounts of assets and liabilities and disclosure of contingent assets and liabilities at the date of the financial statements and the reported amounts of revenues and expenses during the reporting periods. The most significant areas requiring the use of management estimates include mineral reserve estimation; useful asset lives for depreciation and amortization; zakat and income taxes; environmental obligations; reclamation and closure costs; estimates of recoverable materials in mill stockpiles; fair value of embedded derivatives; end-of-service indemnities; and asset impairment, including estimates used to derive future cash flows associated with those assets.  Actual results could differ from these estimates.

Recent accounting pronouncements
In May 2014 the Financial Accounting Standards Board (FASB) issued Accounting Standards Update (ASU) 2014-09, Revenue from Contracts with Customers (ASU 2014-09). ASU 2014-09 supersedes the revenue recognition requirements of FASB Accounting Standards Codification (ASC) Topic 605, Revenue Recognition and most industry-specific guidance throughout the ASC, resulting in the creation of FASB ASC Topic 606, Revenue from Contracts with Customers. ASU 2014-09 requires entities to recognize revenue in a way that depicts the transfer of promised goods or services to customers in an amount that reflects the consideration to which the entity expects to be entitled to in exchange for those goods or services. This ASU provides alternative methods of retrospective adoption and is effective for fiscal years, and interim periods within those years, beginning after December 15, 2017. Early adoption would be permitted but not before annual periods beginning after December 15, 2016.The Company is currently assessing the potential impact of adopting this ASU on its financial statements and related disclosures.

In April 2015 the FASB issued ASU 2015-03, Interest - Imputation of Interest (Subtopic 835-30): Simplifying the Presentation of Debt Issuance Costs. The amendments in this ASU 2015-03 require that debt issuance costs related to a recognized debt liability be presented in the balance sheet as a direct deduction from the carrying amount of that debt liability, consistent with debt discounts. The recognition and measurement guidance for debt issuance costs are not affected by the amendments in this ASU 2015-03. In August 2015 the FASB issued ASU 2015-15, Interest - Imputation of Interest (Subtopic 835-30): Presentation and Subsequent Measurement of Debt Issuance Costs Associated with Line-of-Credit Arrangements - Amendments to SEC Paragraphs Pursuant to Staff Announcement at June 18, 2015 EITF

 
- 16 -

 
Note 2 - Summary of Significant Accounting Policies - (Continued)

Recent accounting pronouncements – continued
Meeting. ASU 2015-15 was issued to address presentation or subsequent measurement of debt issuance costs related to line-of-credit arrangements that were not found ASU 2015-03.   Given the absence of authoritative guidance within ASU 2015-03 for debt issuance costs related to line-of-credit arrangements, the SEC staff would not object to an entity deferring and presenting debt issuance costs as an asset and subsequently amortizing the deferred debt issuance costs ratably over the term of the line-of-credit arrangement, regardless of whether there are any outstanding borrowings on the line-of-credit arrangement. These standards are effective for fiscal years, and interim periods within those fiscal years, beginning after December 15, 2015, and should be applied retrospectively.  Early adoption is permitted. The Company is currently assessing the potential impact of adopting ASU 2015-03 and ASU 2015-15 on its financial statements and related disclosures.


Note 3 – Liquidity and Capital Resources

As shown in the financial statements, we incurred two consecutive years of net losses and had a negative margin from operations in 2015. Our losses were largely attributable to the depressed commodity prices as well as certain operating inefficiencies from our operating contract with CGM. In response to these factors, we took certain steps to protect the Company and the shareholders. We renegotiated our debt repayment arrangement with SIDF and postponed any repayments until 2017. We cancelled the operating contract with CGM and suspended operations until the fourth quarter of 2016. In February 2016, we entered into a new operating and rehabilitation contract under more favorable terms. During our shutdown we plan to renovate our facilities to improve recoveries and reduce costs and explore options to possibly self-operate the facilities which is expected to improve profitability.  We believe that the cash on hand, liquidation of our remaining inventories, and the processing of the Guyan gold dumps will fund our operations until the facilities are back online in late 2016. The final length of the shutdown period ultimately depends on the cash available and the completion of the renovation work planned.  The mill may resume operations at any time after the new operators are in place and any remaining renovations may be completed while operating if necessary. Warehouse financing is readily available once operations resume, and no capital call on existing shareholders is anticipated.

We believe that the items discussed above will provide us the necessary liquidity and capital resources.  There can be no assurances that our operating assumptions and objectives will be met.  If they are not met, we may experience liquidity problems.


- 17 -

 
Note 4 – Inventories

Inventories consisted of the following at:

   
December 31,
 
   
2015
   
2014
 
             
Mill stockpiles
    19,410,770       27,748,347  
Precious metal dore
    4,231,848       -  
Explosives
    -       572,875  
Chemicals and other
    7,987,514       -  
                 
      31,630,132       28,321,222  

As discussed in Note 1, we terminated our operating contract with CGM and took possession of the chemicals inventory which they were using in our mining operations.  During 2014, we had amended our operating contract with CGM which transferred the ownership and management of the chemicals used in mining operations away from AMAK. As discussed in Note 9, we can receive advances on a pre-export basis on our mill stockpiles.

Our inventory on hand at December 31, 2015 has been reduced to net realizable value through a charge to expense of approximately SR17,624,000.


Note 5 – Advances to Contractors and Other

Advances to contractors and other consisted of the following at:

   
December 31,
 
   
2015
   
2014
 
             
Advances to contractors
    2,790,023       10,371,267  
Prepaid expenses
    3,360,082       3,989,977  
Other miscellaneous advances and receivables
    946,741       910,669  
                 
      7,096,846       15,271,913  

 
- 18 -


Note 6 – Property and Equipment

Property and equipment, net consisted of the following at:

   
December 31,
 
   
2015
   
2014
 
             
Buildings
    181,136,277       181,111,277  
Leasehold improvements
    1,838,317       1,692,373  
Heavy equipment
    103,372,979       103,372,979  
Motor vehicles
    21,960,933       20,561,683  
Civil works
    15,081,590       15,081,590  
Tailings dam
    22,684,394       22,684,394  
Plant and machinery
    284,231,416       282,395,348  
Mining assets – rehabilitation costs
    98,894,826       98,894,826  
Mining assets – underground development costs
    232,306,494       188,068,026  
Construction in progress
    17,937,363       8,044,124  
                 
      979,444,589       921,906,620  
                 
Less accumulated depreciation, depletion and amortization
    (239,509,362 )     (172,577,647 )
 
               
      739,935,227       749,328,973  

Property and equipment serve as collateral for the SIDF loan agreement (see Note 11).


Note 7 – Development Costs

Development costs, net consisted of the following at:

   
December 31,
 
   
2015
   
2014
 
             
Cost
    289,973,237       289,973,237  
Accumulated amortization
    (80,292,732 )     (59,402,553 )
                 
      209,680,505       230,570,684  


- 19 -

 
Note 8 – Accounts Payable and Accrued Liabilities

Accounts payable and accrued liabilities consisted of the following at:

   
December 31,
 
   
2015
   
2014
 
             
Accounts payable
    58,591,574       31,763,195  
Retention payable
    14,744,250       14,744,250  
Accrued salaries and payroll expenses
    1,532,403       1,254,576  
                 
      74,868,227       47,762,021  


Note 9 – Pre-export Advance Payments

During 2015 and 2014, we received advances on a pre-export basis against a portion of our inventory on hand prior to shipment. These advances bear interest at 2.5% and are repaid from the proceeds from final concentrate sales. We had an outstanding advance liability of approximately SR9,151,000 and SR3,823,000 at December 31, 2015 and 2014.


Note 10 – Zakat and Income Tax

We have submitted our Zakat and income tax return for the year ended December 31, 2014 and have obtained our Zakat certificate which is valid until April 30, 2016. We are in the process of preparing and submitting our Zakat and income tax return for the year 2015.

The Zakat base for the Saudi shareholders was positive in 2015 and Zakat expense and corresponding liability has been recorded. The Zakat base for the Saudi shareholders was negative in 2014 and 2013. Therefore, no Zakat expense or liability is recorded in those years. There was no taxable profit attributable to our non-Saudi (foreign) shareholders for 2015, 2014, and 2013. Therefore, no current income tax liability is due in those years.

 
- 20 -

 
Note 10 – Zakat and Income Tax – (Continued)

The provision for Zakat and income taxes consisted of the following:

   
Years ended December 31,
 
   
2015
   
2014
   
2013
 
                   
Non-current deferred income tax expense (benefit)
    (10,531,677 )     (521,853 )     4,250,316  
Change in valuation allowance
    11,267,893       3,399,369       1,017,442  
Current Zakat expense
    1,254,419       -       -  
                         
Provision for Zakat and income taxes
    1,990,635       2,877,516       5,267,758  

The difference between the effective income tax rate and the statutory rate for non-Saudi shareholders of 20% for the years ended December 31, 2015, 2014, and 2013, relates to changes in the valuation allowance and adjustments to estimates in depreciation.

Tax effects of temporary differences that give rise to significant portions of non-Saudi owners deferred tax assets and deferred tax liabilities were as follows:

   
December 31,
 
   
2015
   
2014
 
       
Deferred tax assets:
           
  Loss carryforward
    24,310,861       13,715,068  
  Other
    291,961       229,797  
                 
      24,602,822       13,944,865  
Deferred tax liabilities:
               
  Property and Equipment
    (17,799,608 )     (17,673,328 )
                 
Gross deferred tax liabilities
    6,803,214       (3,728,463 )
Valuation allowance
    (15,684,704 )     (4,416,811 )
                 
  Net deferred tax liability
    (8,881,490 )     (8,145,274 )


- 21 -

 
Note 10 – Zakat and Income Tax – (Continued)

At December 31, 2015 and 2014, we had tax loss carryforwards totaling approximately SR121,554,000 and SR68,600,000. Tax losses may be carried forward indefinitely subject to certain annual limitations for non-Saudi shareholders. We have provided a valuation allowance in 2015 and 2014 against a portion of our gross deferred tax assets because of uncertainties regarding their realization.


Note 11 - Long-term Debt

During 2010, the Company entered into a loan agreement with the SIDF for SR330,000,000 to finish the development of the mine and provide working capital. The loan originally matured in 2019, however, the agreement was amended during 2015 to adjust the maturity date to 2022 as well as the repayment schedule. During 2015, the Company also received the final advance of SR50,192,000 in connection with the agreement.

Long-term debts are summarized as follows at:

   
December 31,
 
   
2015
   
2014
 
             
SIDF loan agreement
    310,000,000       259,808,000  
Less current portion
    -       30,000,000  
                 
Total long-term debt, less current portion
    310,000,000       229,808,000  

The loan is repayable in thirteen increasing semi-annual installments starting January 2017 through January 2022. The repayment schedule is as follows:


Years Ending
December 31,
     
       
2016
    -  
2017
    15,000,000  
2018
    55,000,000  
2019
    50,000,000  
2020
    60,000,000  
Thereafter
    130,000,000  
         
      310,000,000  


- 22 -

 
Note 11 - Long-term Debt – (Continued)

Under the terms of the agreement with SIDF, we are required to maintain certain financial covenants, among other items. We were in compliance with these covenants at December 31, 2015.


Note 12 – End-of-Service Indemnities

The change in the end-of-service indemnities provision is as follows:

   
Years Ended December 31,
 
   
2015
   
2014
 
             
Balance, beginning of year
    1,543,015       1,395,330  
Provision for the year
    550,685       742,007  
Paid during the year
    (348,267 )     (594,322 )
Balance, end of year
    1,745,433       1,543,015  


Note 13 – Asset Retirement Obligations

During 2012, we recorded an ARO for deferred mine closure costs of SR12,842,625. These deferred mine closure costs are being amortized over the estimated life of the mine which is approximately 11.5 years. Amortization expense for 2015, 2014, and 2013 was SR1,116,750 for each respective year.

Deferred mine closure costs consisted of the following at:

   
December 31,
 
   
2015
   
2014
 
             
Cost
    12,842,625       12,842,625  
Accumulated amortization
    (3,908,625 )     (2,791,875 )
                 
      8,934,000       10,050,750  


- 23 -

 
Note 13 – Asset Retirement Obligations – (Continued)

A summary of changes in our provision for mine closure costs is as follows:

   
Years Ended December 31,
 
   
2015
   
2014
   
2013
 
                   
Balance, beginning of year
    13,998,094       13,524,728       13,067,371  
Accretion expense
    489,934       473,366       457,357  
                         
Balance, end of year
    14,488,028       13,998,094       13,524,728  

ARO costs may increase or decrease significantly in the future as a result of changes in regulations, changes in engineering designs and technology, permit modifications or updates, changes in mine plans, inflation or other factors and as actual reclamation spending occurs.


Note 14 – General and Administrative Expenses

A summary of general and administrative expenses is as follows:

   
Years Ended December 31,
 
   
2015
   
2014
   
2013
 
                   
Wages, salaries and related costs
    10,459,516       12,769,312       15,873,435  
Depreciation
    235,605       681,008       781,039  
Mine closure and environmental
    1,606,683       1,590,116       1,574,108  
Office expenses
    5,911,485       3,470,200       3,438,800  
Travel and accommodation
    1,686,018       2,160,061       2,230,722  
Professional fees
    3,972,898       3,195,326       490,292  
Other
    761,252       2,253,455       1,428,643  
                         
      24,633,457       26,119,478       25,817,039  


- 24 -


Note 15 – Supplemental Cash Flow Information

Supplemental cash flow information is as follows:

Supplemental Information:
 
Years Ended December 31,
 
   
2015
   
2014
   
2013
 
                   
Cash paid for interest
    4,213,036       7,840,689       5,921,787  
                         
Cash paid for Zakat and income tax
    -       -       -  


Note 16 - Commitments and Contingencies

Lease commitments
Our lease commitment for our surface mining lease was initially granted for a period of 30 years through 2024. The lease allows for renewal for an additional 20 years. During 2014, we entered into leases for a new corporate office and three residential villas in Najran from 2015 to 2025. During 2015, we entered into a new mining lease that covers the Guyan area for a period of 20 years. A summary of these commitments are as follows:

Years Ending
December 31,
     
       
2016
    760,000  
2017
    760,000  
2018
    913,333  
2019
    990,000  
2020
    990,000  
Thereafter
    5,237,500  
         
      9,650,833  


- 25 -


Note 17 Embedded Derivatives

As described in Note 2 under “Revenue Recognition,” our concentrate sales contracts provide for provisional pricing based on the LME price at the time of shipment as specified in the contract.  Sales contracts with a provisional sales price contain an embedded derivative (i.e., the price settlement mechanism that is settled after the time of delivery) that is required to be bifurcated from the host contract. The host contract is the sale of the metals contained in the concentrates at the then-current LME price as defined in the contract. Mark-to-market price fluctuations recorded through the settlement date are reflected in revenues for sales contracts. Our embedded derivatives at December 31, 2015, were not significant to the financial statements.


Note 18 - Fair Value Measurement

Fair value accounting guidance includes a hierarchy that prioritizes the inputs to valuation techniques used to measure fair value. The hierarchy gives the highest priority to unadjusted quoted prices in active markets for identical assets or liabilities (Level 1 inputs) and the lowest priority to unobservable inputs (Level 3 inputs).

Level 1
Unadjusted quoted prices in active markets that are accessible at the measurement date for identical, unrestricted assets or liabilities;

Level 2
Quoted prices in markets that are not active, quoted prices for similar assets or liabilities in active markets, inputs other than quoted prices that are observable for the asset or liability, or inputs that are derived principally from or corroborated by observable market data by correlation or other means; and

Level 3
Prices or valuation techniques that require inputs that are both significant to the fair value measurement and unobservable (supported by little or no market activity).

We did not have any significant transfers in or out of Levels 1, 2, or 3 in 2015 or 2014. The embedded derivatives in our provisional sales contracts are considered Level 2 measurements.


- 26 -