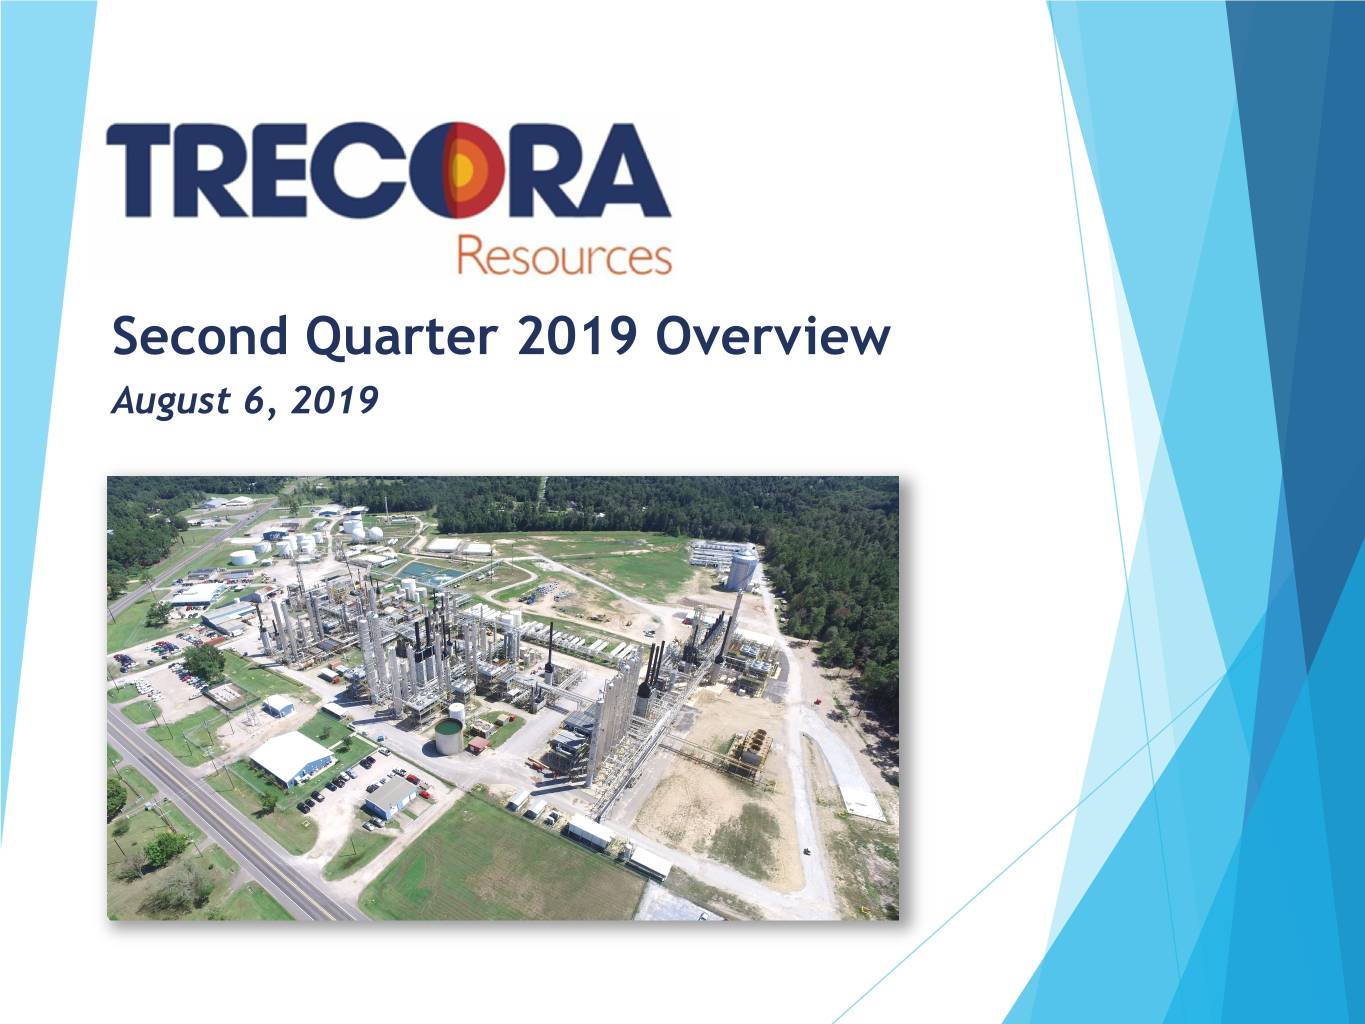
Second Quarter 2019 Overview August 6, 2019
Safe Harbor Statement Some of the statements and information contained in this press release may constitute forward-looking statements within the meaning of the Private Securities Litigation Reform Act of 1995. Statements regarding the Company's financial position, business strategy and plans and objectives of the Company's management for future operations and other statements that are not historical facts, are forward-looking statements. Forward-looking statements are often characterized by the use of words such as "outlook," "may," "will," "should," "could," "expects," "plans," "anticipates," "contemplates," "proposes," "believes," "estimates," "predicts," "projects," "potential," "continue," "intend," or the negative of such terms and other comparable terminology, or by discussions of strategy, plans or intentions, including, but not limited to: expectations regarding future market trends; expectations regarding our intention to monetize our ownership in AMAK; and expectations regarding the timing and completion of AMAK’s Guyan gold project and its impact on AMAK’s financial performance. Forward-looking statements are subject to risks, uncertainties and other factors that could cause actual results to differ materially from those expressed or implied by such statements. Such risks, uncertainties and factors include, but are not limited to: general economic conditions domestically and internationally; insufficient cash flows from operating activities; difficulties in obtaining financing on favorable conditions, or at all; outstanding debt and other financial and legal obligations; lawsuits; competition; industry cycles; feedstock, product and mineral prices; feedstock availability; technological developments; regulatory changes; environmental matters; foreign government instability; foreign legal and political concepts; foreign currency fluctuations; and other risks detailed in our latest Annual Report on Form 10-K, including but not limited to "Part I, Item 1A. Risk Factors" and "Part II, Item 7. Management's Discussion and Analysis of Financial Condition and Results of Operations" therein, and in our other filings with the Securities and Exchange Commission (the "SEC"). There may be other factors of which we are currently unaware or deem immaterial that may cause our actual results to differ materially from the forward-looking statements. In addition, to the extent any inconsistency or conflict exists between the information included in this press release and the information included in our prior releases, reports and other filings with the SEC, the information contained in this press release updates and supersedes such information. Forward-looking statements are based on current plans, estimates, assumptions and projections, and, therefore, you should not place undue reliance on them. Forward-looking statements speak only as of the date they are made, and we undertake no obligation to update them in light of new information or future events. 2
Disclaimer: Non-GAAP Measures This press release includes the use of both U.S. generally accepted accounting principles ("GAAP") and non-GAAP financial measures. The Company believes certain financial measures, such as EBITDA, Adjusted EBITDA, Adjusted EBITDA Margin and Adjusted Net Income (Loss), which are non-GAAP measures, provide users of our financial statements with supplemental information that may be useful in evaluating our operating performance. The Company believes that such non-GAAP measures, when read in conjunction with our operating results presented under GAAP, can be used to better assess our performance from period to period and relative to performance of other companies in our industry, without regard to financing methods, historical cost basis or capital structure. These measures are not measures of financial performance or liquidity under GAAP and should be considered in addition to, and not as a substitute for, analysis of our results under GAAP. These non-GAAP measures have been reconciled to the nearest GAAP measure in the tables below entitled Reconciliation of Selected GAAP Measures to Non-GAAP Measures. EBITDA, Adjusted EBITDA and Adjusted EBITDA Margin: We define EBITDA as net income (loss) plus interest expense (benefit) including derivative gains and losses, income taxes, depreciation and amortization. We define Adjusted EBITDA as EBITDA plus share-based compensation, plus restructuring and severance expenses, plus losses on extinguishment of debt, plus or minus equity in AMAK's earnings and losses or gains from equity issuances, and plus or minus gains or losses on acquisitions. We define Adjusted EBITDA Margin as Adjusted EBITDA as a percentage of revenue. Adjusted Net Income (Loss): We define Adjusted Net Income (Loss) as net income (loss) plus or minus tax effected equity in AMAK's earnings and losses, minus tax effected restructuring and severance expenses. 3
Trecora Overview Q2’19 Financials o Adj. EBITDA of $9.2 million ($8.4 million in Q1’19 and $6.2 million in Q2’18) o Net income of $2.4 million ($1.8 million in Q1’19 and $2.2 million in Q2’18) o Reduced debt by $5.1 million (additional $4 million in July 2019) Q2’19 Operational Highlights o Prime Products sales volume of 17.7 million gallons (16.1 million gallons in Q2’18) o Healthy demand from polyethylene and polyurethane markets offset lower sales to the Canadian Oil Sands o Two turnarounds at Silsbee (financial impact $1 million) o Ran key assets reliably, delivering on productivity initiatives and executing on key projects according to plan o Advanced Reformer ran with very high reliability allowing for capture of improved by-product values in the market o Savings from utilization of new on-site rail car storage allowed for the off-set of annual rail freight inflationary increases AMAK Highlights o AMAK Q2’19 net loss of $1.3 million and EBITDA of $7.3 million o Guyan gold project on schedule for 2H’20 startup 4
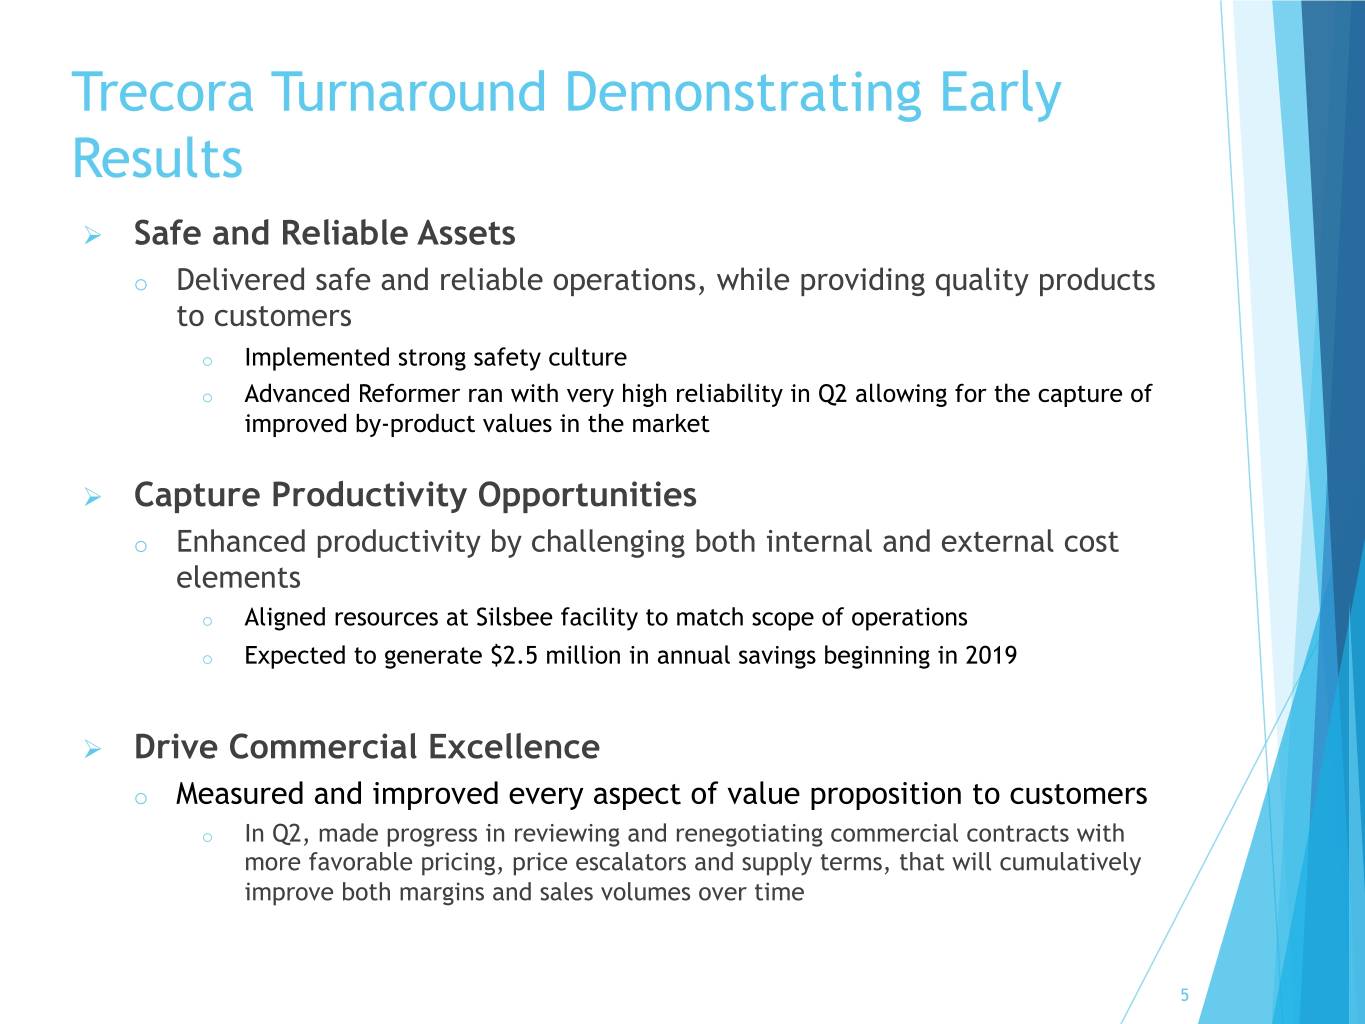
Trecora Turnaround Demonstrating Early Results Ø Safe and Reliable Assets o Delivered safe and reliable operations, while providing quality products to customers o Implemented strong safety culture o Advanced Reformer ran with very high reliability in Q2 allowing for the capture of improved by-product values in the market Ø Capture Productivity Opportunities o Enhanced productivity by challenging both internal and external cost elements o Aligned resources at Silsbee facility to match scope of operations o Expected to generate $2.5 million in annual savings beginning in 2019 Ø Drive Commercial Excellence o Measured and improved every aspect of value proposition to customers o In Q2, made progress in reviewing and renegotiating commercial contracts with more favorable pricing, price escalators and supply terms, that will cumulatively improve both margins and sales volumes over time 5
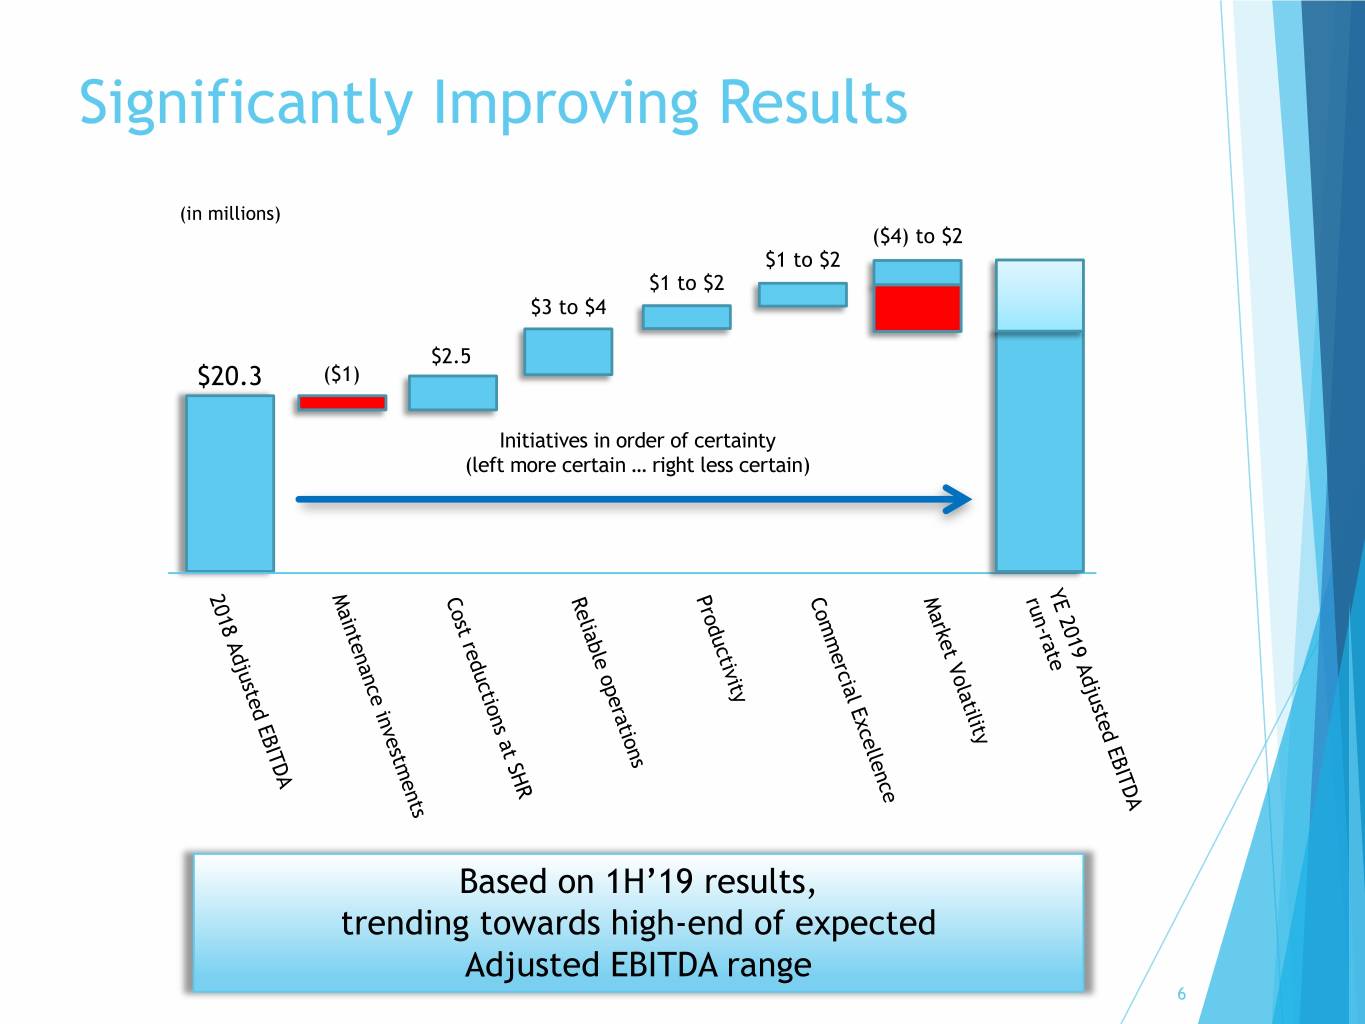
Significantly Improving Results (in millions) ($4) to $2 $1 to $2 $1 to $2 $3 to $4 $2.5 $20.3 ($1) Initiatives in order of certainty (left more certain … right less certain) YE 2019 Adjusted EBITDA 2018 Adjusted EBITDA Maintenance investments Cost reductions at SHR Reliable operations Productivity Commercial Excellence Market Volatility run - rate Based on 1H’19 results, trending towards high-end of expected Adjusted EBITDA range 6
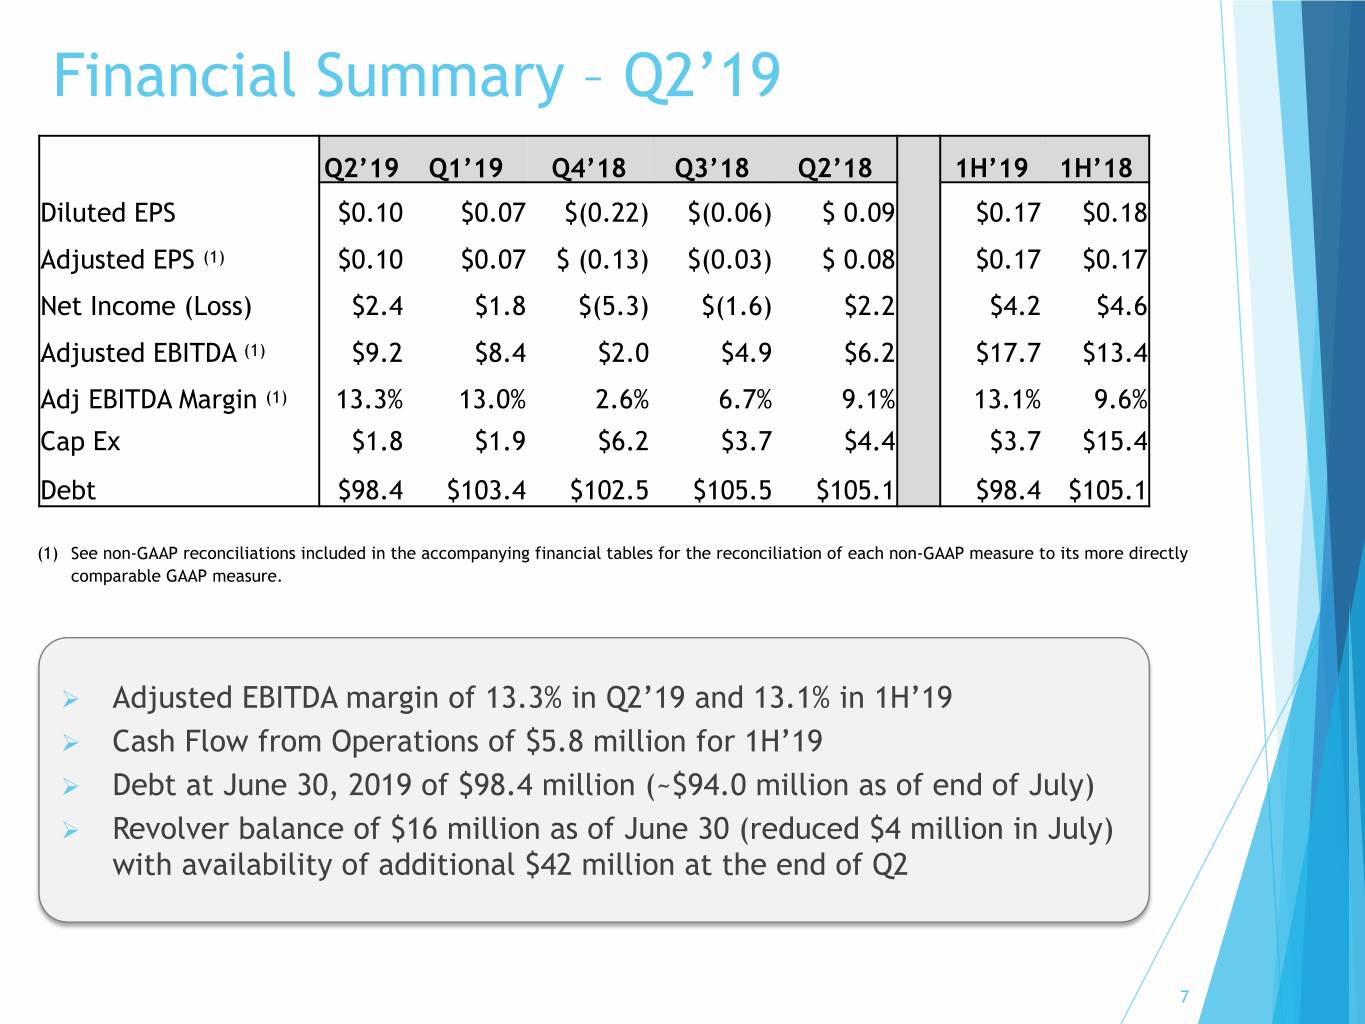
Financial Summary – Q2’19 Q2’19 Q1’19 Q4’18 Q3’18 Q2’18 1H’19 1H’18 Diluted EPS $0.10 $0.07 $(0.22) $(0.06) $ 0.09 $0.17 $0.18 Adjusted EPS (1) $0.10 $0.07 $ (0.13) $(0.03) $ 0.08 $0.17 $0.17 Net Income (Loss) $2.4 $1.8 $(5.3) $(1.6) $2.2 $4.2 $4.6 Adjusted EBITDA (1) $9.2 $8.4 $2.0 $4.9 $6.2 $17.7 $13.4 Adj EBITDA Margin (1) 13.3% 13.0% 2.6% 6.7% 9.1% 13.1% 9.6% Cap Ex $1.8 $1.9 $6.2 $3.7 $4.4 $3.7 $15.4 Debt $98.4 $103.4 $102.5 $105.5 $105.1 $98.4 $105.1 (1) See non-GAAP reconciliations included in the accompanying financial tables for the reconciliation of each non-GAAP measure to its more directly comparable GAAP measure. Ø Adjusted EBITDA margin of 13.3% in Q2’19 and 13.1% in 1H’19 Ø Cash Flow from Operations of $5.8 million for 1H’19 Ø Debt at June 30, 2019 of $98.4 million (~$94.0 million as of end of July) Ø Revolver balance of $16 million as of June 30 (reduced $4 million in July) with availability of additional $42 million at the end of Q2 7
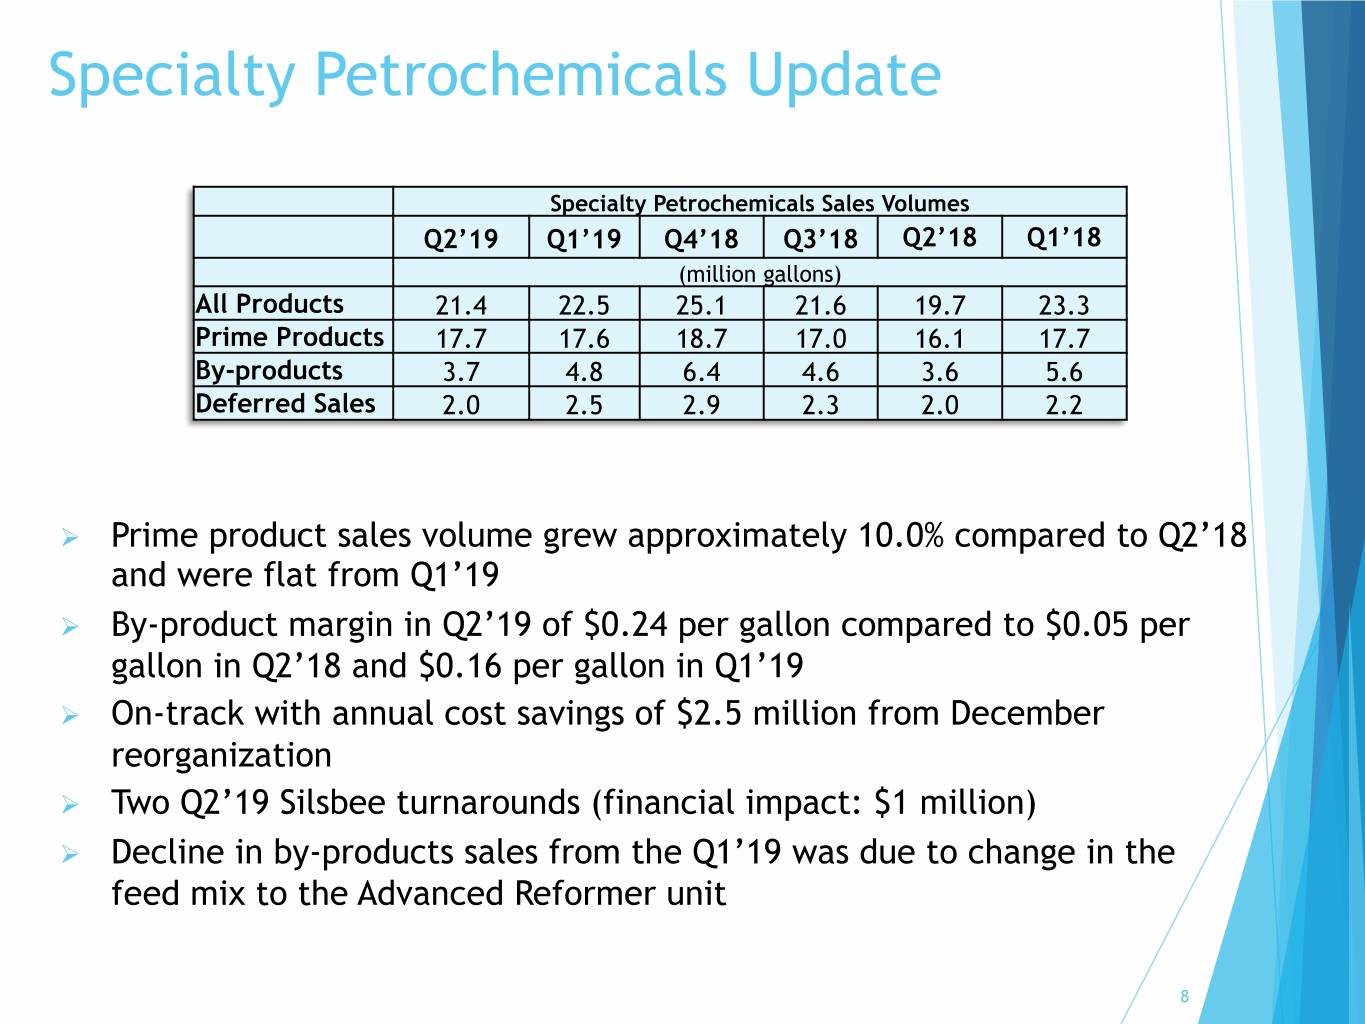
Specialty Petrochemicals Update Specialty Petrochemicals Sales Volumes Q2’19 Q1’19 Q4’18 Q3’18 Q2’18 Q1’18 (million gallons) All Products 21.4 22.5 25.1 21.6 19.7 23.3 Prime Products 17.7 17.6 18.7 17.0 16.1 17.7 By-products 3.7 4.8 6.4 4.6 3.6 5.6 Deferred Sales 2.0 2.5 2.9 2.3 2.0 2.2 Ø Prime product sales volume grew approximately 10.0% compared to Q2’18 and were flat from Q1’19 Ø By-product margin in Q2’19 of $0.24 per gallon compared to $0.05 per gallon in Q2’18 and $0.16 per gallon in Q1’19 Ø On-track with annual cost savings of $2.5 million from December reorganization Ø Tw o Q 2 ’ 1 9 Silsbee turnarounds (financial impact: $1 million) Ø Decline in by-products sales from the Q1’19 was due to change in the feed mix to the Advanced Reformer unit 8
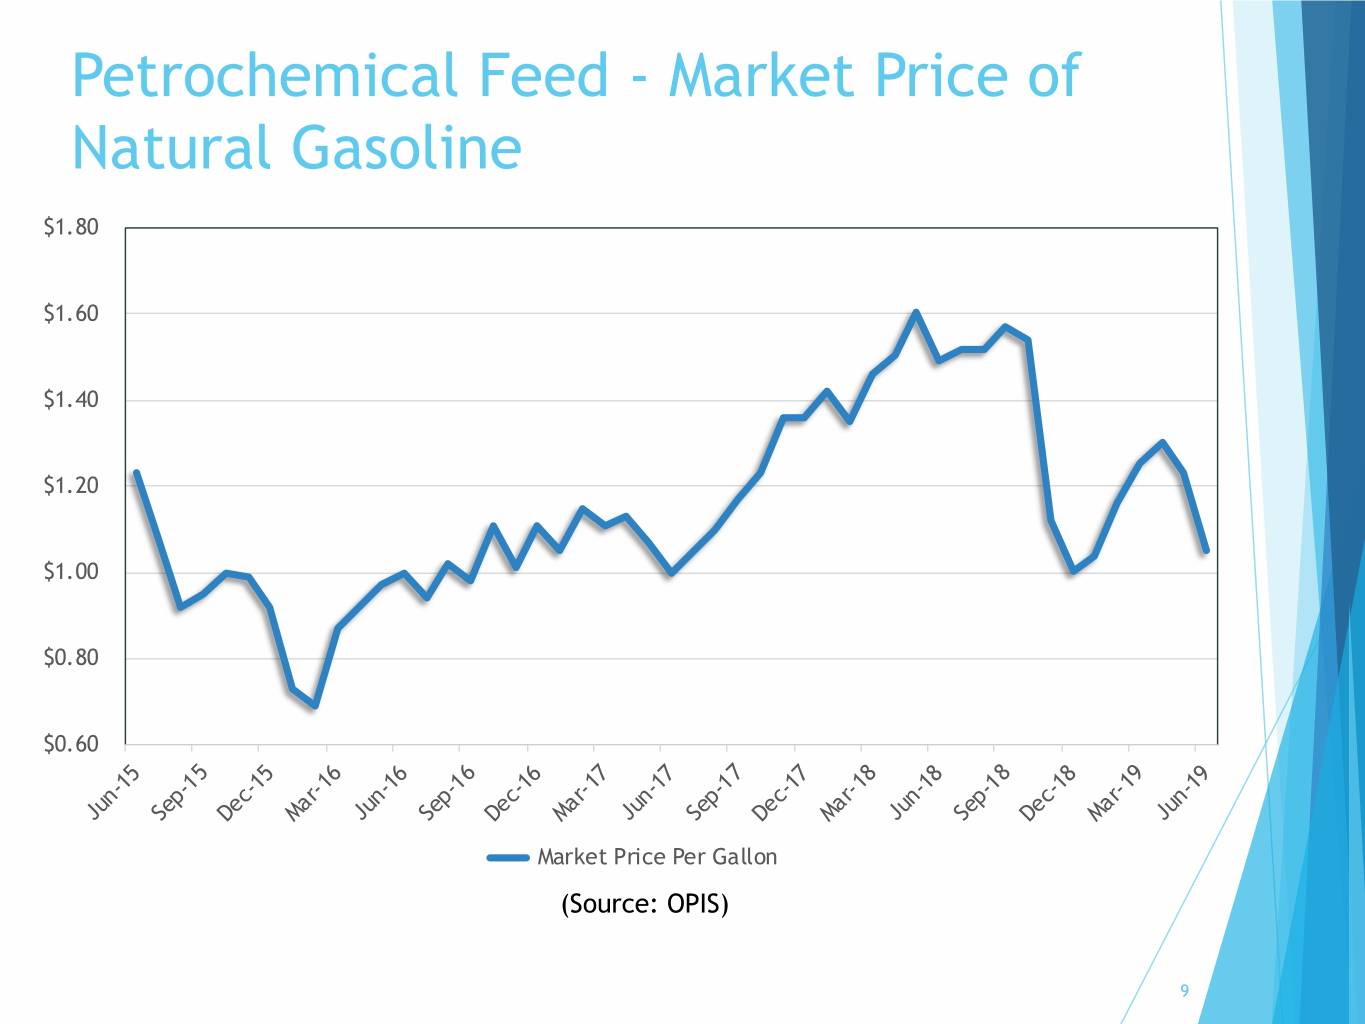
Petrochemical Feed - Market Price of Natural Gasoline $1.80 $1.60 $1.40 $1.20 $1.00 $0.80 $0.60 Jun-15 Sep-15 Dec-15 Mar-16 Jun-16 Sep-16 Dec-16 Mar-17 Jun-17 Sep-17 Dec-17 Mar-18 Jun-18 Sep-18 Dec-18 Mar-19 Jun-19 Market Price Per Gallon (Source: OPIS) 9
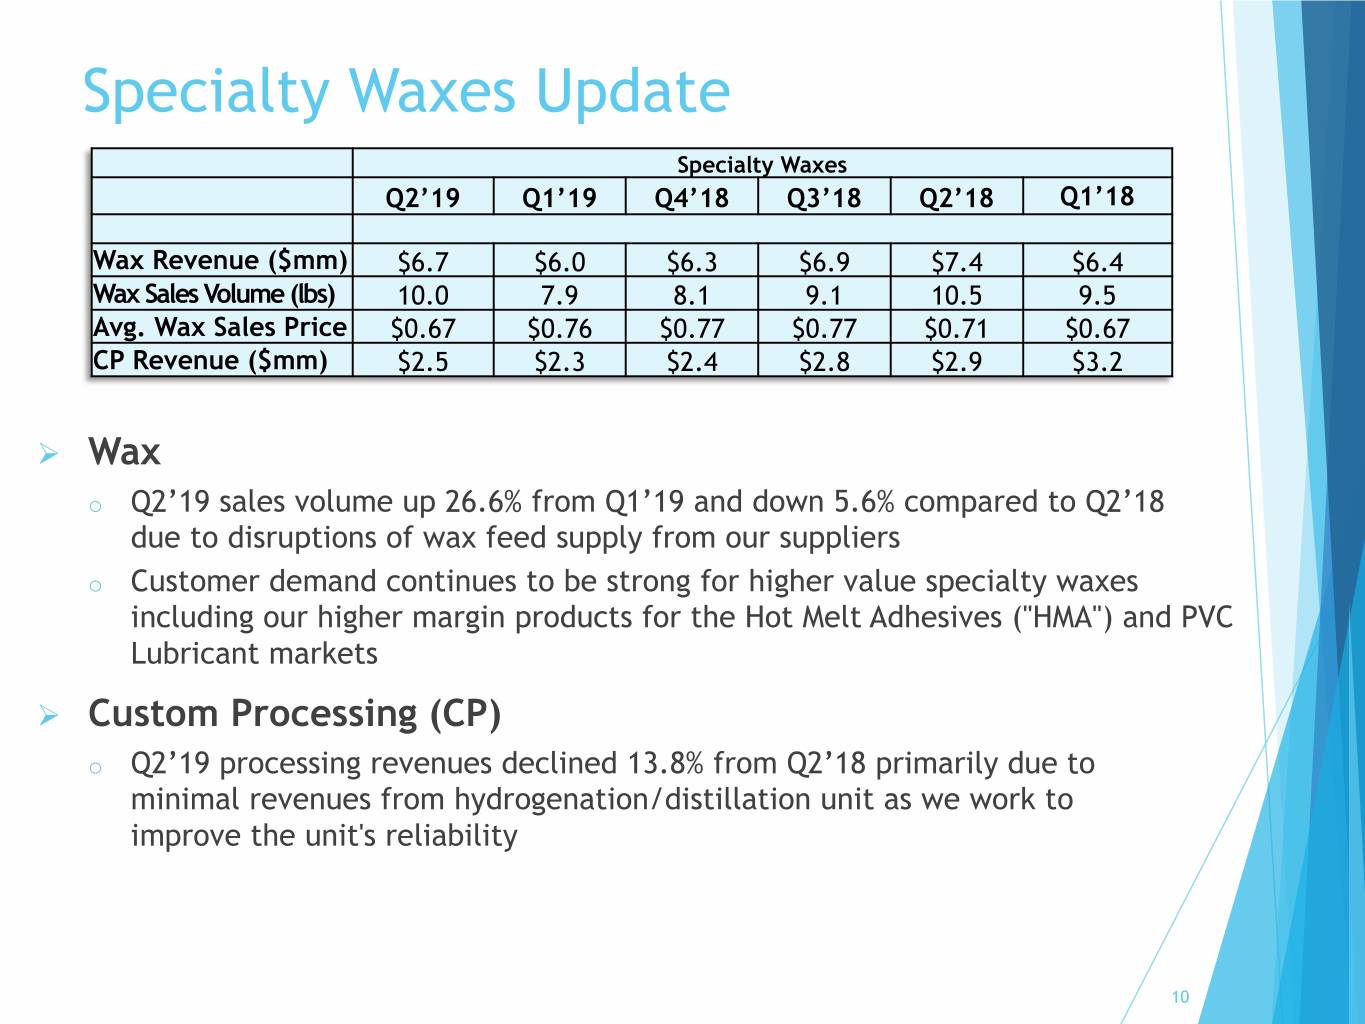
Specialty Waxes Update Specialty Waxes Q2’19 Q1’19 Q4’18 Q3’18 Q2’18 Q1’18 Wax Revenue ($mm) $6.7 $6.0 $6.3 $6.9 $7.4 $6.4 Wax Sales Volume (lbs) 10.0 7.9 8.1 9.1 10.5 9.5 Avg. Wax Sales Price $0.67 $0.76 $0.77 $0.77 $0.71 $0.67 CP Revenue ($mm) $2.5 $2.3 $2.4 $2.8 $2.9 $3.2 Ø Wax o Q2’19 sales volume up 26.6% from Q1’19 and down 5.6% compared to Q2’18 due to disruptions of wax feed supply from our suppliers o Customer demand continues to be strong for higher value specialty waxes including our higher margin products for the Hot Melt Adhesives ("HMA") and PVC Lubricant markets Ø Custom Processing (CP) o Q2’19 processing revenues declined 13.8% from Q2’18 primarily due to minimal revenues from hydrogenation/distillation unit as we work to improve the unit's reliability 10
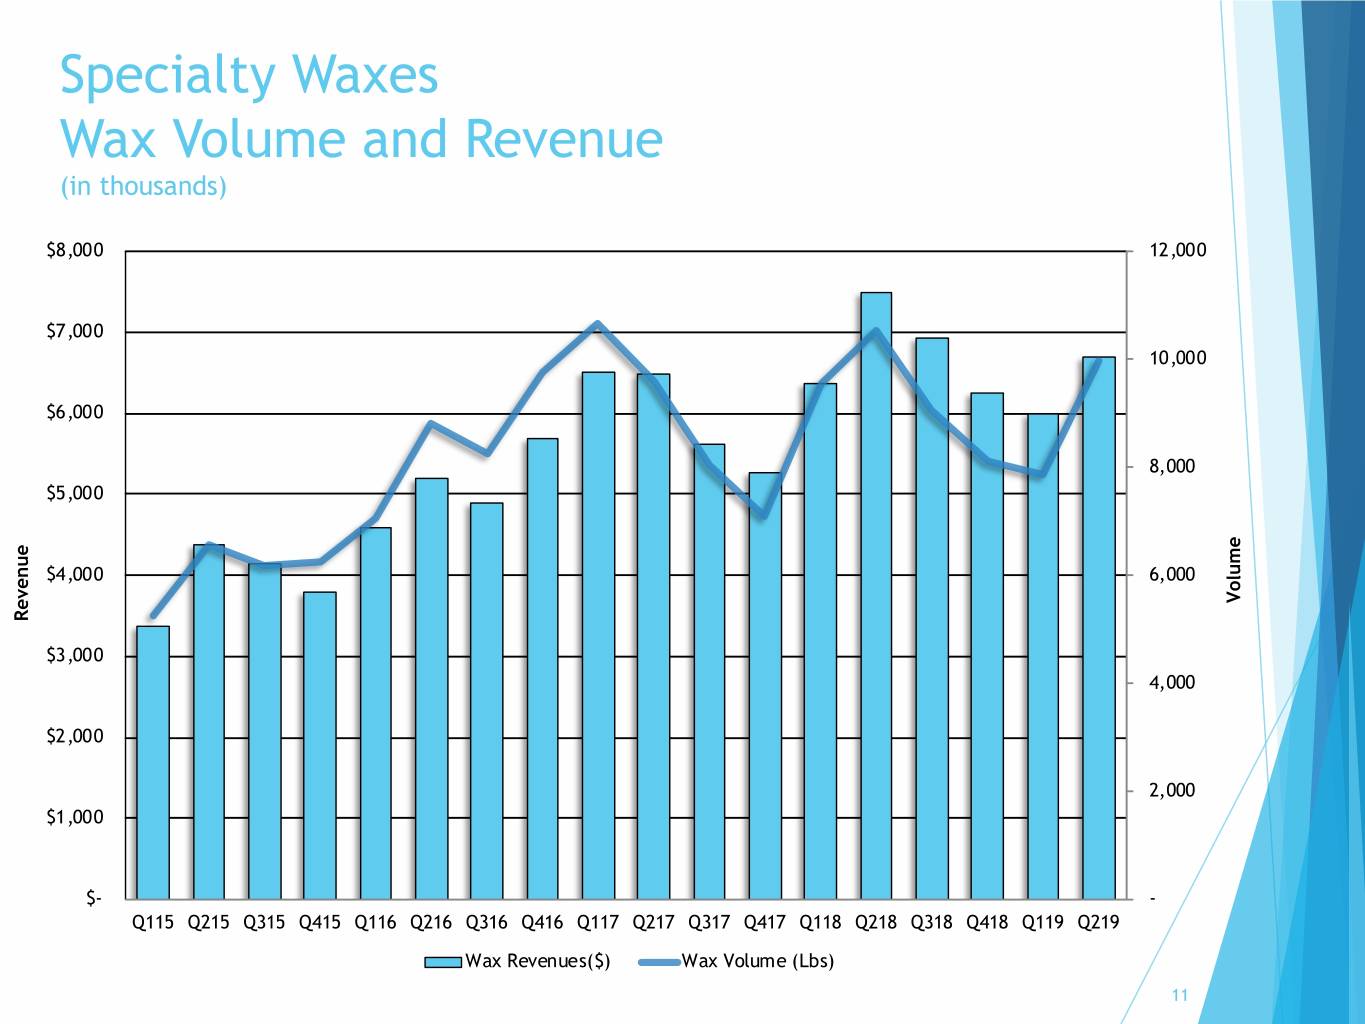
Specialty Waxes Wax Volume and Revenue (in thousands) $8,000 12,000 $7,000 10,000 $6,000 8,000 $5,000 $4,000 6,000 Volume Revenue $3,000 4,000 $2,000 2,000 $1,000 $- - Q115 Q215 Q315 Q415 Q116 Q216 Q316 Q416 Q117 Q217 Q317 Q417 Q118 Q218 Q318 Q418 Q119 Q219 Wax Revenues($) Wax Volume (Lbs) 11
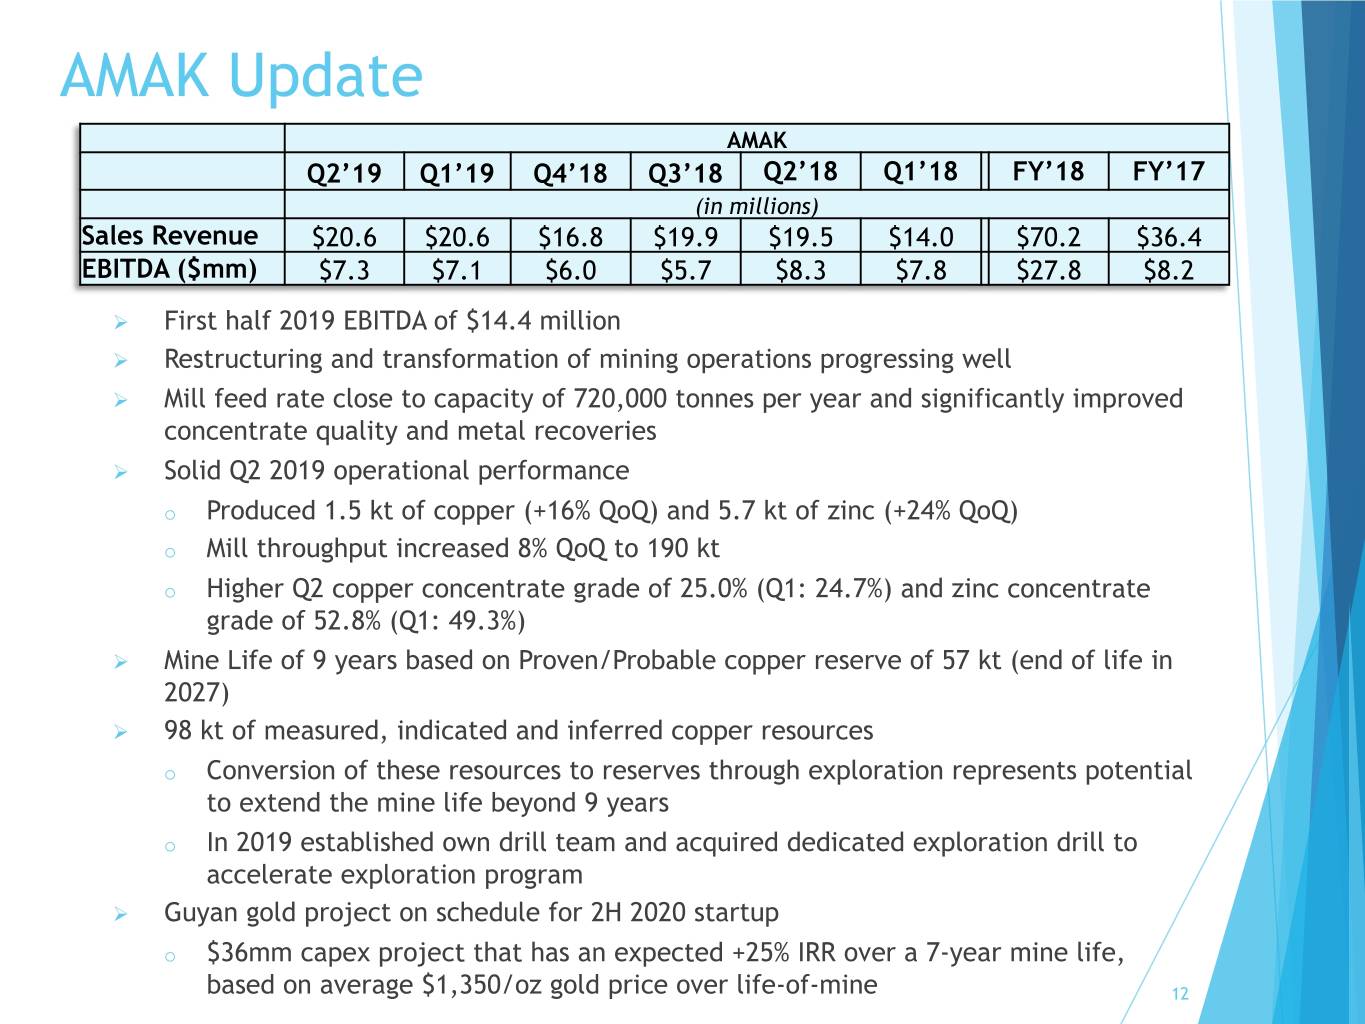
AMAK Update AMAK Q2’19 Q1’19 Q4’18 Q3’18 Q2’18 Q1’18 FY’18 FY’17 (in millions) Sales Revenue $20.6 $20.6 $16.8 $19.9 $19.5 $14.0 $70.2 $36.4 EBITDA ($mm) $7.3 $7.1 $6.0 $5.7 $8.3 $7.8 $27.8 $8.2 Ø First half 2019 EBITDA of $14.4 million Ø Restructuring and transformation of mining operations progressing well Ø Mill feed rate close to capacity of 720,000 tonnes per year and significantly improved concentrate quality and metal recoveries Ø Solid Q2 2019 operational performance o Produced 1.5 kt of copper (+16% QoQ) and 5.7 kt of zinc (+24% QoQ) o Mill throughput increased 8% QoQ to 190 kt o Higher Q2 copper concentrate grade of 25.0% (Q1: 24.7%) and zinc concentrate grade of 52.8% (Q1: 49.3%) Ø Mine Life of 9 years based on Proven/Probable copper reserve of 57 kt (end of life in 2027) Ø 98 kt of measured, indicated and inferred copper resources o Conversion of these resources to reserves through exploration represents potential to extend the mine life beyond 9 years o In 2019 established own drill team and acquired dedicated exploration drill to accelerate exploration program Ø Guyan gold project on schedule for 2H 2020 startup o $36mm capex project that has an expected +25% IRR over a 7-year mine life, based on average $1,350/oz gold price over life-of-mine 12
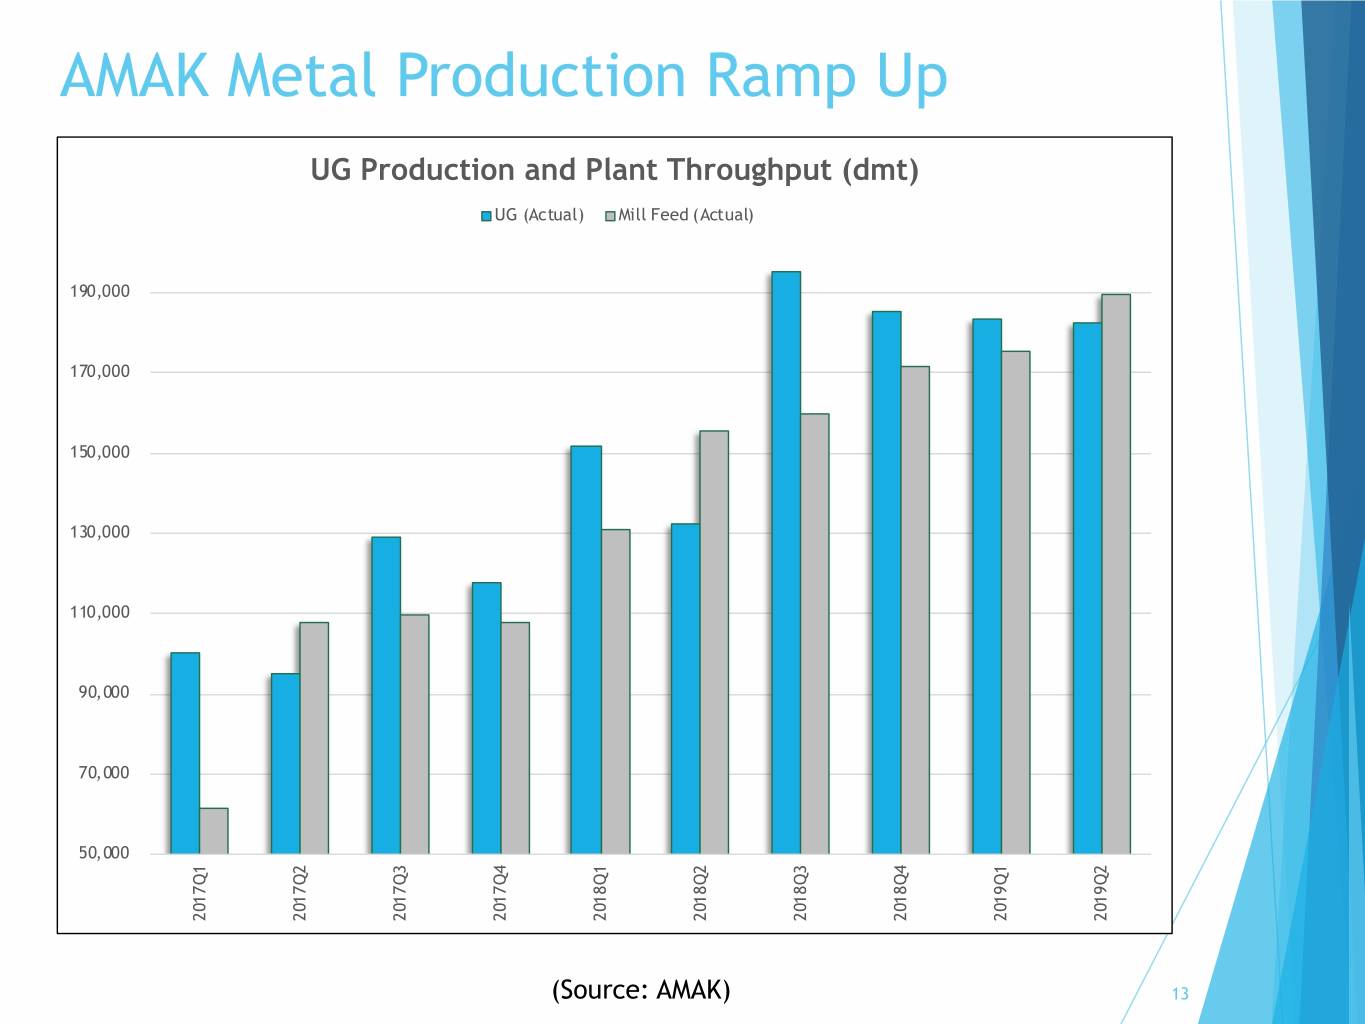
AMAK Metal Production Ramp Up UG Production and Plant Throughput (dmt) UG (Actual) Mill Feed (Actual) 190,000 170,000 150,000 130,000 110,000 90,000 70,000 50,000 2017Q1 2017Q2 2017Q3 2017Q4 2018Q1 2018Q2 2018Q3 2018Q4 2019Q1 2019Q2 (Source: AMAK) 13
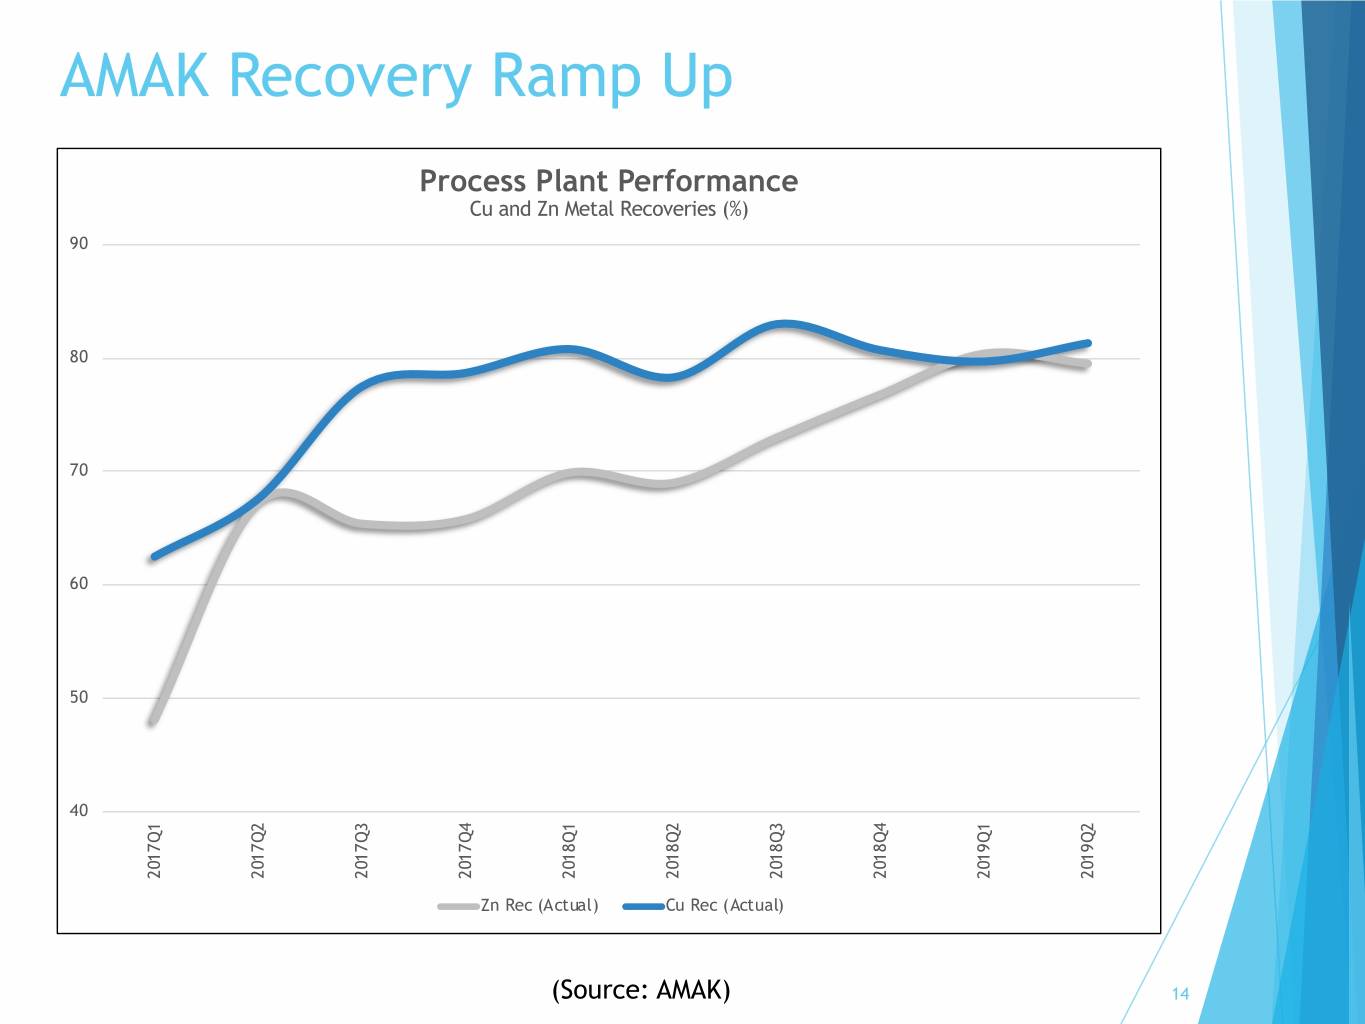
AMAK Recovery Ramp Up Process Plant Performance Cu and Zn Metal Recoveries (%) 90 80 70 60 50 40 2017Q1 2017Q2 2017Q3 2017Q4 2018Q1 2018Q2 2018Q3 2018Q4 2019Q1 2019Q2 Zn Rec (Actual) Cu Rec (Actual) (Source: AMAK) 14
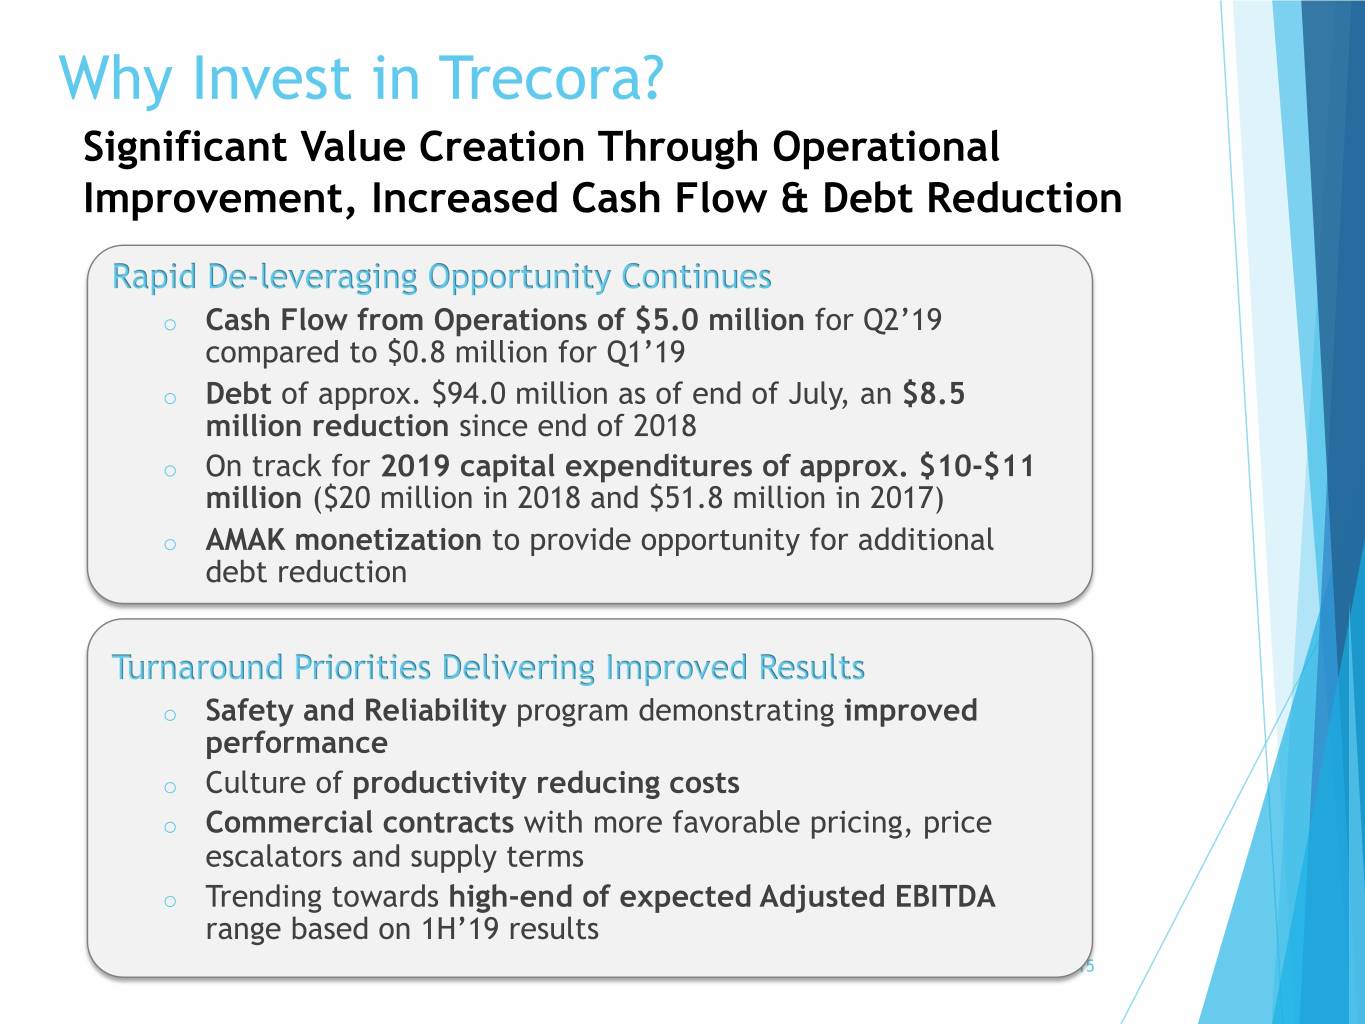
Why Invest in Trecora? Significant Value Creation Through Operational Improvement, Increased Cash Flow & Debt Reduction Rapid De-leveraging Opportunity Continues o Cash Flow from Operations of $5.0 million for Q2’19 compared to $0.8 million for Q1’19 o Debt of approx. $94.0 million as of end of July, an $8.5 million reduction since end of 2018 o On track for 2019 capital expenditures of approx. $10-$11 million ($20 million in 2018 and $51.8 million in 2017) o AMAK monetization to provide opportunity for additional debt reduction Turnaround Priorities Delivering Improved Results o Safety and Reliability program demonstrating improved performance o Culture of productivity reducing costs o Commercial contracts with more favorable pricing, price escalators and supply terms o Trending towards high-end of expected Adjusted EBITDA range based on 1H’19 results 15

Q&A Thank You Please visit our website: www.trecora.com 16
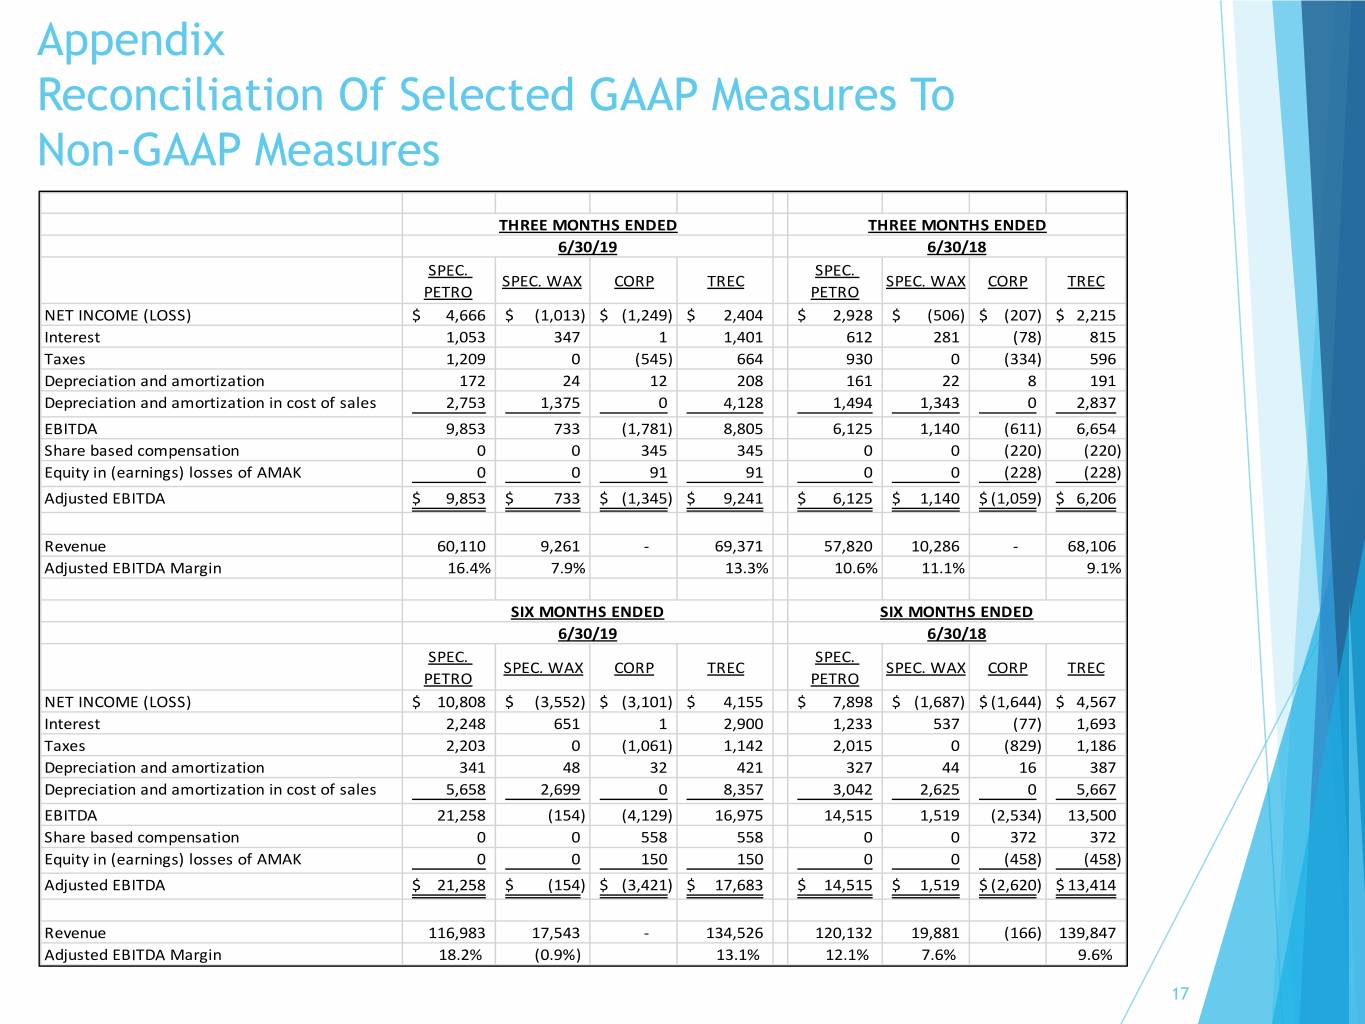
Appendix Reconciliation Of Selected GAAP Measures To Non-GAAP Measures THREE MONTHS ENDED THREE MONTHS ENDED 6/30/19 6/30/18 SPEC. SPEC. SPEC. WAX CORP TREC SPEC. WAX CORP TREC PETRO PETRO NET INCOME (LOSS) $ 4,666 $ (1,013) $ (1,249) $ 2,404 $ 2,928 $ (506) $ (207) $ 2,215 Interest 1,053 347 1 1,401 612 281 (78) 815 Taxes 1,209 0 (545) 664 930 0 (334) 596 Depreciation and amortization 172 24 12 208 161 22 8 191 Depreciation and amortization in cost of sales 2,753 1,375 0 4,128 1,494 1,343 0 2,837 EBITDA 9,853 733 (1,781) 8,805 6,125 1,140 (611) 6,654 Share based compensation 0 0 345 345 0 0 (220) (220) Equity in (earnings) losses of AMAK 0 0 91 91 0 0 (228) (228) Adjusted EBITDA $ 9,853 $ 733 $ (1,345) $ 9,241 $ 6,125 $ 1,140 $ (1,059) $ 6,206 Revenue 60,110 9,261 - 69,371 57,820 10,286 - 68,106 Adjusted EBITDA Margin 16.4% 7.9% 13.3% 10.6% 11.1% 9.1% SIX MONTHS ENDED SIX MONTHS ENDED 6/30/19 6/30/18 SPEC. SPEC. SPEC. WAX CORP TREC SPEC. WAX CORP TREC PETRO PETRO NET INCOME (LOSS) $ 10,808 $ (3,552) $ (3,101) $ 4,155 $ 7,898 $ (1,687) $ (1,644) $ 4,567 Interest 2,248 651 1 2,900 1,233 537 (77) 1,693 Taxes 2,203 0 (1,061) 1,142 2,015 0 (829) 1,186 Depreciation and amortization 341 48 32 421 327 44 16 387 Depreciation and amortization in cost of sales 5,658 2,699 0 8,357 3,042 2,625 0 5,667 EBITDA 21,258 (154) (4,129) 16,975 14,515 1,519 (2,534) 13,500 Share based compensation 0 0 558 558 0 0 372 372 Equity in (earnings) losses of AMAK 0 0 150 150 0 0 (458) (458) Adjusted EBITDA $ 21,258 $ (154) $ (3,421) $ 17,683 $ 14,515 $ 1,519 $ (2,620) $ 13,414 Revenue 116,983 17,543 - 134,526 120,132 19,881 (166) 139,847 Adjusted EBITDA Margin 18.2% (0.9%) 13.1% 12.1% 7.6% 9.6% 17