Trecora Resources Reports Second Quarter 2019 Results
| |
• | Second quarter net income of $2.4 million compared to net income of $1.8 million in first quarter 2019 and net income of $2.2 million in second quarter 2018 |
| |
• | Reliability and cost control drove second quarter Adjusted EBITDA of $9.2 million compared to $8.4 million in first quarter 2019 and $6.2 million in second quarter 2018 (a 49% increase versus second quarter 2018) |
| |
• | Prime Products sales volume of 17.7 million gallons in second quarter 2019 versus 16.1 million gallons in second quarter 2018 |
| |
• | Reduced debt by $5.1 million in the second quarter and an additional $4 million in July 2019 |
| |
• | AMAK second quarter net loss of $1.3 million and EBITDA of $7.3 million |
| |
• | Conference call at 10:00 am ET Tomorrow, August 6, 2019 |
SUGAR LAND, Texas, August 5, 2019 – Trecora Resources ("Trecora" or the "Company") (NYSE: TREC), a leading provider of specialty hydrocarbons and waxes, today announced financial results for the second quarter ended June 30, 2019.
“Our second quarter’s performance demonstrates our ability to increase earnings and achieve strong cash flow, when we execute well. As we strive towards positive and sustainable operational and financial performance, I am pleased with the current results, specifically in our Specialty Petrochemicals business. Driven by solid operational reliability and cost control, the Company was able to exceed first quarter 2019 results, despite approximately $4 million of headwinds in our P&L attributable to higher feedstock costs. This resulted in consolidated Adjusted EBITDA of $9.2 million, which compares to $8.4 million in first quarter 2019 and $6.2 million in second quarter 2018, a 49% increase,” said Pat Quarles, Trecora’s President and Chief Executive Officer.
“Enhanced safety, running our assets reliably across our operations, delivering on productivity initiatives, and executing on key projects according to plan, all while meeting the high quality expectations of our customers, will continue to be the key drivers to improve our results. While we have further work to do, I am very encouraged by the advances made thus far,” Mr. Quarles added.
Mr. Quarles concluded, “Our process to monetize our ownership in AMAK, which had second quarter EBITDA of $7.3 million, continues to advance and, simultaneously, AMAK continues to make progress in throughput rates, concentrate quality and recoveries. In addition, the Guyan gold project is proceeding on schedule and on budget for a second half 2020 startup. Once complete, the project should significantly add to AMAK’s earnings and cash flow.”
Sami Ahmad, Trecora's Chief Financial Officer stated, “In the second quarter, prime products sales volume of 17.7 million gallons was virtually unchanged from first quarter 2019. Healthy demand from polyethylene and polyurethane markets offset lower sales to the Canadian Oil Sands. In addition, margins for by-products improved from the first quarter due to continued reliable operation of the Advanced Reformer unit and higher by-product prices compared to the first quarter. Strong operating cash flow in the quarter allowed for meaningful debt reduction of $5.1 million. We further reduced debt by an additional $4 million in July, bringing our total outstanding debt to approximately $94 million. Looking ahead, our focus continues to be the safe and reliable operation of our plants, the quality of our products, strong cost management and continued debt reduction.”
Second Quarter 2019 Financial Results
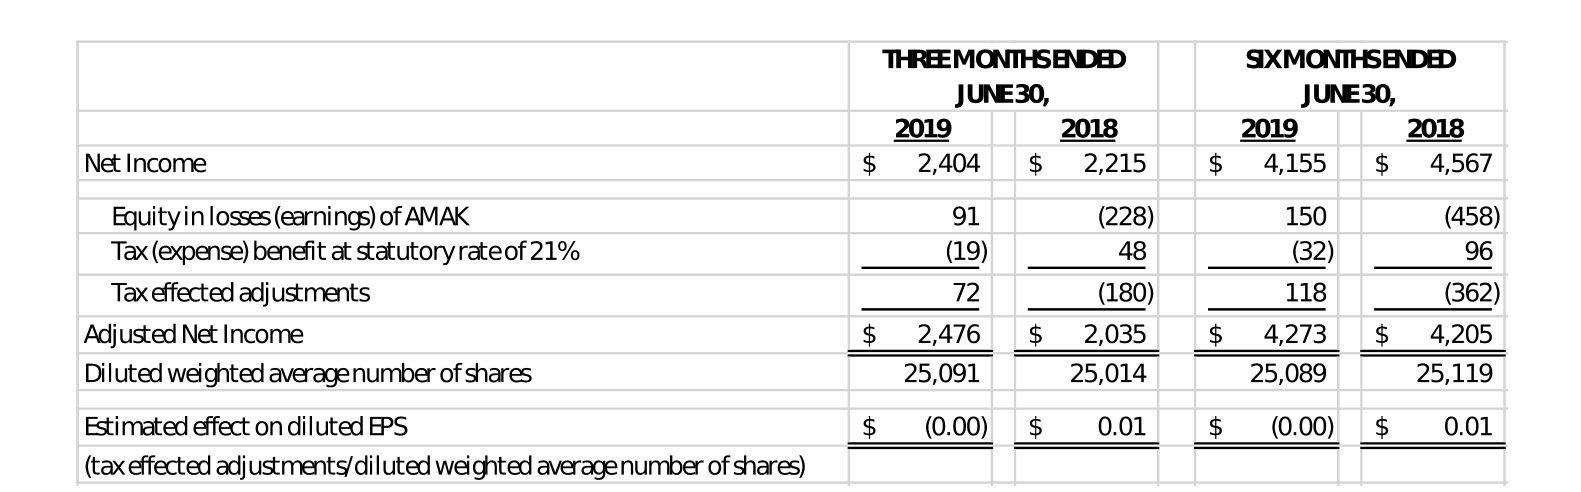
Net income in the second quarter of 2019 was $2.4 million, or $0.10 per diluted share, compared to net income of $2.2 million, or $0.09 per diluted share2, in the second quarter of 2018. Net income for the second quarter includes the impact of equity in losses from AMAK of $0.1 million. Adjusted Net Income for the second quarter of 2019 was $2.5 million, or $0.10 per diluted share1, compared to Adjusted Net Income of $2.0 million, or $0.08 per diluted share, in the second quarter 2018.
Total revenue in the second quarter was $69.4 million compared to $68.1 million in the second quarter of 2018. This year-over-year increase was primarily due to an 8.7% increase in Specialty Petrochemicals sales volume, partially offset by a 4.0% decline in average selling prices, which was mainly due to lower feedstock costs. Revenues from processing declined as compared to the second quarter of 2018 due to the termination of a contract in the fourth quarter of 2018.
Gross profit in the second quarter was $10.6 million, or 15.2% of total revenues, compared to $8.1 million, or 12.0% of total revenues, in the second quarter of 2018. Operating income in the second quarter was $4.3 million compared to $3.4 million for the second quarter of 2018. The improved margins were primarily driven by lower feedstock costs, operation of the Advanced Reformer unit and lower labor costs as a result of the cost reduction program implemented in December 2018.
Specialty Petrochemicals
Specialty Petrochemicals net income was $4.7 million in the second quarter of 2019, compared to net income of $2.9 million in the second quarter of 2018. Specialty Petrochemicals volume in the second quarter was 21.4 million gallons, compared to 22.5 million gallons in the first quarter of 2019 and 19.7 million gallons in the second quarter of 2018. Prime product volume in the second quarter was 17.7 million gallons, compared to 17.6 million gallons in the first quarter of 2019 and 16.1 million gallons in the second quarter of 2018. By-product sales volume was 3.7 million gallons in second quarter 2019. Adjusted EBITDA for Specialty Petrochemicals in the second quarter was $9.9 million compared to $11.4 million in the first quarter of 2019 and $6.1 million in the second quarter of 2018.
|
| | | | | | | | |
Dollar amounts in thousands/rounding may apply | THREE MONTHS ENDED | | |
| JUNE 30, | | |
| 2019 |
| 2,018 |
| % Change |
Product sales |
| $58,583 |
|
| $56,135 |
| 4% |
Processing fees | 1,527 |
| 1,685 |
| (9)% |
Gross revenues |
| $60,110 |
|
| $57,820 |
| 4% |
Operating profit before depreciation and amortization | 10,028 |
| 6,095 |
| 65% |
Operating profit | 7,104 |
| 4,440 |
| 60% |
Net profit before taxes | 6,375 |
| 3,859 |
| 65% |
Depreciation and amortization | 2,925 |
| 1,655 |
| 77% |
Adjusted EBITDA | 9,853 |
| 6,125 |
| 61% |
Capital expenditures | 1,461 |
| 3,529 |
| (59)% |
Specialty Waxes
Specialty Waxes net loss was $1.0 million in the second quarter of 2019, compared to a net loss of $0.5 million in the second quarter of 2018. Specialty Waxes generated revenues of approximately $9.3 million in the second quarter, a $1.0 million increase from the first quarter of 2019, and a $1.0 million decrease from the second quarter of 2018. Revenue included $6.7 million of wax product sales and $2.5 million of processing revenues. Wax sales volumes decreased approximately 5.6% from second quarter 2018 due to disruptions of wax feed supply from our suppliers. Adjusted EBITDA for Specialty Waxes in the second quarter was $0.7 million compared to $(0.9) million in the first quarter of 2019 and $1.1 million in the second quarter of 2018.
|
| | | | | | | | |
Dollar amounts in thousands/rounding may apply | THREE MONTHS ENDED | | |
| JUNE 30, | | |
| 2019 |
| 2,018 |
| % Change |
Product sales |
| $6,745 |
|
| $7,434 |
| (9)% |
Processing fees | 2,516 |
| 2,852 |
| (12)% |
Gross revenues |
| $9,261 |
|
| $10,286 |
| (10)% |
Operating profit before depreciation and amortization | 766 |
| 1,164 |
| (34)% |
Operating loss | (633) |
| (201) |
| 215% |
Net loss before taxes | (1,013) |
| (506) |
| 100% |
Depreciation and amortization | 1,399 |
| 1,365 |
| 2% |
Adjusted EBITDA | 734 |
| 1,140 |
| (36)% |
Capital expenditures | 426 |
| 877 |
| (51)% |
Al Masane Al Kobra Mining Company (“AMAK”)
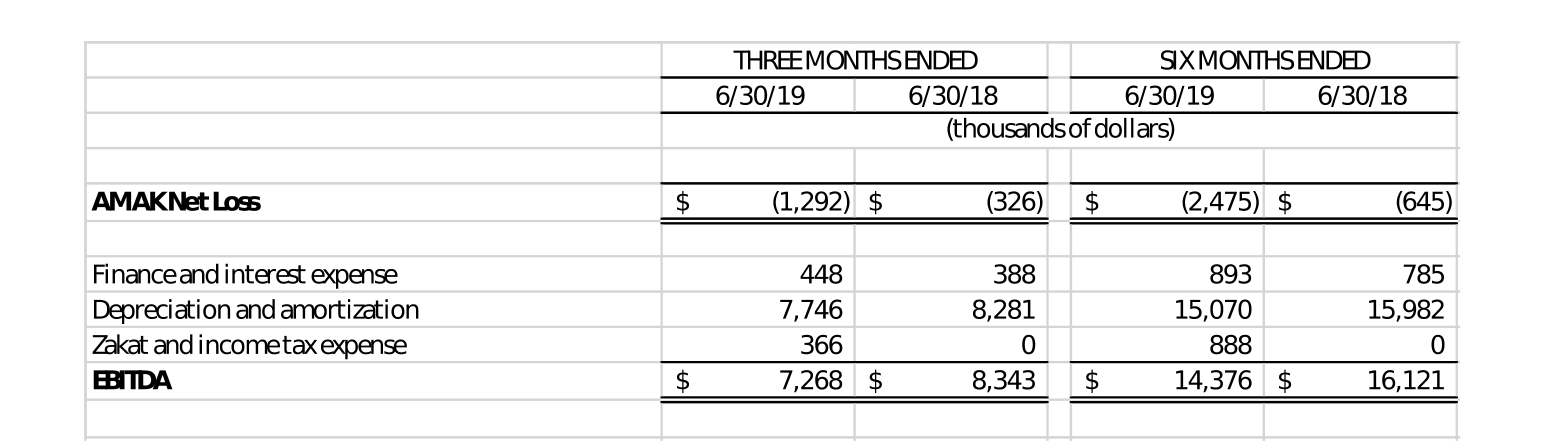
AMAK had a net loss of $1.3 million in the second quarter of 2019, compared to a net loss of $0.3 million in the second quarter of 2018. AMAK’s sales revenue was $20.6 million in the second quarter of 2019, an increase of 5.5% compared to the second quarter of 2018. AMAK’s EBITDA was $7.3 million in the second quarter 2019 compared to $8.3 million in the second quarter of 2018. The year-over-year decline in EBITDA was primarily due to increased cost of sales resulting from a change in inventory valuation methodology and one-time non-recurring expenses. Trecora reported equity in losses of approximately $0.1 million dollars in the second quarter of 2019 compared to equity in earnings of approximately $0.2 million in second quarter of 2018.
Year-to-Date 2019 Financial Results
Net income in the first half of 2019 was $4.2 million, or $0.17 per diluted share, compared to net income of $4.6 million, or $0.18 per diluted share4, for the same period in 2018. Adjusted Net Income in the first half of 2019 was $4.3 million, or $0.17 per diluted share3 compared to Adjusted Net Income of $4.2 million or $0.17 per diluted share, for the same period in 2018. Net income in the first half of 2019 includes the impact of equity in losses from AMAK of $0.2 million.
Total revenue in the first half of 2019 was $134.5 million, compared to $139.8 million for the same period in 2018, a decrease of 3.8%. This decrease was primarily due to a decrease in the average selling price of Specialty Petrochemicals products of 4.0% and lower Specialty Petrochemicals processing revenue of $0.8 million. These two factors were partially offset by a 2.1% increase in Specialty Petrochemicals sales volume.
Gross profit in the first half of 2019 was $20.6 million, or 15.3% of total revenues, compared to $18.3 million, or 13.1% of total revenues, for the same period in 2018. Operating income in the first half of 2019 was $8.1 million, compared to operating income of $7.0 million for the same period in 2018. The improved margins were primarily driven by lower feedstock costs, operation of the Advanced Reformer unit and lower labor costs as a result of the cost reduction program implemented in December 2018.
Specialty Petrochemicals
Specialty Petrochemicals net income was $10.8 million in the first half of 2019, compared to net income of $7.9 million for the same period in 2018. Specialty Petrochemicals volume in the first half of 2019 was 43.9 million gallons, compared to 43.0 million gallons for the same period in 2018. Prime product volume in the first half of 2019 was 35.4 million gallons, compared to 33.7 million gallons in the same period 2018. Adjusted EBITDA for Specialty Petrochemicals in the first half of 2019 increased 46% to $21.3 million, compared to $14.5 million for the same period in 2018.
|
| | | | | | | | |
Dollar amounts in thousands/rounding may apply | SIX MONTHS ENDED | | |
| JUNE 30, | | |
| 2019 |
| 2,018 |
| % Change |
Product sales |
| $114,073 |
|
| $116,420 |
| (2)% |
Processing fees | 2,910 |
| 3,713 |
| (22)% |
Gross revenues |
| $116,983 |
|
| $120,133 |
| (3)% |
Operating profit before depreciation and amortization | 21,435 |
| 14,488 |
| 48% |
Operating profit | 15,437 |
| 11,119 |
| 39% |
Net profit before taxes | 13,510 |
| 9,913 |
| 36% |
Depreciation and amortization | 5,999 |
| 3,369 |
| 78% |
Adjusted EBITDA | 21,258 |
| 14,515 |
| 46% |
Capital expenditures | 2,839 |
| 13,812 |
| (79)% |
Specialty Waxes
Specialty Waxes had a net loss of $3.6 million in the first half of 2019 compared to a net loss of $1.7 million for the same period in 2018. Specialty Waxes had revenues of $17.5 million in the first half of 2019, an 11.8% decrease from the same period of 2018. Revenues included $12.7 million of wax product sales and $4.8 million of processing revenues. Wax sales volumes in the first half of 2019 decreased approximately 11.2% from the same period 2018 due to the planned maintenance turnaround in the first quarter of 2019 along with disruptions of wax feed supply from our suppliers. Adjusted EBITDA for Specialty Waxes in the first half of 2019 was $(0.2) million, compared to $1.5 million for the same period in 2018.
|
| | | | | | | | |
Dollar amounts in thousands/rounding may apply | SIX MONTHS ENDED | | |
| JUNE 30, | | |
| 2019 |
| 2,018 |
| % Change |
Product sales |
| $12,748 |
|
| $13,817 |
| (8)% |
Processing fees | 4,795 |
| 6,064 |
| (21)% |
Gross revenues |
| $17,543 |
|
| $19,881 |
| (12)% |
Operating profit (loss) before depreciation and amortization | (83) |
| 1,554 |
| (105)% |
Operating loss | (2,830) |
| (1,115) |
| 154% |
Net loss before taxes | (3,552) |
| (1,687) |
| 111% |
Depreciation and amortization | 2,747 |
| 2,669 |
| 3% |
Adjusted EBITDA | (154) |
| 1,519 |
| (110)% |
Capital expenditures | 935 |
| 1,622 |
| (42)% |
AMAK
AMAK had a net loss of $2.5 million in the first half of 2019, compared with a net loss of $0.6 million in the first half of 2018. Revenue was $41.2 million in the first half of 2019, an increase of 22.8% compared to the first half of 2018. EBITDA was $14.4 million in the first half of 2019, compared to $16.1 million in the first half of 2018. The year-over-year decline in EBITDA was primarily due to increased cost of sales resulting from a change in inventory valuation methodology and one-time non-recurring expenses. Trecora reported equity in losses of approximately $0.2 million dollars in the first half of 2019 compared to equity in earnings of approximately $0.5 million in the first half of 2018.
Earnings Call
To participate via telephone, callers should dial in five to ten minutes prior to the 10:00 am Eastern start time; domestic callers (U.S. and Canada) should call +1-866-417-5724 or
+1-409-217-8234 if calling internationally, using the conference ID 5585897. To listen to the playback, please call 1-855-859-2056 if calling within the United States or 1-404-537-3406 if calling internationally. Use pin number 5585897 for the replay.
Use of Non-GAAP Measures
This press release includes the use of both U.S. generally accepted accounting principles ("GAAP") and non-GAAP financial measures. The Company believes certain financial measures, such as EBITDA, Adjusted EBITDA, Adjusted EBITDA Margin and Adjusted Net Income (Loss), which are non-GAAP measures, provide users of our financial statements with supplemental information that may be useful in evaluating our operating performance. The Company believes that such non-GAAP measures, when read in conjunction with our operating results presented under GAAP, can be used to better assess our performance from period to period and relative to performance of other companies in our industry, without regard to financing methods, historical cost basis or capital structure. These measures are not measures of financial performance or liquidity under GAAP and should be considered in addition to, and not as a substitute for, analysis of our results under GAAP.
These non-GAAP measures have been reconciled to the nearest GAAP measure in the tables below entitled Reconciliation of Selected GAAP Measures to Non-GAAP Measures.
EBITDA, Adjusted EBITDA and Adjusted EBITDA Margin: We define EBITDA as net income (loss) plus interest expense (benefit) including derivative gains and losses, income taxes, depreciation and amortization. We define Adjusted EBITDA as EBITDA plus share-based compensation, plus restructuring and severance expenses, plus losses on extinguishment of debt, plus or minus equity in AMAK's earnings and losses or gains from equity issuances, and plus or minus gains or losses on acquisitions. We define Adjusted EBITDA Margin as Adjusted EBITDA as a percentage of revenue.
Adjusted Net Income (Loss): We define Adjusted Net Income (Loss) as net income (loss) plus or minus tax effected equity in AMAK's earnings and losses, minus tax effected restructuring and severance expenses.
Forward-Looking Statements
Some of the statements and information contained in this press release may constitute forward-looking statements within the meaning of the Private Securities Litigation Reform Act of 1995. Statements regarding the Company's financial position, business strategy and plans and objectives of the Company's management for future operations and other statements that are not historical facts, are forward-looking statements. Forward-looking statements are often characterized by the use of words such as "outlook," "may," "will," "should," "could," "expects," "plans," "anticipates," "contemplates," "proposes," "believes," "estimates," "predicts," "projects," "potential," "continue," "intend," or the negative of such terms and other comparable terminology, or by discussions of strategy, plans or intentions, including, but not limited to: expectations regarding future market trends; expectations regarding our intention to monetize our ownership in AMAK; and expectations regarding the timing and completion of AMAK’s Guyan gold project and its impact on AMAK’s financial performance.
Forward-looking statements are subject to risks, uncertainties and other factors that could cause actual results to differ materially from those expressed or implied by such statements. Such risks, uncertainties and factors include, but are not limited to: general economic conditions domestically and internationally; insufficient cash flows from operating activities; difficulties in obtaining financing on favorable conditions, or at all; outstanding debt and other financial and legal obligations; lawsuits; competition; industry cycles; feedstock, product and mineral prices; feedstock availability; technological developments; regulatory changes; environmental matters; foreign government instability; foreign legal and political concepts; foreign currency fluctuations; and other risks detailed in our latest Annual Report on Form 10-K, including but not limited to "Part I, Item 1A. Risk Factors" and "Part II, Item 7. Management's Discussion and Analysis of Financial Condition and Results of Operations" therein, and in our other filings with the Securities and Exchange Commission (the "SEC"). There may be other factors of which we are currently unaware or deem immaterial that may cause our actual results to differ materially from the forward-looking statements. In addition, to the extent any inconsistency or conflict exists between the information included in this press release and the information included in our prior releases, reports and other filings with the SEC, the information contained in this press release updates and supersedes such information. Forward-looking statements are based on current plans, estimates, assumptions and projections, and, therefore, you should not place undue reliance on them. Forward-looking statements speak only as of the date they are made, and we undertake no obligation to update them in light of new information or future events.
About Trecora Resources (TREC)
TREC owns and operates a specialty petrochemicals facility specializing in high purity hydrocarbons and other petrochemical manufacturing and a specialty wax facility, both located in Texas, and provides custom processing services at both facilities. In addition, the Company is the original developer and a 33.3% owner of Al Masane Al Kobra Mining Co., a Saudi Arabian joint stock company.
Investor Relations Contact:
Jean Marie Young
The Piacente Group, Inc.
212-481-2050
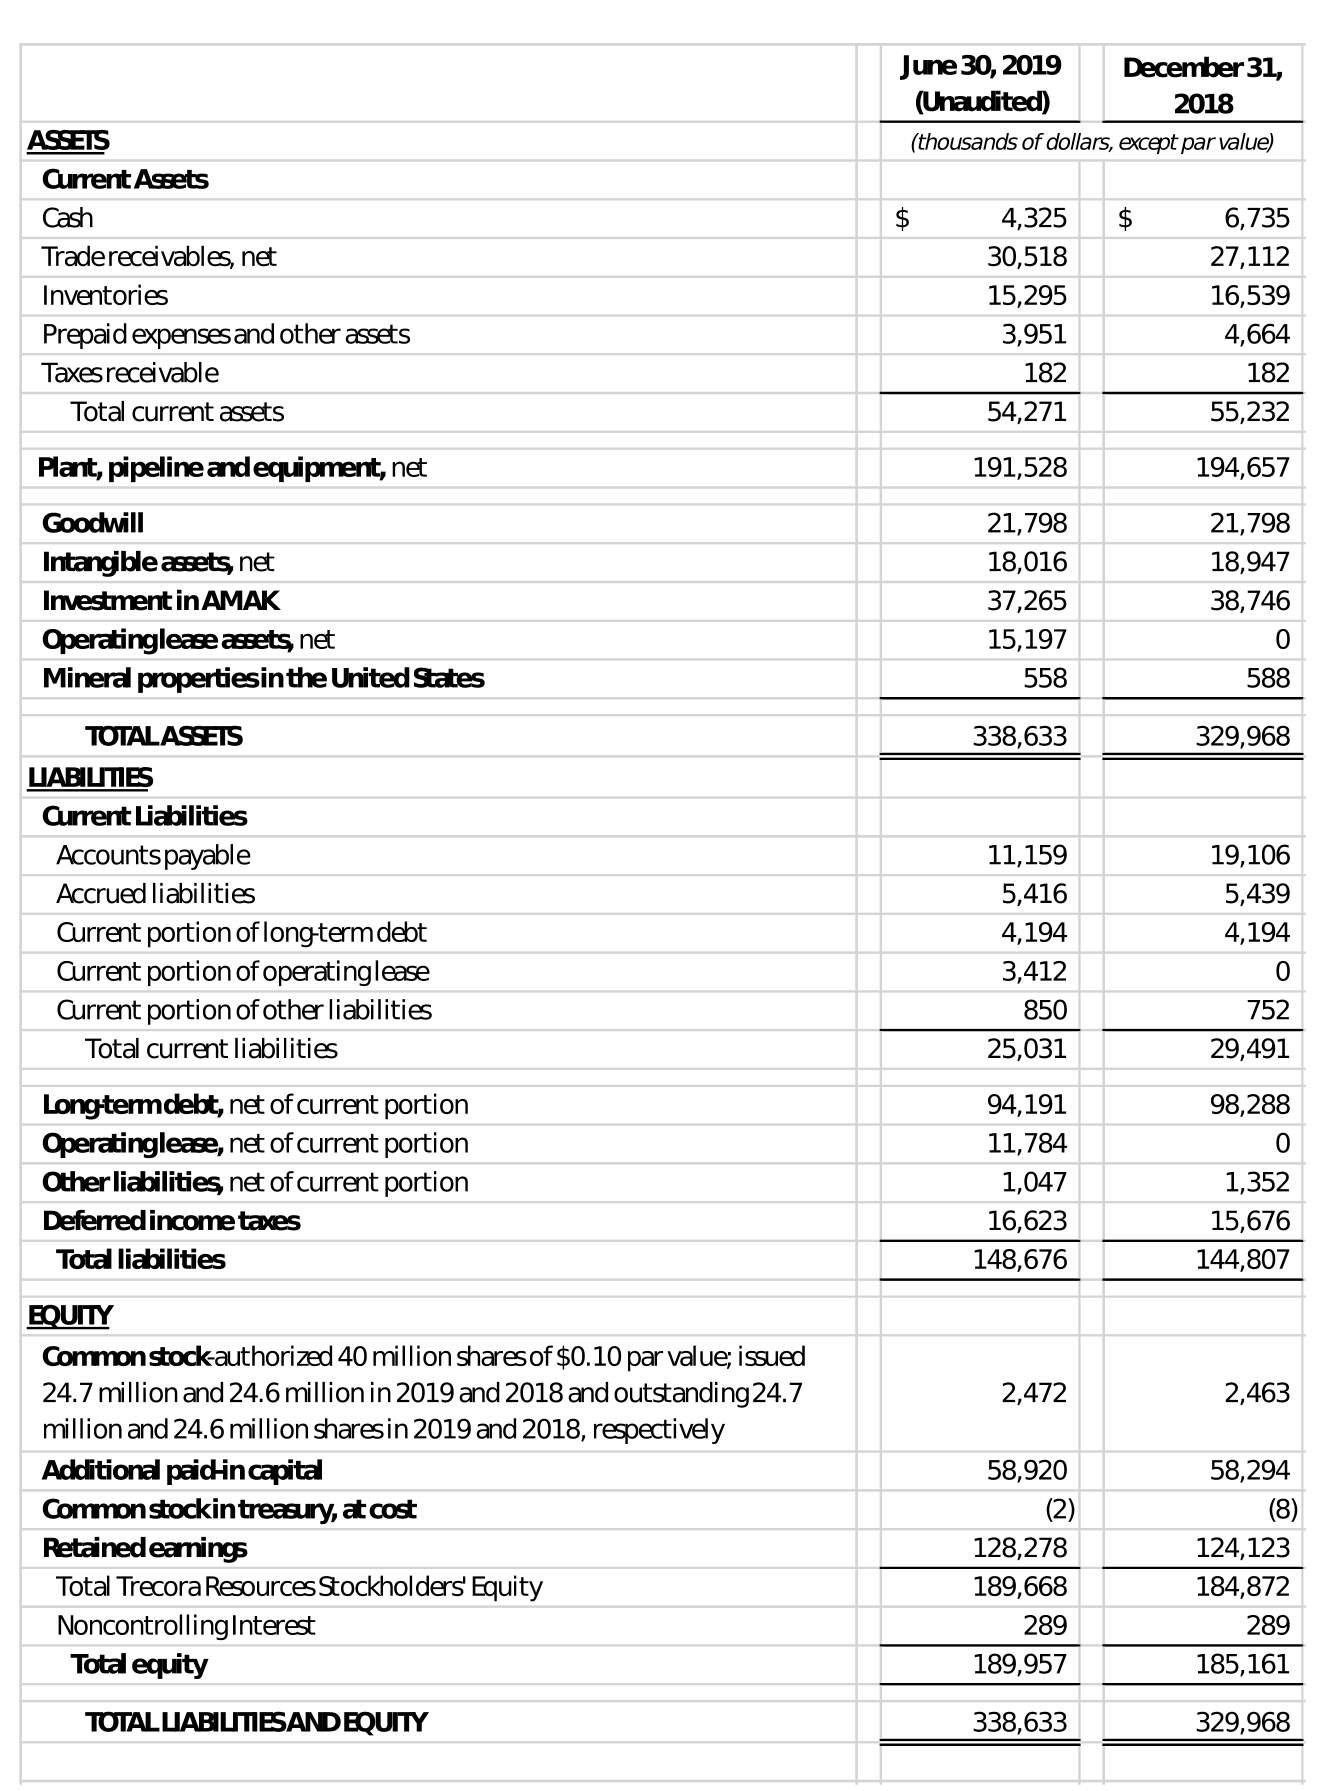
TRECORA RESOURCES AND SUBSIDIARIES
CONSOLIDATED BALANCE SHEETS
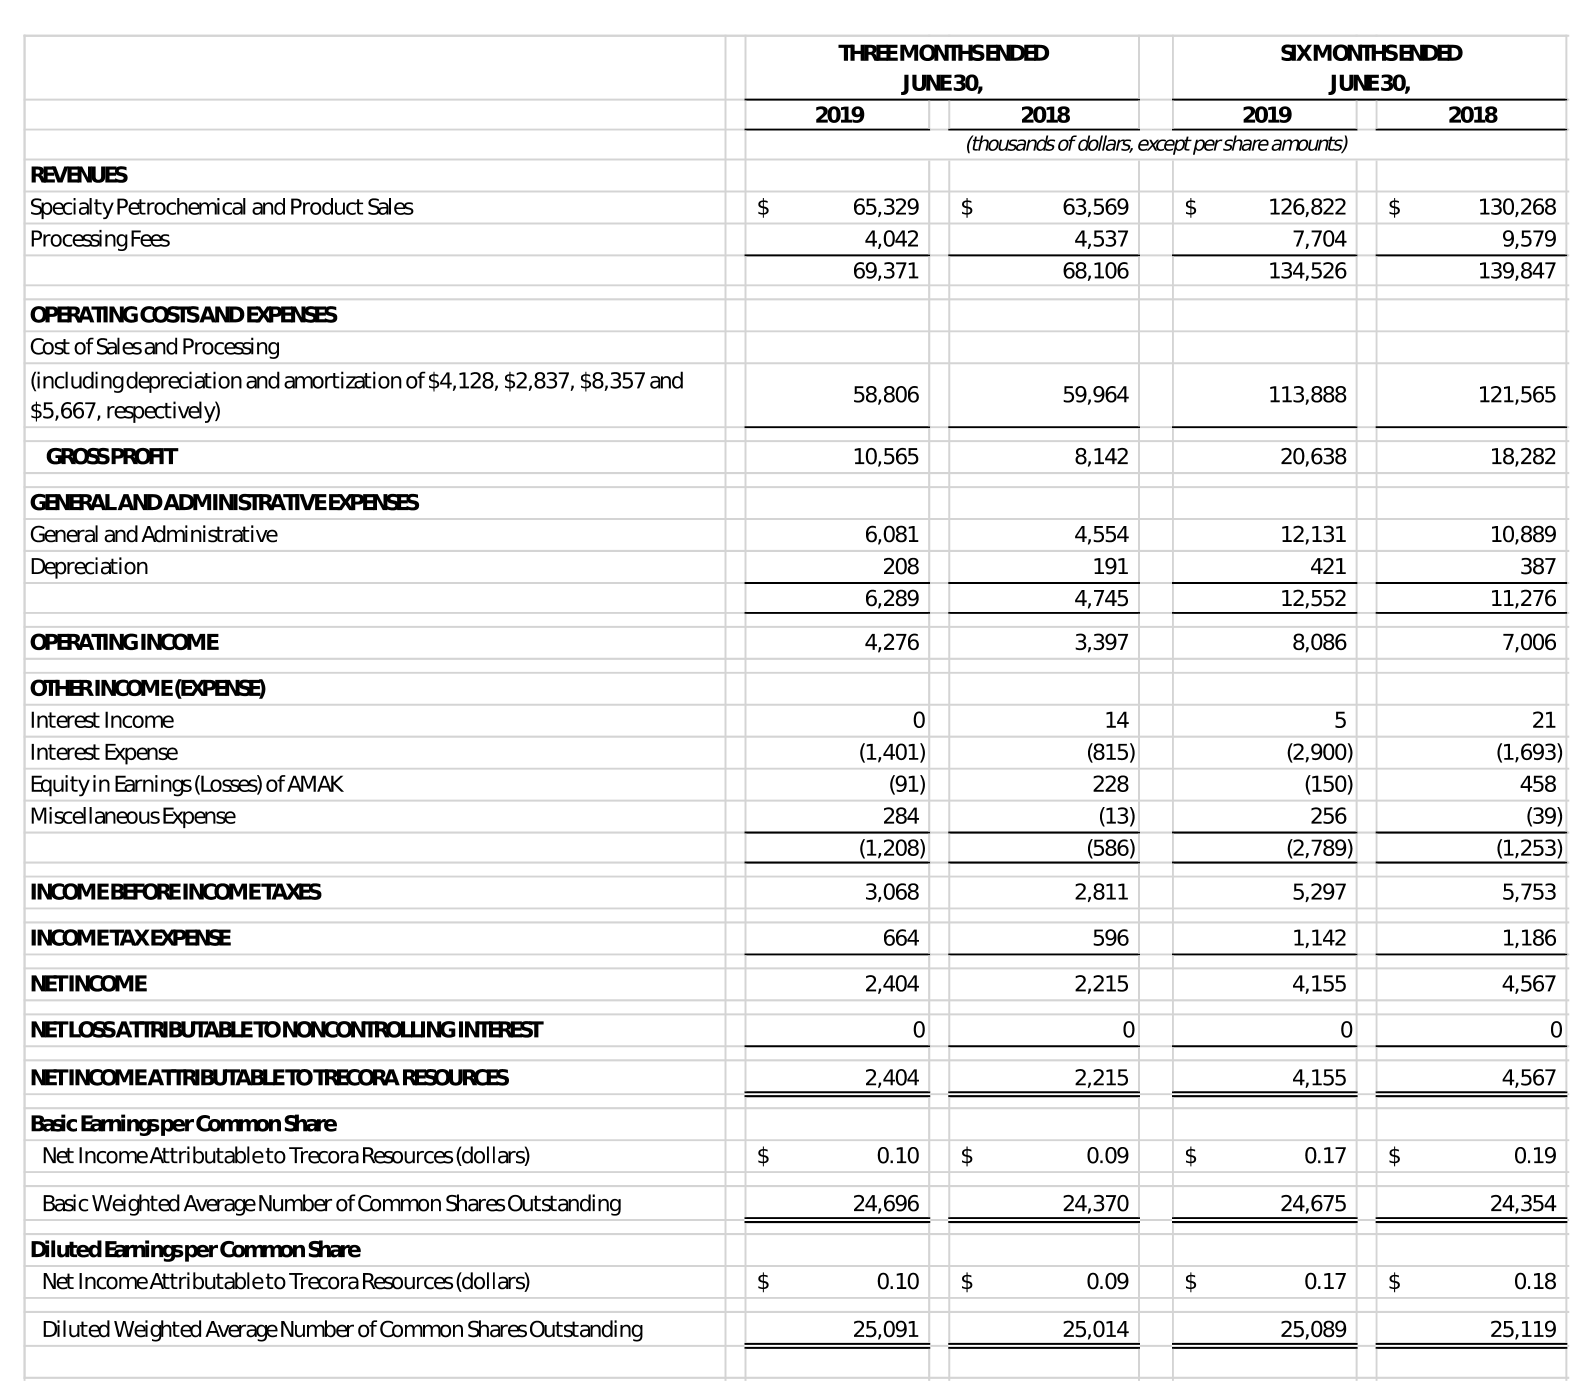
TRECORA RESOURCES AND SUBSIDIARIES
CONSOLIDATED STATEMENTS OF INCOME
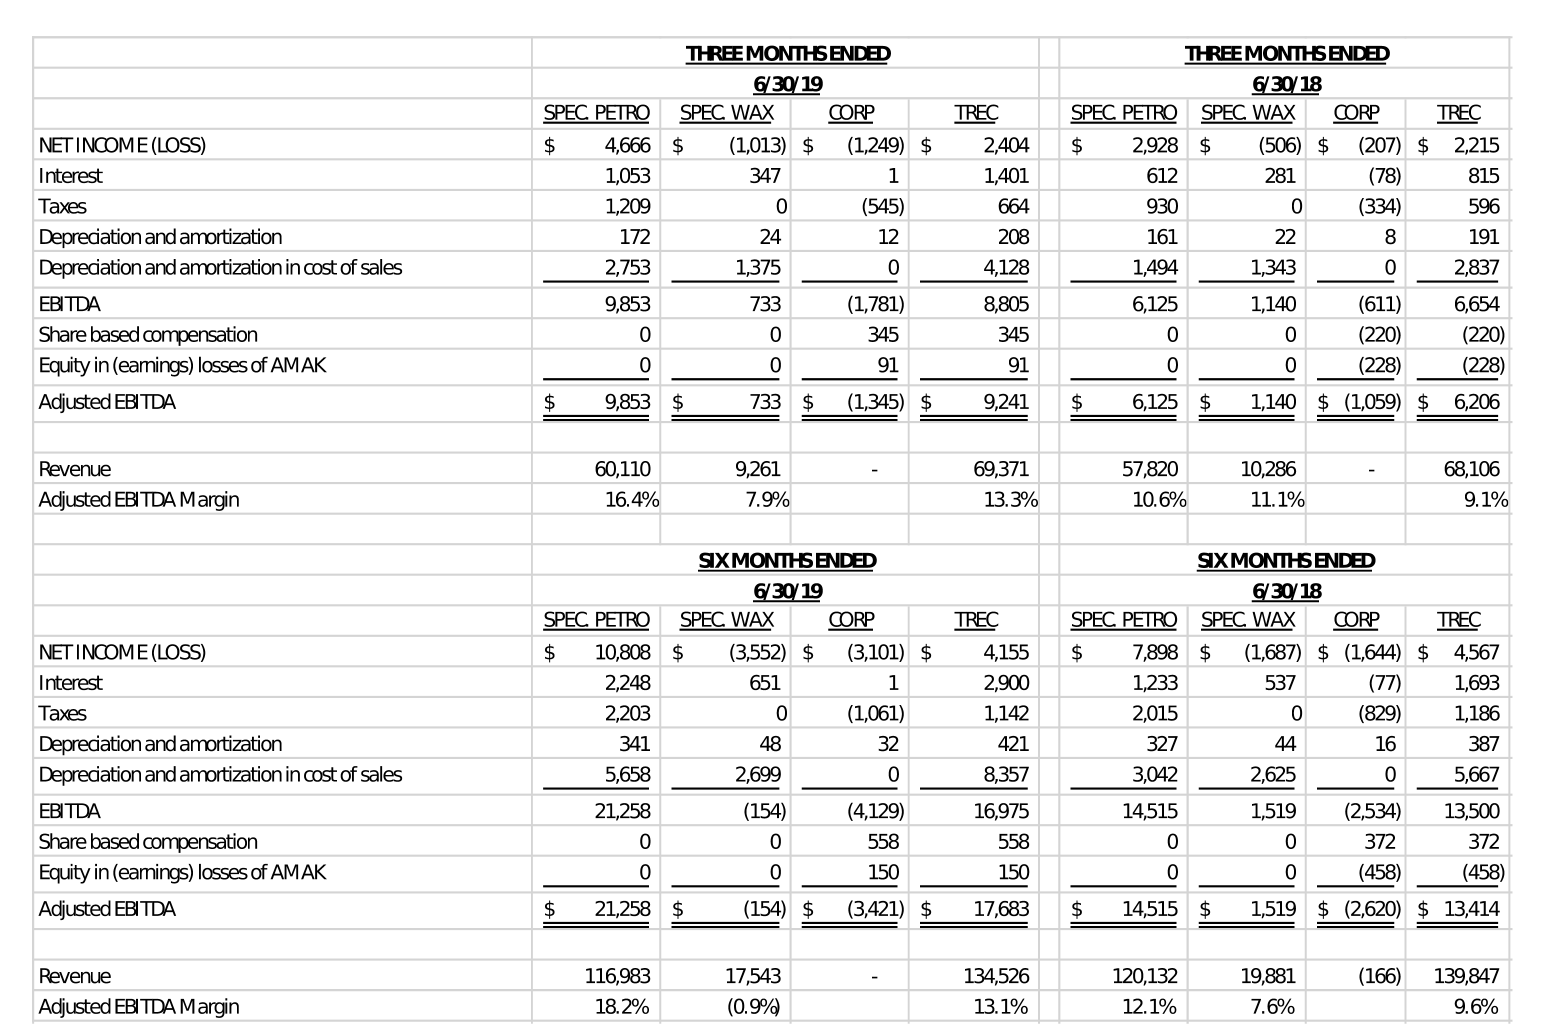
TRECORA RESOURCES AND SUBSIDIARIES
RECONCILIATION OF SELECTED GAAP MEASURES TO NON-GAAP MEASURES
EBITDA, Adjusted EBITDA and Adjusted EBITDA Margin
(thousands of dollars; rounding may apply)
Adjusted Net Income and Estimated EPS Impact
(thousands of dollars, except per share amounts; rounding may apply)