
Trecora Resources Reports Fourth Quarter and Full Year 2019 Results
• | Full year 2019 net loss from continuing operations of $12.9 million, and fourth quarter 2019 net loss from continuing operations of $18.7 million, which include a non-cash impairment charge for Trecora Chemical’s goodwill and certain intangibles of $24.2 million in fourth quarter |
• | Operational execution drove full year 2019 Adjusted EBITDA from continuing operations of $31.0 million, a 50% increase year-over-year |
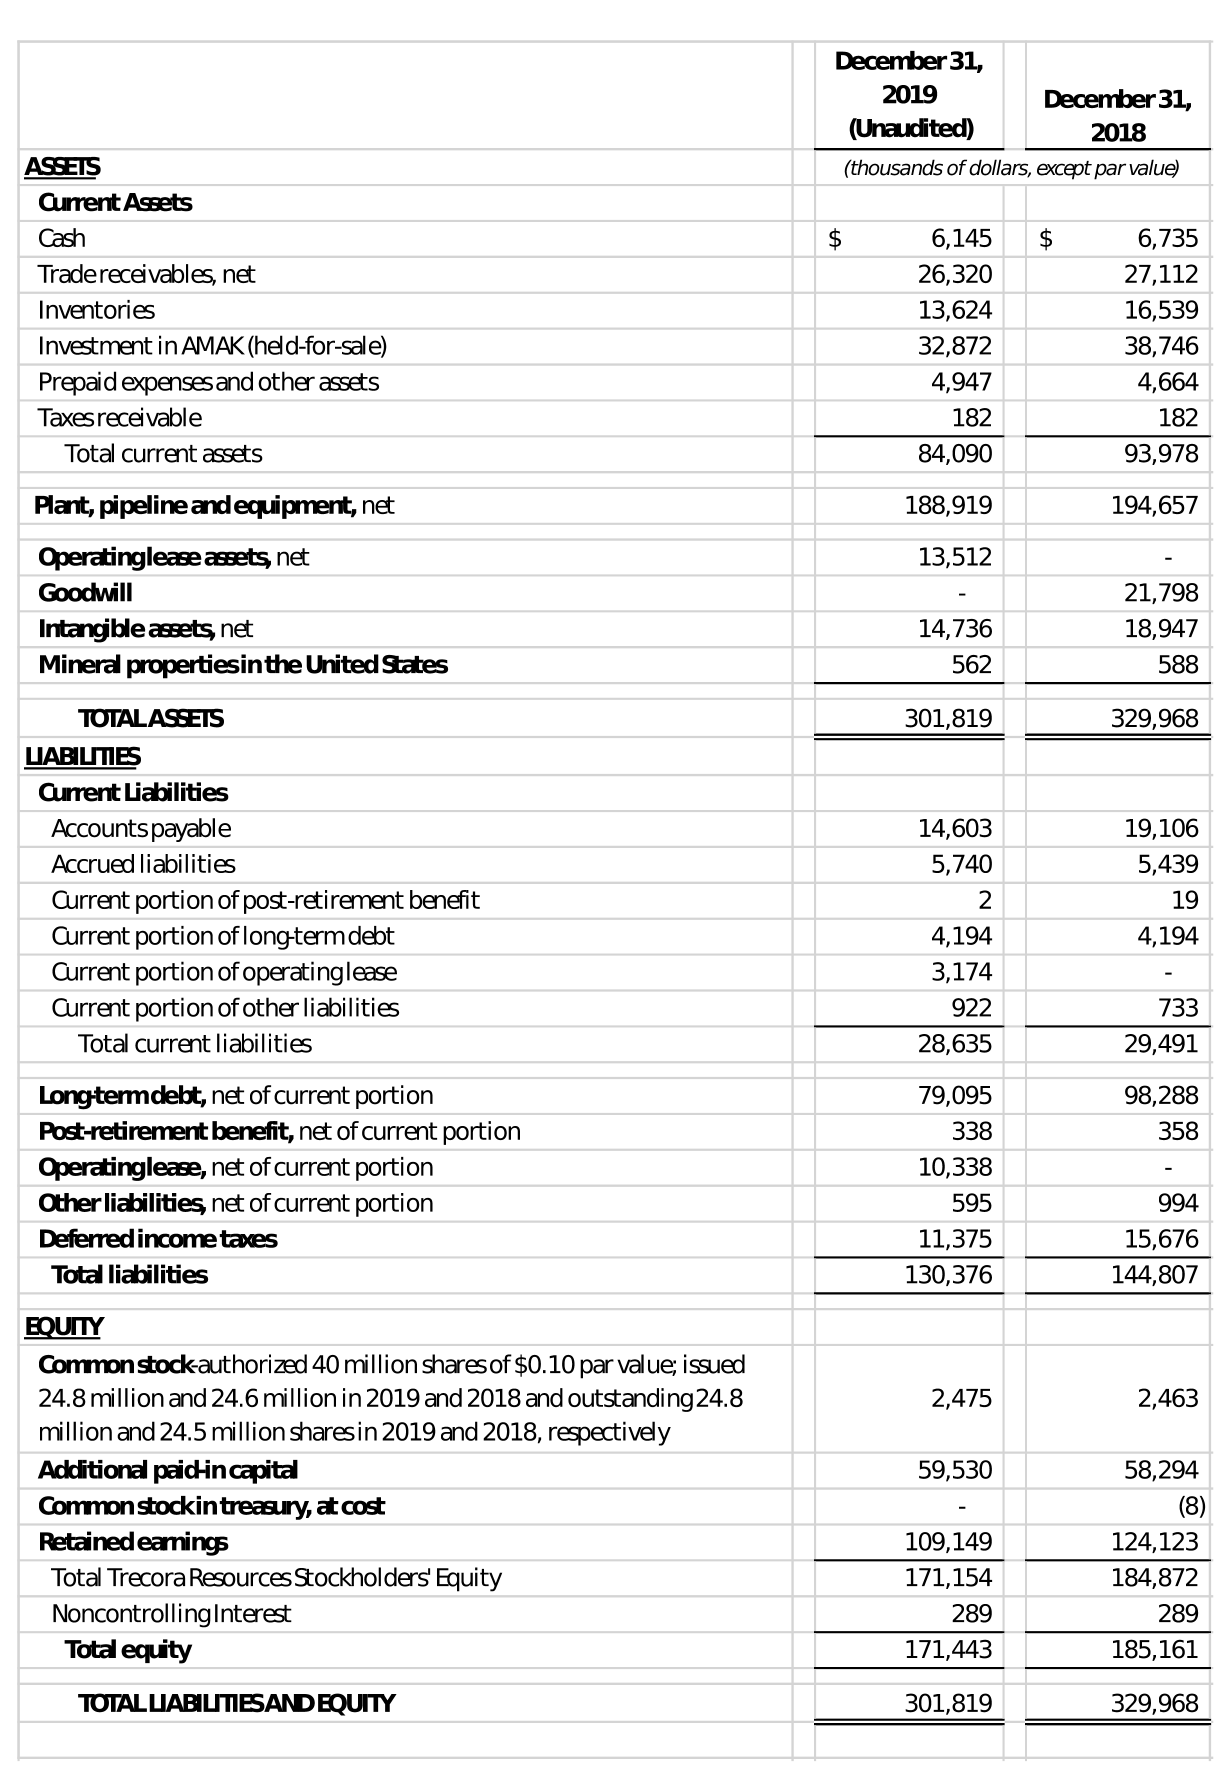
• | Reduced debt by $19.2 million in 2019; Debt of $83.3 million at end of 2019 |
• | Achieved 30% year-over-year growth in operating cash flow from continuing operations |
• | Received government approval for AMAK share sale |
• | Announcing launch of new growth plan initiative |
• | Conference call at 10:00 am ET tomorrow, March 10, 2019 |
SUGAR LAND, Texas, March 9, 2020 – Trecora Resources ("Trecora" or the "Company") (NYSE: TREC), a leading provider of specialty hydrocarbons and specialty waxes, today announced financial results for the fourth quarter and full year ended December 31, 2019.
“As evidenced by our 2019 results, Trecora had a strong year highlighted by improved cash flow and debt reduction. Operational reliability, disciplined cost control and consistent execution drove the Company’s fourth quarter 2019 results, yielding gross profit of $8.3 million and consolidated Adjusted EBITDA from continuing operations of $6.4 million. This resulted in 2019 gross profit of $38.5 million, a 38% increase over 2018, and 2019 consolidated Adjusted EBITDA from continuing operations of $31.0 million, which was at the high end of our indicated range and a 50% improvement compared to 2018,” said Pat Quarles, Trecora’s President and Chief Executive Officer.
Regarding the AMAK sale process, Mr. Quarles added, “We recently received approval from the Ministry of Industry and Mineral Resources in Saudi Arabia, a critical milestone in completing the sale of this non-core asset. We are working on finalizing the remaining issues
to closing. We delivered a notice to the buyers scheduling closing and believe the closing of the sale process is possible by the end of this quarter.”
Mr. Quarles continued, “Looking ahead, we will continue focusing on improving our base businesses while we extend our execution strategy towards profitable growth opportunities. We have launched a new growth initiative comprised of a broad base of projects that has identified meaningful opportunities to raise our profitability and drive value, in both 2020 and in the years to come.”
Sami Ahmad, Trecora's Chief Financial Officer stated, “We are very pleased with our 2019 financial results, which met or exceeded all of our financial goals. While we continued to manage challenges in certain key end markets, we generated solid underlying margins and strong free cash flow, allowing us to significantly reduce our debt. Consolidated gross margin was 14.9% in 2019, significantly improved from 9.7% in 2018. This margin improvement was a result of lower feedstock costs, lower operating expenses and improved plant operations, specifically in our Specialty Petrochemicals segment, which saw its gross margins improve to 17.7% in 2019 from 10.4% in 2018.”
Fourth Quarter 2019 Financial Results
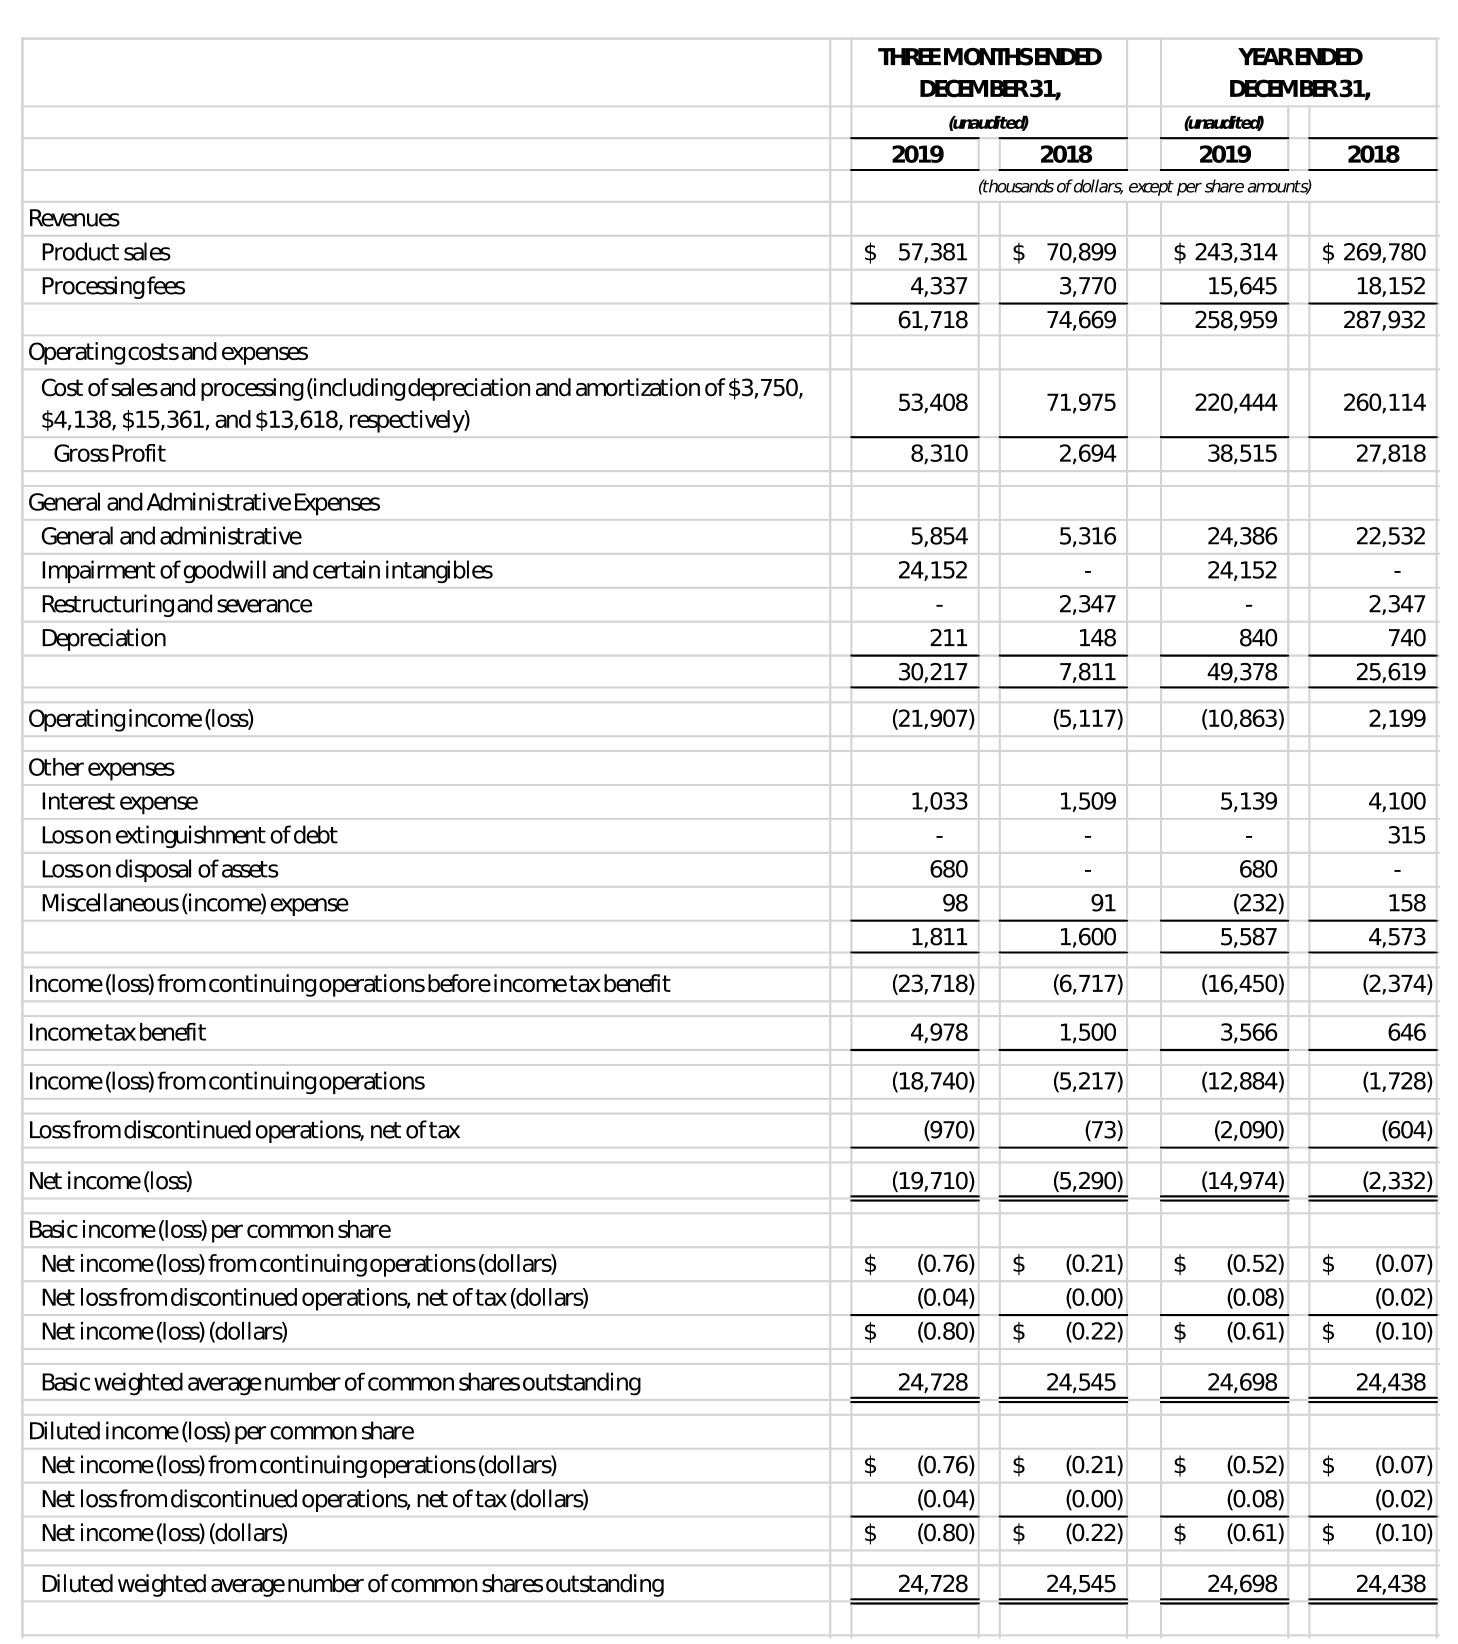
Net loss from continuing operations in the fourth quarter of 2019 was $18.7 million, or $(0.76) per diluted share, compared to a net loss from continuing operations of $5.2 million, or $(0.21) per diluted share, in the fourth quarter of 2018. The fourth quarter of 2019 included an impairment charge for goodwill and certain intangibles in our Specialty Waxes segment of $24.2 million.
Total revenue in the fourth quarter of 2019 was $61.7 million compared to $74.7 million in the fourth quarter of 2018. This year-over-year decrease was primarily due to a 18.8% decrease in Specialty Petrochemicals sales volume. The improved operation of the Advance Reformer unit resulted in volumetric yield loss, leading to lower sales volumes.
Gross profit in the fourth quarter of 2019 was $8.3 million, or 13.5% of totalrevenues, compared to $2.7 million, or 3.6% of total revenues, in the fourth quarter of 2018. Operating loss in the fourth quarter of 2019 was $21.9 million compared to operating loss of $5.1 million for the fourth quarter of 2018. The improved gross margins were primarily driven by lower feedstock costs, more reliable operation of the Advanced Reformer unit and lower labor costs as a result of the cost reduction program implemented in December 2018.
Specialty Petrochemicals
Specialty Petrochemicals net income from continuing operations was $8.5 million in the fourth quarter of 2019, compared to net loss of $2.4 million in the fourth quarter of 2018. Specialty Petrochemicals volume in the fourth quarter of 2019 was 20.3 million gallons,
2
compared to 20.5 million gallons in the third quarter of 2019 and 25.1 million gallons in the fourth quarter of 2018.
Prime product volume in the fourth quarter of 2019 was 16.3 million gallons, compared to 16.4 million gallons in the third quarter of 2019 and 18.7 million gallons in the fourth quarter of 2018. By-product sales volume was 4.0 million gallons in the fourth quarter of 2019. Adjusted EBITDA from continuing operations for Specialty Petrochemicals in the fourth quarter of 2019 was $8.0 million compared to $2.0 million in the fourth quarter of 2018.
Dollar amounts in thousands/rounding may apply | THREE MONTHS ENDED | |||||||
DECEMBER 31, | ||||||||
2019 | 2,018 | % Change | ||||||
Product sales | $ | 51,393 | $ | 64,669 | (21)% | |||
Processing fees | 1,450 | 1,147 | 26% | |||||
Gross revenues | $52,843 | $ | 65,816 | (20)% | ||||
Operating profit before depreciation and amortization | 7,011 | 2,366 | 196% | |||||
Operating profit (loss) | 5,419 | (546) | 1,092% | |||||
Net profit (loss) before taxes | 3,900 | (1,769) | 320% | |||||
Depreciation and amortization | 1,592 | 2,912 | (45)% | |||||
Adjusted EBITDA from continuing operations | 8,020 | 2,043 | 292% | |||||
Capital expenditures | 1,953 | 6,057 | (68)% | |||||
Specialty Waxes
Specialty Waxes net loss from continuing operations was $25.5 million in the fourth quarter of 2019, compared to a net loss of $1.7 million in the fourth quarter of 2018. Specialty Waxes generated revenues of approximately $8.9 million in the fourth quarter of 2019, a $0.6 million decrease from the third quarter of 2019, and a $0.3 million decrease from the fourth quarter of 2018. Revenue included $6.0 million of wax product sales and $2.9 million of processing revenues. Wax sales volumes decreased approximately 3.0% from fourth quarter 2018 due to disruptions of wax feed supply from our suppliers. Adjusted EBITDA from continuing operations for Specialty Waxes in the fourth quarter of 2019 was $0.2 million compared to $(0.1) million in the fourth quarter of 2018.
3
Dollar amounts in thousands/rounding may apply | THREE MONTHS ENDED | |||||||
DECEMBER 31, | ||||||||
2019 | 2,018 | % Change | ||||||
Product sales | $5,989 | $ | 6,262 | (4)% | ||||
Processing fees | 2,887 | 2,373 | 22% | |||||
Gross revenues | $8,876 | $ | 8,635 | 3% | ||||
Operating profit (loss) before depreciation and amortization | 163 | (20) | 913% | |||||
Operating loss | (1,135) | (1,376) | 18% | |||||
Net loss before taxes | (1,389) | (1,734) | 20% | |||||
Depreciation and amortization | 1,298 | 1,356 | (4)% | |||||
Adjusted EBITDA from continuing operations | 154 | (111) | 238% | |||||
Capital expenditures | 1,828 | 138 | 1,226% | |||||
2019 Full Year Results
Net loss from continuing operations for full year 2019 was $12.9 million, or $(0.52) per diluted share, compared to net loss from continuing operations of $1.7 million, or $(0.07) per diluted share, for the same period in 2018.
Total revenue for full year 2019 was $259.0 million, compared to $287.9 million for the same period in 2018, a decrease of 10.1%. This decline was primarily due to a
decrease in Specialty Petrochemicals sales volume.
Gross profit for full year 2019 was $38.5 million, or 14.9% of total revenues, compared to $27.8 million, or 9.7% of total revenues, for the same period in 2018. Operating loss for full year 2019 was $10.9 million, compared to operating income of $2.2 million for the same period in 2018. The improved margins were primarily driven by an increase in margins for both prime products and by-products. Prime product margins benefited from lower feedstock costs while significantly greater reliability of the Advanced Reformer unit contributed to an increase in by-product margins. Additionally, full year 2019 operating expenses declined approximately 2.1%, or nearly $2.2 million, compared to 2018.
Specialty Petrochemicals
Net income from continuing operations for Specialty Petrochemicals was $25.6 million in 2019 as compared to net income from continuing operations of $8.0 million in 2018. The Company's worldwide Specialty Petrochemical’s demand decreased during 2019 compared to 2018. Product sales revenue decreased 9.9% driven primarily by volume decline of 5.4%.
4
Much of the decline in sales volume was due to lower by-product sales in 2019 compared to 2018. The improved operation of the Advanced Reformer unit resulted in volumetric yield loss, leading to lower volumes. Specialty Petrochemical volume in 2019 was 84.8 million gallons compared with 89.6 million gallons in 2018. Prime product volume in 2019 was 68.1 million gallons compared with 69.4 million gallons in 2018. By-product volume decreased 17.6% year-over-year to 16.7 million gallons.
Dollar amounts in thousands/rounding may apply | YEAR ENDED | |||||||
DECEMBER 31, | ||||||||
2019 | 2,018 | % Change | ||||||
Product sales | $218,743 | $ | 242,763 | (10)% | ||||
Processing fees | 5,568 | 6,916 | (19)% | |||||
Gross revenues | $224,311 | $ | 249,679 | (10)% | ||||
Operating profit before depreciation and amortization | 38,860 | 23,021 | 69% | |||||
Operating profit | 28,304 | 14,089 | 101% | |||||
Net profit before taxes | 23,993 | 10,705 | 124% | |||||
Depreciation and amortization | 10,556 | 8,932 | 18% | |||||
Adjusted EBITDA from continuing operations | 39,154 | 22,744 | 72% | |||||
Capital expenditures | 6,955 | 22,431 | (69)% | |||||
Specialty Waxes
Net loss from continuing operations for Specialty Waxes was $31.2 million in 2019 as compared to a net loss from continuing operations of $4.7 million in 2018. The Company's Specialty Waxes segment generated full year 2019 revenues of $34.6 million, down 9.4% from $38.3 million in 2018. Planned maintenance turnaround at our Pasadena facility in the first quarter of 2019 along with outages at multiple feed suppliers limited our specialty wax production and sales. Full year 2019 wax sales volume decreased 7.8% compared to the same period a year ago.
5
Dollar amounts in thousands/rounding may apply | YEAR ENDED | |||||||
DECEMBER 31, | ||||||||
2019 | 2,018 | % Change | ||||||
Product sales | $24,571 | $ | 27,017 | (9)% | ||||
Processing fees | 10,078 | 11,236 | (10)% | |||||
Gross revenues | $34,648 | $ | 38,253 | (9)% | ||||
Operating profit (loss) before depreciation and amortization | (180) | 1,949 | (109)% | |||||
Operating loss | (5,773) | (3,427) | (68)% | |||||
Net loss before taxes | (7,012) | (4,660) | (50)% | |||||
Depreciation and amortization | 5,593 | 5,376 | 4% | |||||
Adjusted EBITDA from continuing operations | (207) | 1,785 | (112)% | |||||
Capital expenditures | 3,124 | 2,854 | 9% | |||||
Earnings Call
Tomorrow’s conference call and presentation slides will be simulcast live on the Internet, and can be accessed on the investor relations section of the Company's website at http://www.trecora.com or at https://edge.media-server.com/mmc/p/rx3xskog. A replay of the call will also be available through the same link.
To participate via telephone, callers should dial in five to ten minutes prior to the 10:00 am Eastern start time; domestic callers (U.S. and Canada) should call +1-866-417-5724 or
+1-409-217-8234 if calling internationally, using the conference ID 4490957. To listen to the playback, please call 1-855-859-2056 if calling within the United States or 1-404-537-3406 if calling internationally. Use pin number 5790838 for the replay.
+1-409-217-8234 if calling internationally, using the conference ID 4490957. To listen to the playback, please call 1-855-859-2056 if calling within the United States or 1-404-537-3406 if calling internationally. Use pin number 5790838 for the replay.
Use of Non-GAAP Measures
This press release includes the use of both U.S. generally accepted accounting principles ("GAAP") and non-GAAP financial measures. The Company believes certain financial measures, such as EBITDA from continuing operations and Adjusted EBITDA from continuing operations, which are non-GAAP measures, provide users of our financial statements with supplemental information that may be useful in evaluating our operating performance. The Company believes that such non-GAAP measures, when read in conjunction with our operating results presented under GAAP, can be used to better assess our performance from period to period and relative to performance of other companies in our industry, without regard to financing methods, historical cost basis or capital structure. These
6
measures are not measures of financial performance or liquidity under GAAP and should be considered in addition to, and not as a substitute for, analysis of our results under GAAP.
These non-GAAP measures have been reconciled to the nearest GAAP measure in the tables below entitled Reconciliation of Selected GAAP Measures to Non-GAAP Measures.
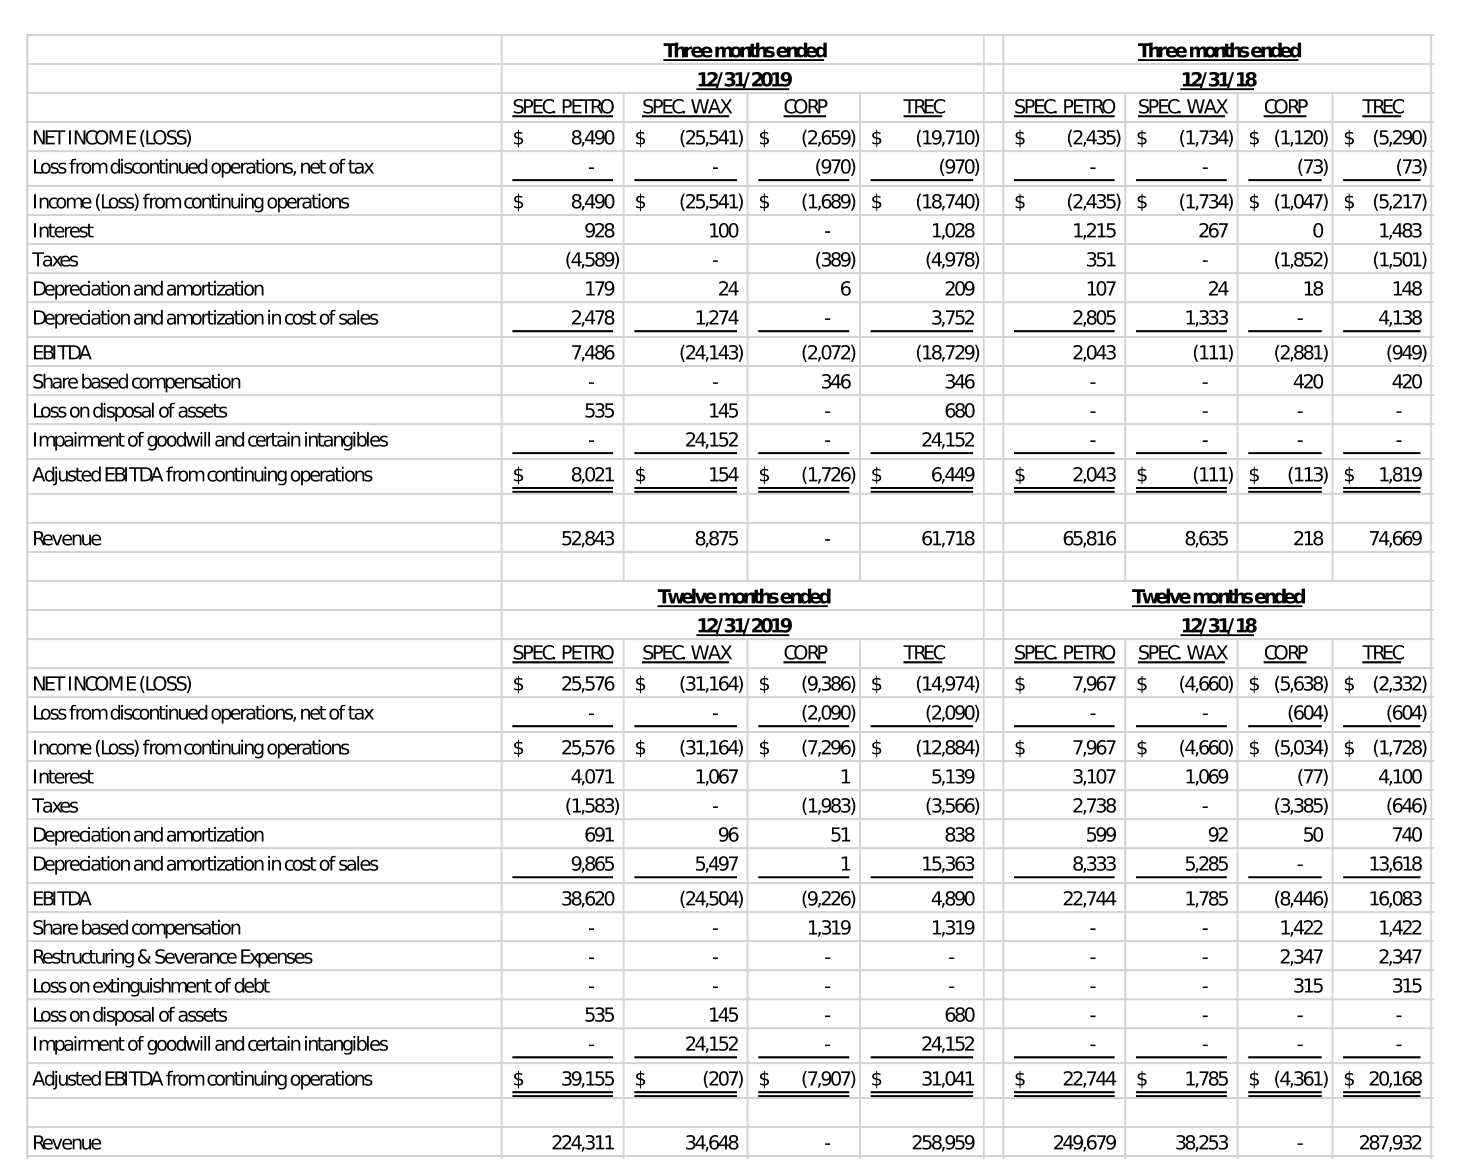
EBITDA from continuing operations and Adjusted EBITDA from continuing operations: We define EBITDA from continuing operations as net income (loss) from continuing operations plus interest expense (benefit) including derivative gains and losses, income taxes, depreciation and amortization. We define Adjusted EBITDA from continuing operations as EBITDA from continuing operations plus share–based compensation, plus restructuring and severance expenses, plus losses on extinguishment of debt, plus or minus equity in AMAK's earnings and losses, plus impairment losses, plus or minus gains or losses on disposal of assets, and plus or minus gains or losses on acquisitions.
Forward-Looking Statements
Some of the statements and information contained in this press release may constitute forward-looking statements within the meaning of the Private Securities Litigation Reform Act of 1995. Statements regarding the Company's financial position, business strategy and plans and objectives of the Company's management for future operations and other statements that are not historical facts, are forward-looking statements. Forward-looking statements are often characterized by the use of words such as "outlook," "may," "will," "should," "could," "expects," "plans," "anticipates," "contemplates," "proposes," "believes," "estimates," "predicts," "projects," "potential," "continue," "intend," or the negative of such terms and other comparable terminology, or by discussions of strategy, plans or intentions, including, but not limited to: expectations regarding future market trends; expectations regarding our future strategic focuses and 2020 financial performance, including our new growth initiative plan; and expectations regarding the consummation of the sale of our stake in AMAK and the use of proceeds therefrom, including the realization of expected benefits to the Company from the application of such proceeds.
Forward-looking statements are subject to risks, uncertainties and other factors that could cause actual results to differ materially from those expressed or implied by such statements. Such risks, uncertainties and factors include, but are not limited to: not completing, or not completely realizing the anticipated benefits from, the sale of our stake in AMAK (including the satisfaction of remaining closing conditions); general economic and financial conditions domestically and internationally; insufficient cash flows from operating activities; our ability to attract and retain key employees; feedstock, product and mineral prices; feedstock availability and our ability to access third party transportation; competition; industry cycles; natural disasters or other severe weather events, health epidemics and pandemics (including COVID-19) and terrorist attacks; our ability to consummate extraordinary transactions, including acquisitions and dispositions, and realize the financial and strategic goals of such transactions; technological developments and our ability to maintain, expand and upgrade
7
our facilities; regulatory changes; environmental matters; lawsuits; outstanding debt and other financial and legal obligations; difficulties in obtaining additional financing on favorable conditions, or at all; local business risks in foreign countries, including civil unrest and military or political conflict, local regulatory and legal environments and foreign currency fluctuations; and other risks detailed in our latest Annual Report on Form 10-K, including but not limited to: "Part I, Item 1A. Risk Factors" and "Part II, Item 7. Management's Discussion and Analysis of Financial Condition and Results of Operations" therein, and in our other filings with the Securities and Exchange Commission (the "SEC"). There may be other factors of which we are currently unaware or deem immaterial that may cause our actual results to differ materially from the forward-looking statements. In addition, to the extent any inconsistency or conflict exists between the information included in this press release and the information included in our prior releases, reports and other filings with the SEC, the information contained in this press release updates and supersedes such information. Forward-looking statements are based on current plans, estimates, assumptions and projections, and, therefore, you should not place undue reliance on them. Forward-looking statements speak only as of the date they are made, and we undertake no obligation to update them in light of new information or future events.
About Trecora Resources (TREC)
TREC owns and operates a specialty petrochemicals facility specializing in high purity hydrocarbons and other petrochemical manufacturing and a specialty wax facility, both located in Texas, and provides custom processing services at both facilities. In addition, the Company is the original developer and a 33.3% owner of AMAK, a Saudi Arabian joint stock company.
Investor Relations Contact:
Jason Finkelstein
The Piacente Group, Inc.
212-481-2050
TRECORA RESOURCES AND SUBSIDIARIES
CONSOLIDATED BALANCE SHEETS
8
9
TRECORA RESOURCES AND SUBSIDIARIES
CONSOLIDATED STATEMENTS OF INCOME
10
TRECORA RESOURCES AND SUBSIDIARIES
RECONCILIATION OF SELECTED GAAP MEASURES TO NON-GAAP MEASURES
EBITDA from continuing operations and Adjusted EBITDA from continuing operations
(thousands of dollars; rounding may apply)
11