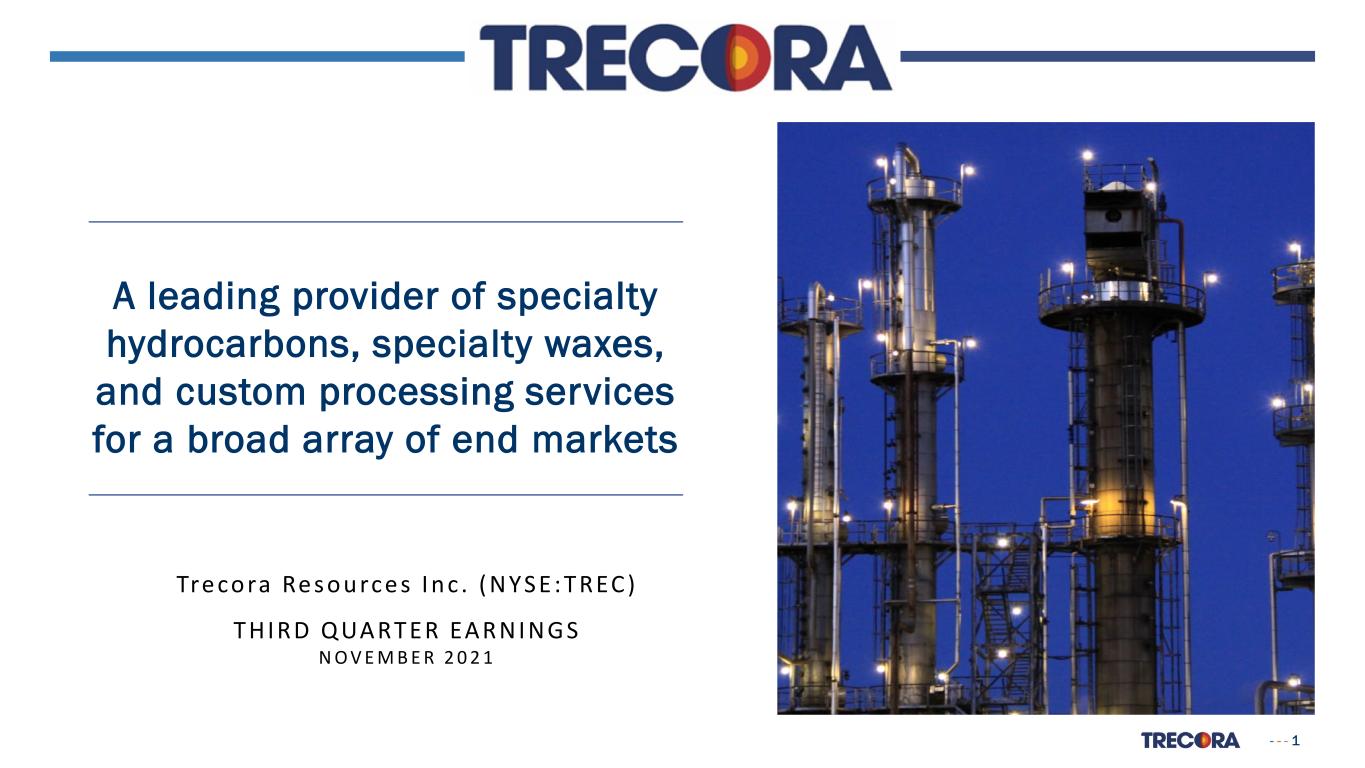
- - - 1 A leading provider of specialty hydrocarbons, specialty waxes, and custom processing services for a broad array of end markets Tre co ra Re s ou rce s I n c . (N YS E :TREC ) THI RD Q UA RTER EA RN I N G S N O V E M B E R 2 0 2 1
- - - 2 Forward Looking Statements Forward-looking statements involve known and unknown risks, uncertainties, assumptions, and other important factors that could cause the actual results, performance or our achievements, or industry results, to differ materially from historical results, any future results, or performance or achievements expressed or implied by such forward-looking statements. Such risks, uncertainties and factors include, but are not limited to the impacts of the COVID-19 pandemic on our business, financial results and financial condition and that of our customers, suppliers, and other counterparties; general economic and financial conditions domestically and internationally; insufficient cash flows from operating activities; our ability to attract and retain key employees; feedstock and product prices; feedstock availability and our ability to access third party transportation; competition; industrycycles; natural disasters or other severe weather events (such as the Texas freeze event), health epidemics and pandemics (including the COVID-19 pandemic) and terrorist attacks; our ability to consummate, and the costs associated with, extraordinary transactions, including acquisitions, dispositions and other strategic initiatives, and realize the financial and strategic goals of such transactions; technological developments and our ability to maintain, expand and upgrade our facilities; regulatory changes; environmental matters; lawsuits; outstanding debt and other financial and legal obligations (including having to return the amounts borrowed under the PPP Loans or failing to qualify for forgiveness of such loans, in whole or in part); difficulties in obtaining additional financing on favorable conditions, or at all; local business risks in foreign countries, including civil unrest and military or political conflict, local regulatory and legal environments and foreign currency fluctuations; and other risks detailed in our latest Annual Report on Form 10-K, including, but not limited to, “Part I, Item 1A. Risk Factors” and “Part II, Item 7. Management’s Discussion and Analysis of Financial Condition and Results of Operations” therein and in our other filings with the Securities and Exchange Commission (the “SEC”). Many of these risks anduncertainties are currently amplified by and will continue to be amplified by, or in the future may be amplified by, the COVID-19 pandemic and other natural disasters such as severe weather events. There may be other factors of which we are currently unaware or deem immaterial that may cause our actual results to differ materially from the forward-looking statements. In addition, to the extent any inconsistency or conflict exists between the information included in this report and the information included in our prior releases, reports and other filings with the SEC, the information contained in this report updates and supersedes such information. Forward-looking statements are based on current plans, estimates, assumptions and projections, and, therefore, you should not place undue reliance on them. Forward-looking statements speak only as of the date they are made, and we undertake no obligation to update them in light of new information or future events.
- - - 3 Non-GAAP Measures This presentation includes the non-GAAP financial measures of EBITDA from continuing operations and Adjusted EBITDA from continuing operations and provides reconciliations from our most directly comparable GAAP financial measures to those measures. We believe these financial measures provide users of our financial statements with supplemental information that may be useful in evaluating our operating performance. We also believe that such non-GAAP measures, when read in conjunction with our operating results presented under GAAP, can be used to better assess our performance from period to period and relative to performance of other companies in our industry, without regard to financing methods, historical cost basis or capital structure. These measures are not measures of financial performance or liquidity under GAAP and should be considered in addition to, and not as a substitute for, analysis of our results under GAAP. We define EBITDA from continuing operations as net income (loss) from continuing operations plus interest expense, income tax expense (benefit), and depreciation and amortization. We define Adjusted EBITDA from continuing operations as EBITDA from continuing operations net of the impact of items we do not consider indicative of our ongoing operating performance, including share-based compensation, gains or losses on disposal of assets, gains or losses on extinguishment of debt and one-time costs for professional services associated with M&A and strategic initiatives. These non-GAAP measures have been reconciled to the nearest GAAP measure for historical periods in the tables below entitled “Reconciliation of Selected GAAP Measures to Non-GAAP Measures.” However, the Company is unable to reconcile its expectations regarding Adjusted EBITDA growth in 2021 to the most directly comparable GAAP measures without unreasonable efforts because the Company is currently unable to predict with a reasonable degree of certainty the type and extent of certain items that would be expected to impact GAAP measures for these periods but would not impact the non-GAAP measures.
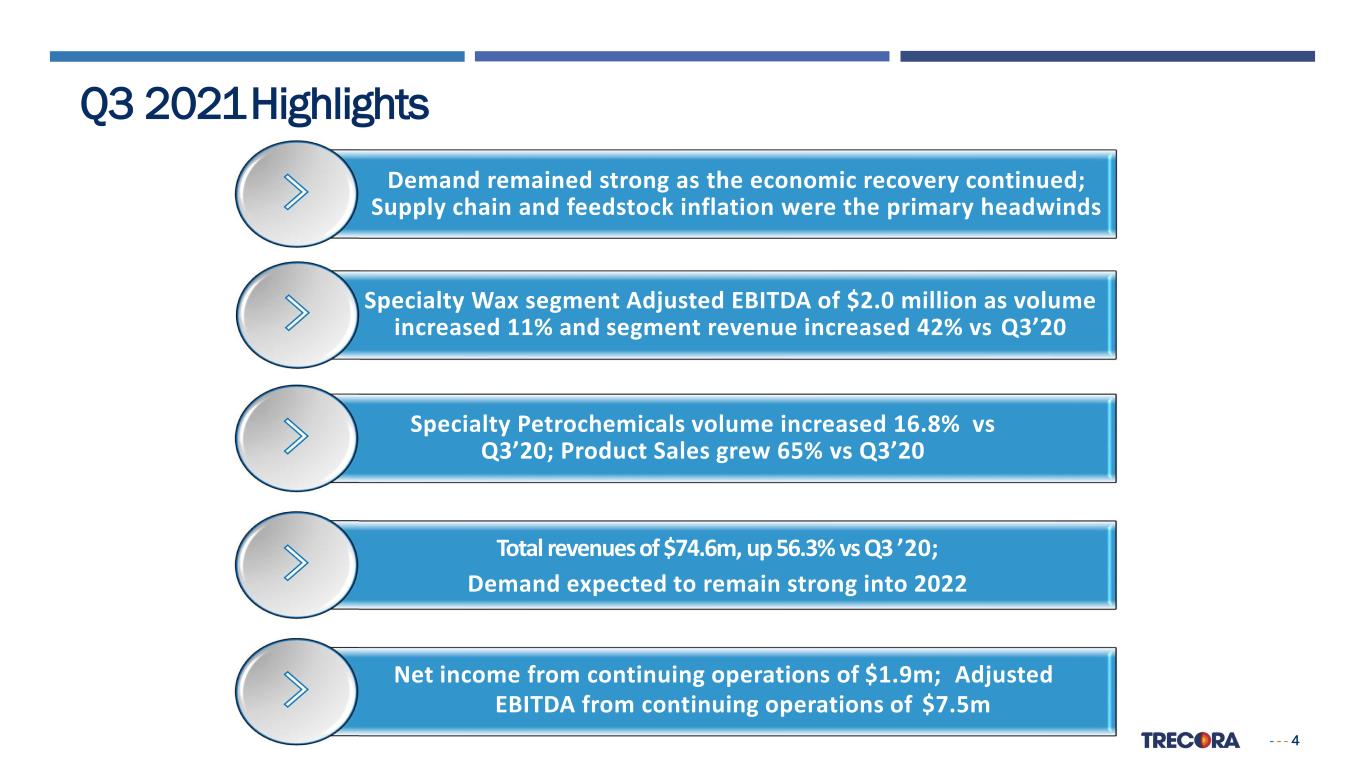
- - - 4 Q3 2021Highlights Net income from continuing operations of $1.9m; Adjusted EBITDA from continuing operations of $7.5m Total revenues of $74.6m, up 56.3% vs Q3 ’20; Demand expected to remain strong into 2022 Specialty Wax segment Adjusted EBITDA of $2.0 million as volume increased 11% and segment revenue increased 42% vs Q3’20 Demand remained strong as the economic recovery continued; Supply chain and feedstock inflation were the primary headwinds Specialty Petrochemicals volume increased 16.8% vs Q3’20; Product Sales grew 65% vs Q3’20
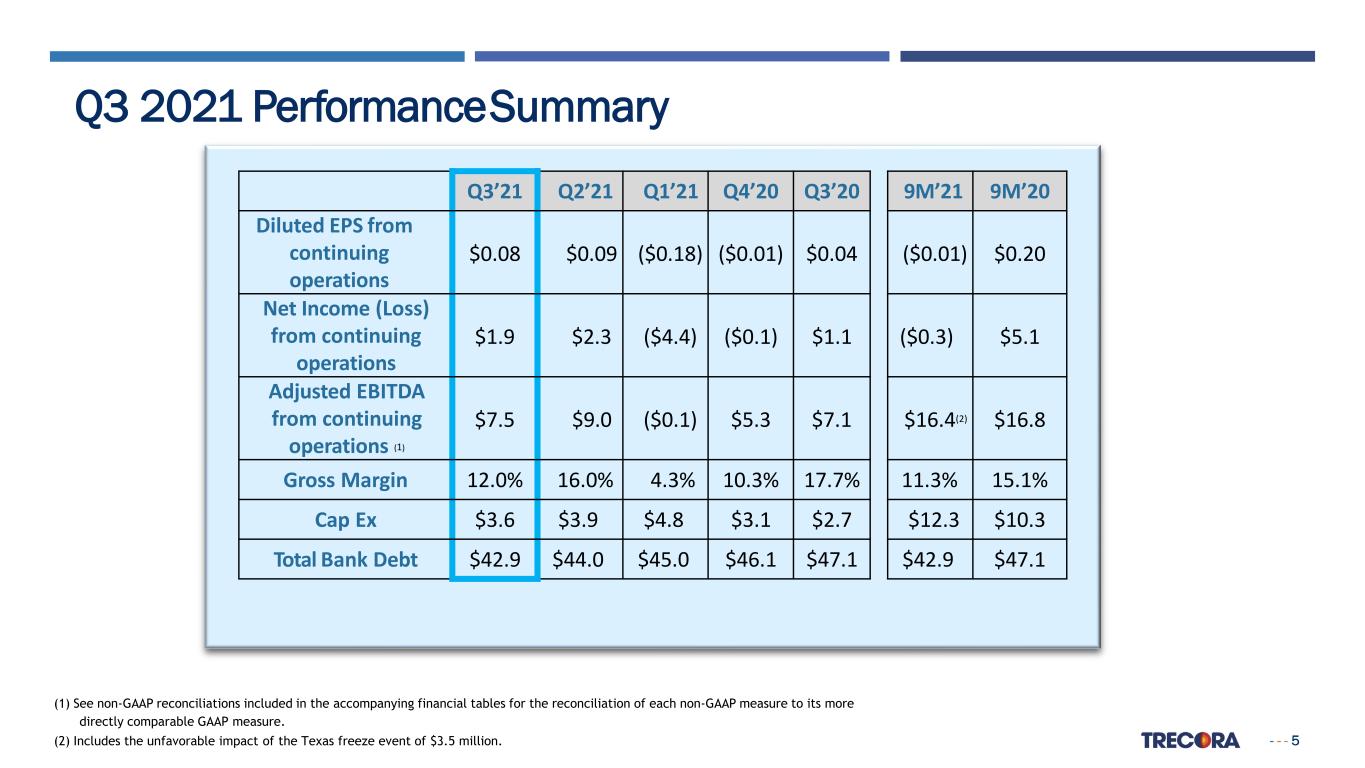
- - - 5 Q3 2021 PerformanceSummary Q3’21 Q2’21 Q1’21 Q4’20 Q3’20 Diluted EPS from continuing operations $0.08 $0.09 ($0.18) ($0.01) $0.04 Net Income (Loss) from continuing operations $1.9 $2.3 ($4.4) ($0.1) $1.1 Adjusted EBITDA from continuing operations (1) $7.5 $9.0 ($0.1) $5.3 $7.1 Gross Margin 12.0% 16.0% 4.3% 10.3% 17.7% Cap Ex $3.6 $3.9 $4.8 $3.1 $2.7 Total Bank Debt $42.9 $44.0 $45.0 $46.1 $47.1 9M’21 9M’20 ($0.01) $0.20 ($0.3) $5.1 $16.4(2) $16.8 11.3% 15.1% $12.3 $10.3 $42.9 $47.1 (1) See non-GAAP reconciliations included in the accompanying financial tables for the reconciliation of each non-GAAP measure to its more directly comparable GAAP measure. (2) Includes the unfavorable impact of the Texas freeze event of $3.5 million.
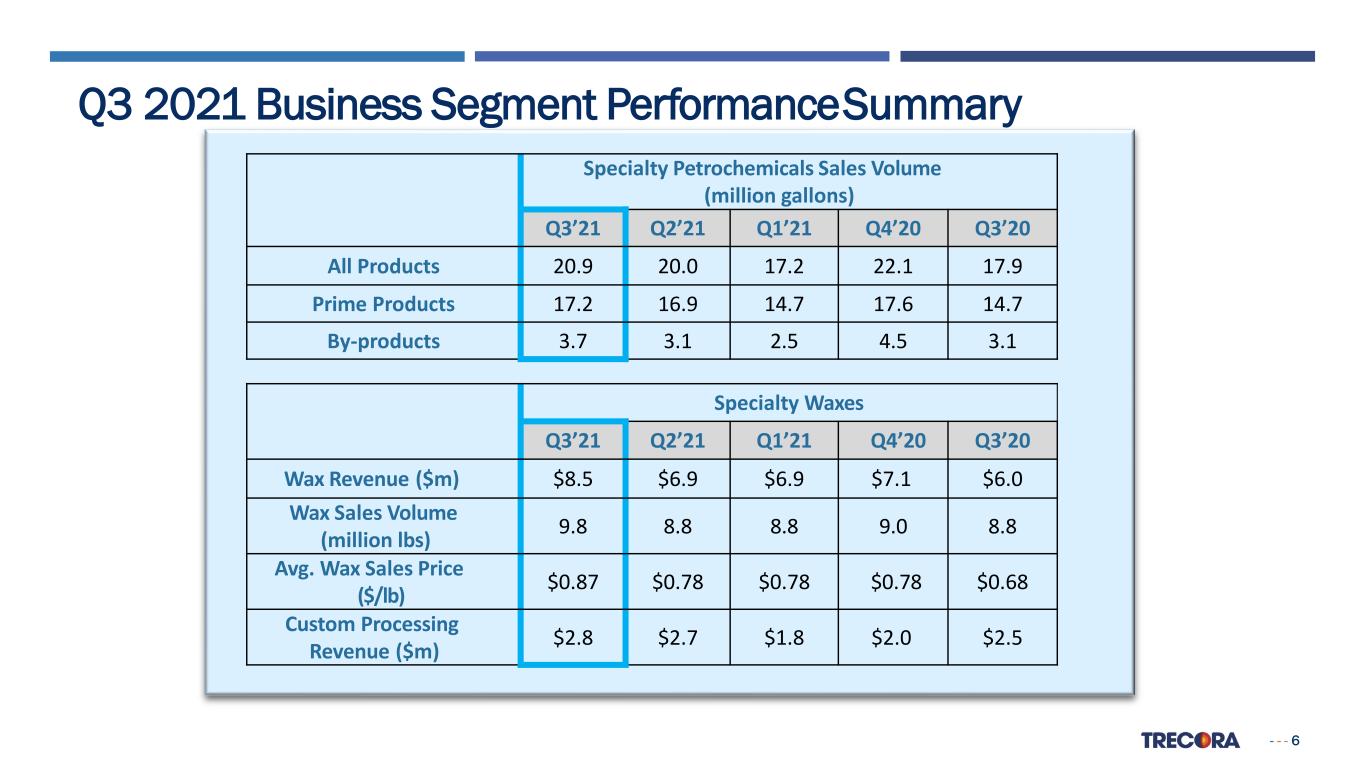
- - - 6 Q3 2021 Business Segment PerformanceSummary Specialty Petrochemicals Sales Volume (million gallons) Q3’21 Q2’21 Q1’21 Q4’20 Q3’20 All Products 20.9 20.0 17.2 22.1 17.9 Prime Products 17.2 16.9 14.7 17.6 14.7 By-products 3.7 3.1 2.5 4.5 3.1 Specialty Waxes Q3’21 Q2’21 Q1’21 Q4’20 Q3’20 Wax Revenue ($m) $8.5 $6.9 $6.9 $7.1 $6.0 Wax Sales Volume (million lbs) 9.8 8.8 8.8 9.0 8.8 Avg. Wax Sales Price ($/lb) $0.87 $0.78 $0.78 $0.78 $0.68 Custom Processing Revenue ($m) $2.8 $2.7 $1.8 $2.0 $2.5
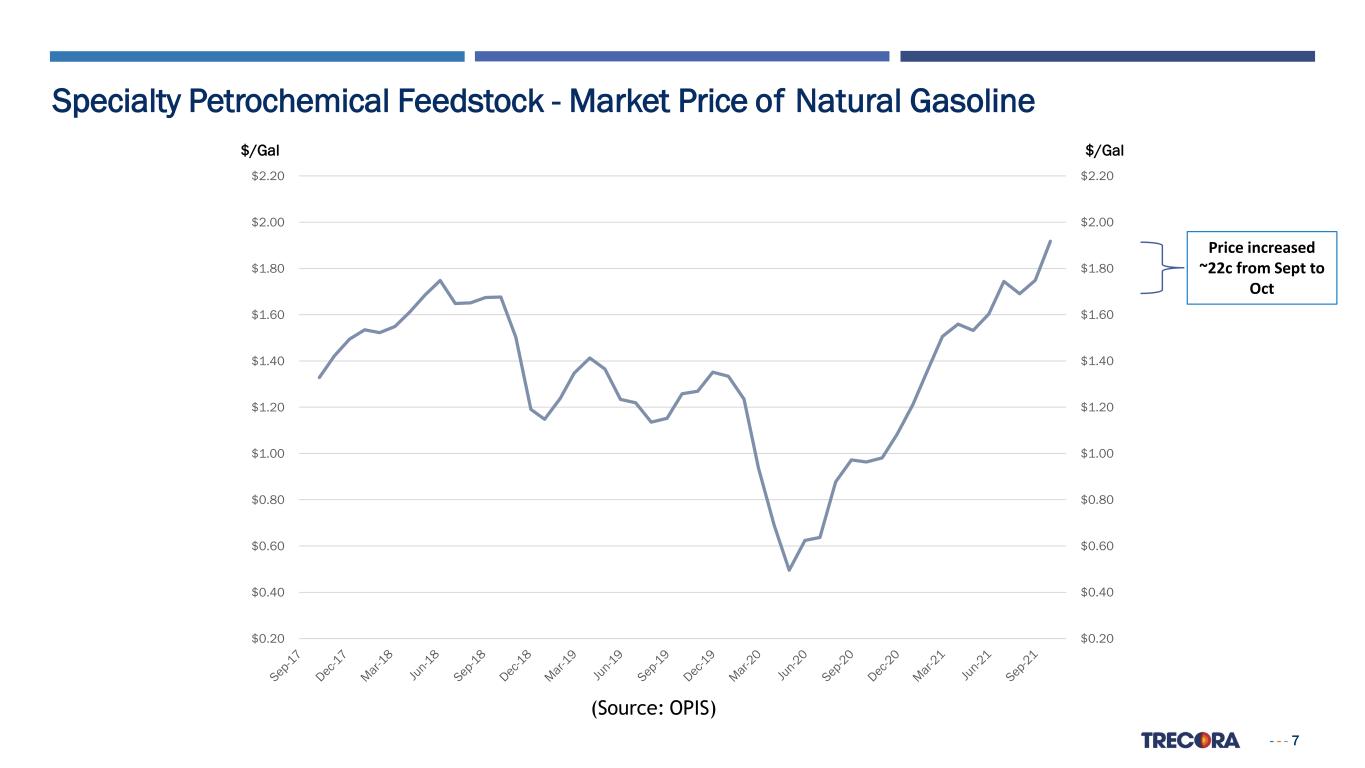
- - - 7 Specialty Petrochemical Feedstock - Market Price of Natural Gasoline (Source: OPIS) $/Gal $/Gal Price increased ~22c from Sept to Oct $0.20 $0.40 $0.60 $0.80 $1.00 $1.20 $1.40 $1.60 $1.80 $2.00 $2.20 $0.20 $0.40 $0.60 $0.80 $1.00 $1.20 $1.40 $1.60 $1.80 $2.00 $2.20
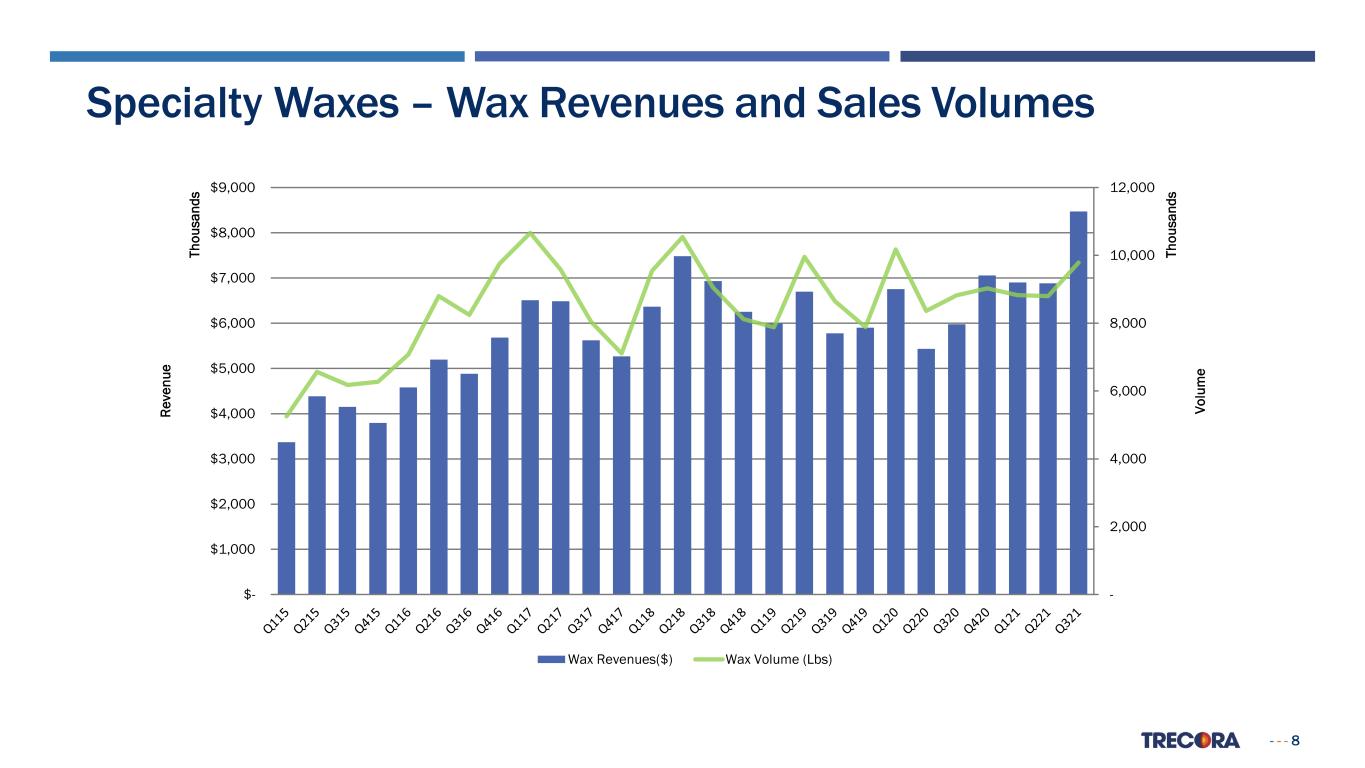
- - - 8 - 2,000 4,000 6,000 8,000 10,000 12,000 $- $1,000 $2,000 $3,000 $4,000 $5,000 $6,000 $7,000 $8,000 $9,000 Vo lu m e Th ou sa nd s Re ve nu e Th ou sa nd s Wax Revenues($) Wax Volume (Lbs) Specialty Waxes – Wax Revenues and Sales Volumes
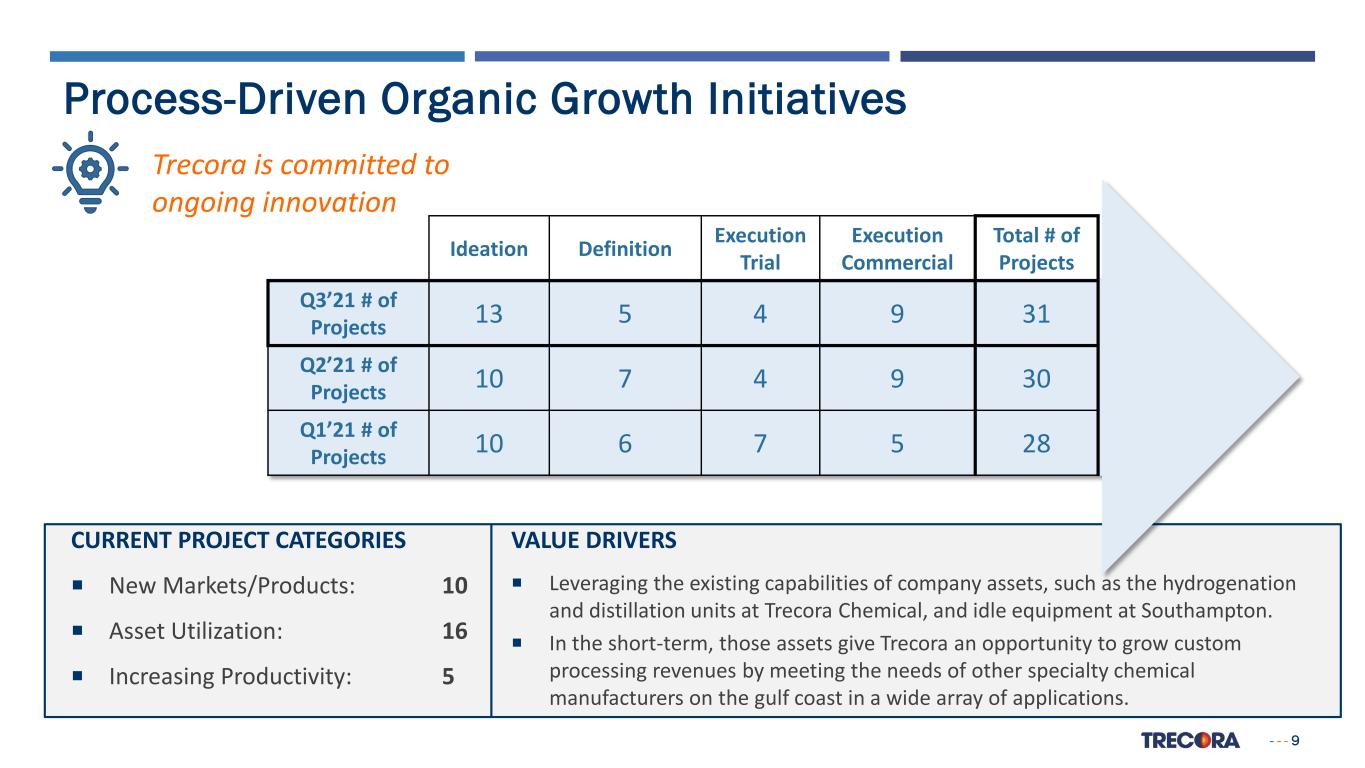
- - - 9 Process-Driven Organic Growth Initiatives Trecora is committed to ongoing innovation VALUE DRIVERS Leveraging the existing capabilities of company assets, such as the hydrogenation and distillation units at Trecora Chemical, and idle equipment at Southampton. In the short-term, those assets give Trecora an opportunity to grow custom processing revenues by meeting the needs of other specialty chemical manufacturers on the gulf coast in a wide array of applications. Ideation Definition Execution Trial Execution Commercial Total # of Projects Q3’21 # of Projects 13 5 4 9 31 Q2’21 # of Projects 10 7 4 9 30 Q1’21 # of Projects 10 6 7 5 28 CURRENT PROJECT CATEGORIES New Markets/Products: 10 Asset Utilization: 16 Increasing Productivity: 5

- - - 10 For more information, please visit our website: http://www.trecora.com
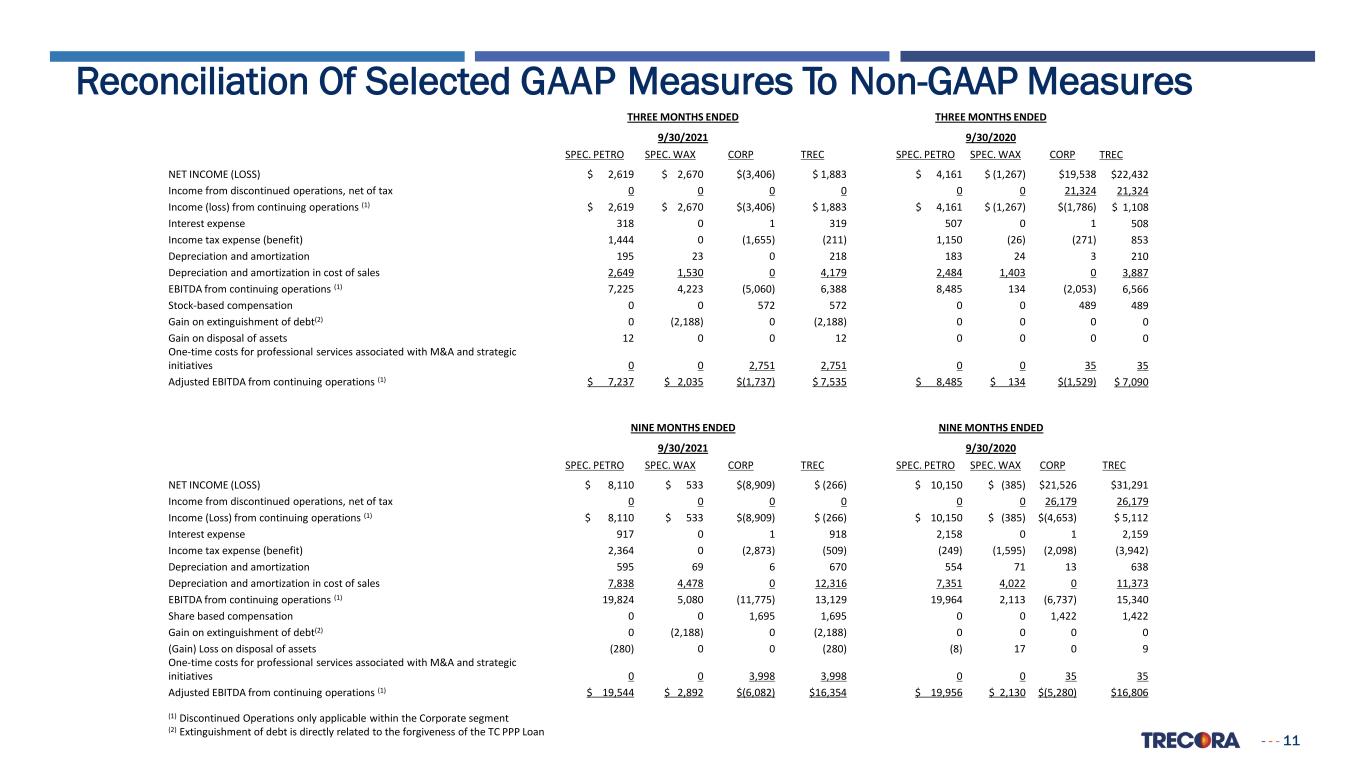
- - - 11 Reconciliation Of Selected GAAP Measures To Non-GAAP Measures THREE MONTHS ENDED THREE MONTHS ENDED 9/30/2021 9/30/2020 SPEC. PETRO SPEC. WAX CORP TREC SPEC. PETRO SPEC. WAX CORP TREC NET INCOME (LOSS) $ 2,619 $ 2,670 $(3,406) $ 1,883 $ 4,161 $ (1,267) $19,538 $22,432 Income from discontinued operations, net of tax 0 0 0 0 0 0 21,324 21,324 Income (loss) from continuing operations (1) $ 2,619 $ 2,670 $(3,406) $ 1,883 $ 4,161 $ (1,267) $(1,786) $ 1,108 Interest expense 318 0 1 319 507 0 1 508 Income tax expense (benefit) 1,444 0 (1,655) (211) 1,150 (26) (271) 853 Depreciation and amortization 195 23 0 218 183 24 3 210 Depreciation and amortization in cost of sales 2,649 1,530 0 4,179 2,484 1,403 0 3,887 EBITDA from continuing operations (1) 7,225 4,223 (5,060) 6,388 8,485 134 (2,053) 6,566 Stock-based compensation 0 0 572 572 0 0 489 489 Gain on extinguishment of debt(2) 0 (2,188) 0 (2,188) 0 0 0 0 Gain on disposal of assets 12 0 0 12 0 0 0 0 One-time costs for professional services associated with M&A and strategic initiatives 0 0 2,751 2,751 0 0 35 35 Adjusted EBITDA from continuing operations (1) $ 7,237 $ 2,035 $(1,737) $ 7,535 $ 8,485 $ 134 $(1,529) $ 7,090 NINE MONTHS ENDED NINE MONTHS ENDED 9/30/2021 9/30/2020 SPEC. PETRO SPEC. WAX CORP TREC SPEC. PETRO SPEC. WAX CORP TREC NET INCOME (LOSS) $ 8,110 $ 533 $(8,909) $ (266) $ 10,150 $ (385) $21,526 $31,291 Income from discontinued operations, net of tax 0 0 0 0 0 0 26,179 26,179 Income (Loss) from continuing operations (1) $ 8,110 $ 533 $(8,909) $ (266) $ 10,150 $ (385) $(4,653) $ 5,112 Interest expense 917 0 1 918 2,158 0 1 2,159 Income tax expense (benefit) 2,364 0 (2,873) (509) (249) (1,595) (2,098) (3,942) Depreciation and amortization 595 69 6 670 554 71 13 638 Depreciation and amortization in cost of sales 7,838 4,478 0 12,316 7,351 4,022 0 11,373 EBITDA from continuing operations (1) 19,824 5,080 (11,775) 13,129 19,964 2,113 (6,737) 15,340 Share based compensation 0 0 1,695 1,695 0 0 1,422 1,422 Gain on extinguishment of debt(2) 0 (2,188) 0 (2,188) 0 0 0 0 (Gain) Loss on disposal of assets (280) 0 0 (280) (8) 17 0 9 One-time costs for professional services associated with M&A and strategic initiatives 0 0 3,998 3,998 0 0 35 35 Adjusted EBITDA from continuing operations (1) $ 19,544 $ 2,892 $(6,082) $16,354 $ 19,956 $ 2,130 $(5,280) $16,806 (1) Discontinued Operations only applicable within the Corporate segment (2) Extinguishment of debt is directly related to the forgiveness of the TC PPP Loan