
Exhibit 99.2
Click to edit Master title style TREC Your Specialty Chemical Partner Fourth Quarter and Full Year 2016 Financial Results March 1, 2017

2 Safe Harbor Statements in this presentation that are not historical facts are forward looking statements as defined in the Private Securities Litigation Reform Act of 1995 . Forward looking statements are based upon Management's belief, as well as, assumptions made by and information currently available to Management . Because such statements are based upon expectations as to future economic performance and are not statements of fact, actual results may differ from those projected . These risks, as well as others, are discussed in greater detail in Trecora Resources' filings with the Securities and Exchange Commission, including Trecora Resources' Annual Report on Form 10 - K for the year ended December 31 , 2015 , and the Company‘s subsequent Quarterly Reports on Form 10 - Q .

3 Agenda » Fourth Quarter and Full Year Overview » Financial & Operational Highlights » Financial Statement Review » SHR Update » TC Update » AMAK Update » Closing Remarks

4 Fourth Quarter and Full Year Overview » Continued strong investment in transformational capital projects » Building a foundation for increased capacity to drive future growth » Delivered strong annual revenue growth at Trecora Chemical » Acquisition of B Plant increased capabilities » Distillation Unit is mechanically complete. Hydrogenation testing to begin in April » Completed extensive renovation work at AMAK » R estarted processing operations in December » Hired new, experienced CFO » A few customer - specific volume shortfalls at SHR impacted volumes throughout the year

5 Financial Overview – 4 th Quarter 2016 » Fourth quarter results exhibited historical seasonality » Revenue was $54.2 million as compared to $60.5 million in the fourth quarter of 2015 » Volumes at South Hampton Resources continued to be affected by shortfalls from four customers » Feedstock cost increased » Trecora Chemical achieved near record wax sales and quarterly total revenue » Diluted EPS was ($0.03) includes equity in AMAK losses with an estimated after tax impact of ($0.10) per share » Adjusted EBITDA was $5.7 million as compared to $8.6 million fourth quarter of 2015

6 Petrochemical Revenue & Volume Summary - 5 10 15 20 25 30 $- $10 $20 $30 $40 $50 $60 $70 $80 4Q13 1Q14 2Q14 3Q14 4Q14 1Q15 2Q15 3Q15 4Q15 1Q16 2Q16 3Q16 4Q16 Gallons Revenue Petrochemical Sales Revenue and Volume (in millions) Byproducts Prime Revenue

7 Petrochemical Feed Cost Summary

8 Trecora Chemical: Strong and Steady Growth in Wax Volumes and Revenues Revenue Volume

9 TREC Income Statement (in thousands) 2016 2015 2016 2015 Revenue 54,203$ 60,545$ 212,399$ 241,976$ COGS 46,551 49,288 172,497 184,967 COGS% 86% 81% 81% 76% Gross Profit 7,652 11,257 39,902 57,009 GM% 14.1% 18.6% 18.8% 23.6% G&A 4,909 5,357 20,434 20,243 Depreciation and amortization 205 146 761 725 Total operating expenses 5,114 5,503 21,195 20,968 Operating Income 2,538 5,754 18,707 36,041 Op Inc% 5% 10% 9% 15% Interest expense (182) (499) (1,985) (2,217) Bargain purchase gain - - 11,549 - Equity in earnings/(losses) AMAK (3,740) (2,961) (1,479) (5,325) Gain from additional equity issuance by AMAK - - 3,168 - Misc income (expense) (66) (143) (28) (137) Income before income taxes (1,450) 2,151 29,932 28,362 Income tax expense (603) 1,029 10,504 9,764 Net Income (847)$ 1,122$ 19,428$ 18,598$ December 31, THREE MONTHS ENDED TWELVE MONTHS ENDED December 31, (unaudited) (unaudited)
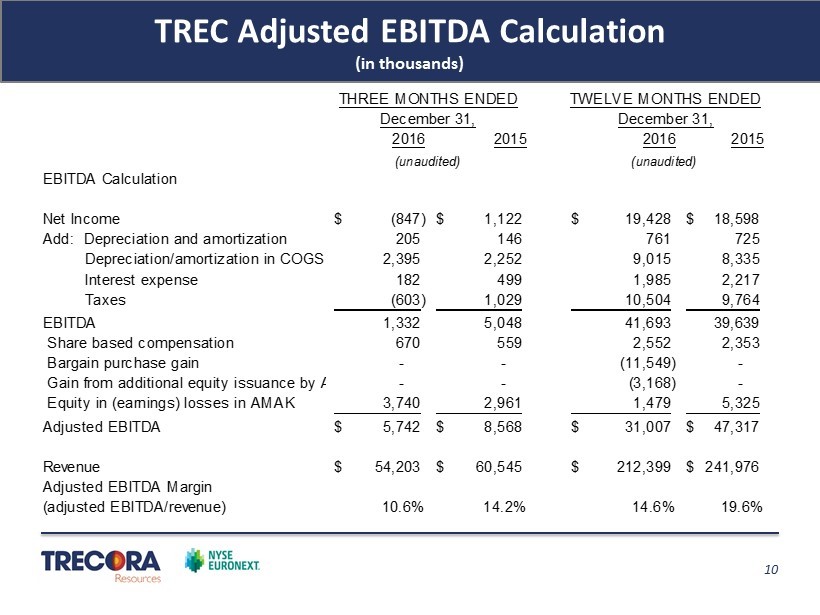
10 TREC Adjusted EBITDA Calculation (in thousands) 2016 2015 2016 2015 EBITDA Calculation Net Income (847)$ 1,122$ 19,428$ 18,598$ Add: Depreciation and amortization 205 146 761 725 Depreciation/amortization in COGS 2,395 2,252 9,015 8,335 Interest expense 182 499 1,985 2,217 Taxes (603) 1,029 10,504 9,764 EBITDA 1,332 5,048 41,693 39,639 Share based compensation 670 559 2,552 2,353 Bargain purchase gain - - (11,549) - Gain from additional equity issuance by AMAK - - (3,168) - Equity in (earnings) losses in AMAK 3,740 2,961 1,479 5,325 Adjusted EBITDA 5,742$ 8,568$ 31,007$ 47,317$ Revenue 54,203$ 60,545$ 212,399$ 241,976$ Adjusted EBITDA Margin (adjusted EBITDA/revenue) 10.6% 14.2% 14.6% 19.6% December 31, THREE MONTHS ENDED TWELVE MONTHS ENDED December 31, (unaudited) (unaudited)

11 4th Quarter 2016 Profitability Dynamics » Prime product sales volume decreased 17.0% year - over - year and 8.8% sequentially » Prime product volume excluding Canadian oil sands down 4.4% year - over - year » Sales volume for 4Q15 was historic high, making tough Y/Y comparisons » 2016 prime product volumes at similar levels to last five year average » Feedstock cost per gallon increased 8.5% year - over - year and 5.1% sequentially » Byproduct volume declined 45% and prices moved closer to feedstock cost sequentially, while prices remain below feedstock costs during 4Q16 » Near all - time record sales at Trecora Chemical

12 TREC Balance Sheet as of December 31, 2016 (unaudited) Assets Liabilities Cash & Equivalents 8,389$ A/P 13,306$ A/R 22,193 Derivative Instruments 58 Inventories 17,871 Accrued Liabilities 2,017 Deferred Income Taxes 1,615 CP-LTD 10,145 Other 7,494 Other 1,186 Current Assets 57,562$ Current Liabilities 26,712$ PPE, net 140,009 LTD 73,107 Investment in AMAK 49,386 Deferred Income Taxes 24,698 Goodwill and Intangibles 44,467 Other 3,206 Other long-term assets 675 Owners' Equity 164,376 Total Assets 292,099$ Total Liabilities and OE 292,099$ Cap table at 12/31/16 Shares outstanding 24,507 Exercisable Options (WAEP $7.53) 856 Total 25,363 (in thousands)

13 SHR 4 th Quarter and Year 2016 Petrochemical Update • Quarterly prime product volume decreased 17.2%; Yearly prime product volume decreased 8.8% • Quarterly prime product volume excluding Canadian oil sands down 4.4%; Yearly prime product volume excluding Canadian oil sands down 4.0% • The year - over - year prime product volume drop explained by volume shortfalls at four specific customers • Second Canadian oil sands customer expected to start in early 2018 0.0% 10.0% 20.0% 30.0% 2009 2010 2011 2012 2013 2014 2015 2016 International % of petrochemical volume sold 4Q16 4Q15 Y16 Y15 All Products 18.4 24.6 76.4 86.9 Prime Products 14.5 17.4 58.5 64.1 Byproducts 3.9 7.2 17.9 22.8 Deferred Sales 1.5 2.1 1.5 2.1 (million gallons) Petrochemical Sales Volumes

14 SHR Major Improvement Projects » A and C Trains inspected and refurbished » D Train capacity allowed us to do this » A Train used for multiple new product trials/production » New Products » Initial two railcar orders for one product received in late September – shipping more material in March » Customer is trialing second product » Continued work on economically producing the third product » Fourth product is entering lab trial phase » SHR Advanced Reformer » $52 million; on schedule for start up in 4Q17 » 13% cost over - run caused primarily by scale down from conventional 40,000 bpd plant » Convert ~30 - 40 million gallons/year of byproducts sold at cost/loss to higher value aromatics; technology proven in trial at SHR » Add ~$12 - $14 M/year in EBITDA; 2018 - 2022

15 SHR Advanced Reformer Project

16 Trecora Chemical Progress » Quarterly Revenue – up 49.4% year over year » Wax Markets » Hot Melt Adhesives – new FT substitute gaining traction in LATAM, EU and the US » PVC Lubricants – good progress; first order for molten product received » European Distributor – sales up 1.4 million pounds for full year 2016 versus 2015 » Custom Processing » Increased volumes with existing customers; revenue per hour up significantly for all projects in 2016 compared to 2015 » Fifteen proposals resulting in four trials and one new contract during the quarter » B Plant revenues approximately $562,000 in 4Q; expect $4 - $6 M/year in EBITDA 2017 - 2018 » TC Hydrogenation/Distillation Unit » $21 million; on schedule for production to initiate in April 2017 » 5% cost overrun and slight delay caused primarily by construction in congested, fully - operational plant » Doubles potential custom processing revenue » Add ~$ 6 - $8 M/year in EBITDA; 2017 - 2018

17 TC Hydrogenation/Distillation Project Nine months ago Now

18 AMAK Mine Developments » Fourth quarter results impacted by : » No doré or concentrate sales » Ramp - up in people and some expense for plant refurbishment » Copper and zinc mill restarted in mid - December 2016 » Throughput rates expected to increase through 2Q17 » Processing historic gold dumps at Guyan completed - gold extraction in process » Extensive underground diamond drilling program commenced » Exploration on new leases » Diamond drilling at 10km 2 Guyan gold mining license completed ▪ Concept study (including mining options) scheduled for 2Q17 » Geological mapping at Guyan exploration license completed - new prospects identified » Results for Qatan being evaluated and report to be issued in 2Q17

19 Capital Project EBITDA Estimates Project potential EBITDA and approximate time frame Total Potential Incremental Annual EBITDA Estimate: $28 million - $36 million; 2018 – 2022

20 Closing Remarks » 2016 was focused on building a foundation for future growth » Capital projects continued to make progress » 2017 should demonstrate improvement and progress of transformational capital projects » Volume growth anticipated in 2H17 » Wax volumes showing steady growth » Distillation/hydrogenation unit on track – hydrogenation testing to start in April » Advanced Reformer unit progressing – will increase byproduct value » New PE plant start up in 2H17 » AMAK Mine operations underway – significant exploration in progress » 2018 offers several catalysts to deliver incremental EBITDA growth and expanded opportunities » Second Canadian oil sands customer expected to start in early 2018 » Strong interest in custom processing capability – expanded opportunities will ramp - up with new facility » Opportunity for monetization of investment in AMAK Mine

21 Q&A Thank You Please visit our websites: www.trecora.com www.southhamptonr.com www.TrecChem.com www.amak.com.sa

22 Appendix RECONCILIATION OF SELECTED GAAP MEASURES TO NON - GAAP MEASURES (1) (1) This presentation includes non - GAAP measures. Our non - GAAP measures are not meant to be considered in isolation or as a sub stitute for comparable GAAP measures and should be read only in conjunction with our consolidated financial statements prepared in accord anc e with GAAP. 12/31/16 (in thousands except ratio) Current assets 57,562$ Current liabilities 26,712 Working capital 30,850$ (current assets less current liabilities) Current ratio 2.2 (current assets divided by current liabilities) 12/31/201612/31/201512/31/201612/31/2015 NET INCOME $ (847) $1,122 $19,429 $18,598 Bargain purchase gain $0 $0 $11,549 $0 Equity in earnings (losses) of AMAK/Gain on equity issue (3,740) ($2,961) $1,689 ($5,325) Taxes at statutory rate of 35% ($1,309) ($1,036) $4,633 ($1,864) Tax effected equity in AMAK and bargain purchase gain ($2,431) ($1,925) $8,605 ($3,461) Diluted weighted average number of shares 25,039 25,203 24,982 25,181 Estimated effect on diluted EPS ($0.10) ($0.08) $0.34 ($0.14) Three months ended Year ended