ANNUAL REPORT PURSUANT TO SECTION 13 OR 15(d) OF THE SECURITIES EXCHANGE ACT OF 1934 |
TRANSITION REPORT PURSUANT TO SECTION 13 OR 15(d) OF THE SECURITIES EXCHANGE ACT OF 1934 |
(State or other jurisdiction of incorporation or organization) |
(I.R.S. Employer Identification No.) | |
(Address of principal executive offices) |
(Zip code) |
Title of each class |
Trading Symbol(s) |
Name of each exchange on which registered | ||
Large accelerated filer | ☐ | ☒ | ||||
Non-accelerated filer | ☐ | Smaller reporting company | ||||
Emerging growth company |
Auditor Name: |
Auditor Location: |
PCAOB ID#: |
3 | ||||||
4 | ||||||
5 | ||||||
ITEM 10. |
DIRECTORS, EXECUTIVE OFFICERS AND CORPORATE GOVERNANCE | 5 | ||||
ITEM 11. |
EXECUTIVE COMPENSATION | 9 | ||||
ITEM 12. |
SECURITY OWNERSHIP OF CERTAIN BENEFICIAL OWNERS AND MANAGEMENT AND RELATED STOCKHOLDER MATTERS | 36 | ||||
ITEM 13. |
CERTAIN RELATIONSHIPS AND RELATED TRANSACTIONS, AND DIRECTOR INDEPENDENCE | 39 | ||||
ITEM 14. |
PRINCIPAL ACCOUNTING FEES AND SERVICES | 40 | ||||
ITEM 15. |
EXHIBITS, FINANCIAL STATEMENT SCHEDULES | 42 | ||||
Name; Current Positions Held & Other Public Company Boards |
Age |
Director Since | ||
Gary K. Adams Director, Chair of Compensation Committee and Member of Nominating and Governance Committee Boards: |
71 | 2012 | ||
Pamela R. Butcher Director, Chair of Nominating and Governance Committee and Member of Compensation Committee Boards: |
64 | 2016 | ||
Nicholas N. Carter Director |
75 | 2004 | ||
Adam C. Peakes Director, Chair of Audit Committee and Member of Compensation Committee Boards: |
49 | 2019 | ||
Patrick D. Quarles President, Chief Executive Officer and Director |
55 | 2018 | ||
Janet S. Roemer Director, Member of Audit and Nominating and Governance Committees |
66 | 2019 | ||
Karen A. Twitchell Director, Chair of the Board, Member of Audit and Compensation Committees |
66 | 2015 |
Experience, Expertise or Attribute |
Adams |
Butcher |
Carter |
Peakes |
Quarles |
Roemer |
Twitchell | |||||||
Strategic Executive Leadership |
✓ | ✓ | ✓ | ✓ | ✓ | ✓ | ✓ | |||||||
Global Business Acumen |
✓ | ✓ | ✓ | ✓ | ✓ | ✓ | ✓ | |||||||
Chemical Operations Expertise |
✓ | ✓ | ✓ | ✓ | ✓ | |||||||||
Chemical Commercial Expertise |
✓ | ✓ | ✓ | ✓ | ✓ | |||||||||
Corporate Finance / Capital Structure Expertise |
✓ | ✓ | ✓ | ✓ | ||||||||||
Financial Expertise / Literacy |
✓ | ✓ | ✓ | ✓ | ✓ | ✓ | ✓ | |||||||
Business Transformation |
✓ | ✓ | ✓ | ✓ | ✓ | ✓ | ||||||||
Investments/Fund Management/Investor Relations |
✓ | ✓ | ✓ | ✓ | ✓ | |||||||||
Risk & Compliance Management Expertise |
✓ | ✓ | ✓ | ✓ | ||||||||||
Corporate Governance Expertise |
✓ | ✓ | ✓ | ✓ | ✓ | ✓ | ✓ |
Name of Executive |
Positions |
Age |
Appointed | |||
Patrick D. Quarles |
President, Chief Executive Officer and Director |
55 |
2018 | |||
S. Sami Ahmad |
Chief Financial Officer and Treasurer |
60 |
2016 | |||
Peter M. Loggenberg |
Chief Commercial and Sustainability Officer |
59 |
2018/2014 | |||
Rafael Pons |
Chief Manufacturing Officer |
58 |
2021 | |||
Michael W. Silberman |
General Counsel and Corporate Secretary |
51 |
2020 |
Name |
Position | |
Patrick D. Quarles |
President and Chief Executive Officer | |
S. Sami Ahmad |
Chief Financial Officer and Treasurer | |
Peter M. Loggenberg |
Chief Commercial and Sustainability Officer | |
Rafael F. Pons (1) |
Chief Manufacturing Officer | |
Michael W. Silberman |
General Counsel and Corporate Secretary |
(1) |
Mr. Pons was promoted to Chief Manufacturing Officer and became an executive officer effective May 15, 2021. |
• |
Full year revenue of $272.7 million, an increase of 30.7% compared with the prior year, driven by price and volume increases in the Specialty Petrochemicals segment while Specialty Wax segment revenue growth benefitted from higher selling prices. |
• |
Net income from continuing operations of $5.0 million. |
• |
Adjusted EBITDA (1) from continuing operations of $21.6 million. |
• |
Successfully converted five growth projects into new custom processing commitments with our customers. |
• |
Invested in the expansion of our owned truck fleet for delivery to our prime products customers and maintained high customer service levels despite a challenging supply chain. |
• |
Further simplified and streamlined our corporate structure through the sale of all remaining mining assets owned at PEVM. |
(1) |
Adjusted EBITDA from continuing operations is a non-GAAP financial measure. See “Non-GAAP Financial Measures” in Part II, Item 7. Management’s Discussion and Analysis of Financial Condition and Results of Operations in the Original Filing for a description of this non-GAAP measure and reconciliation to the most directly comparable GAAP financial measure. |
• |
Pay-for-Performance |
• | Annual Cash Incentive Plan Linked to Financial Performance and Sustainability Targets: |
• | Long-Term Incentive Plan Grants Included Performance-Based RSUs: |
• | Competitive Pay Practices: |
• | Compensation Risk Assessment: |
• | Independent Compensation Consultant: |
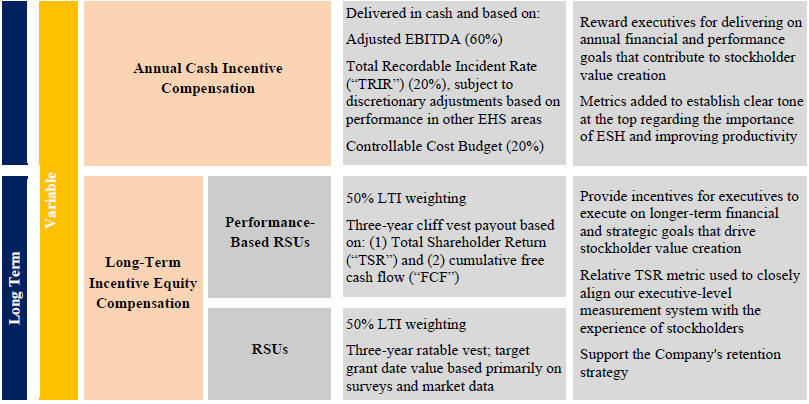
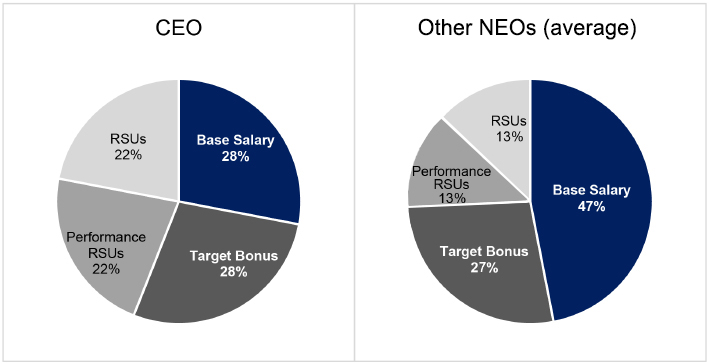
• | Base Salary: |
• | Annual Cash Incentive: |
• | Long-Term Incentive: |
What We Do |
What We Don’t Do | |
✓ Pay for Performance: |
x Tax Gross-up Provisions for a Change-in-Control: gross-up payments for excise and other taxes that could become payable as a result of payments made in connection with a change in control. | |
✓ Comprehensive Clawback Policy: |
x Excessive Perquisites: | |
✓ Stock Ownership Guidelines: |
x Pledging or Hedging: |
✓ FormulaicFramework: pre-established performance targets. |
x Repricing of Option Awards: | |
✓ BalancedPerformance Metrics: |
x Single-Trigger Accelerated Vesting: | |
✓ RigorousGoal Setting: |
x Evergreen Features: |
• | Pay for performance: |
• | Stockholder alignment |
• | Competitiveness: |
• | Good governance: |
• | We compare our NEOs to comparable positions within the market in terms of specific duties, responsibilities, and job scope. |
• | Each position has an established target annual incentive award opportunity, executive benefits and perquisites. These incentive levels and benefits are reviewed by the Compensation Committee on an annual basis to determine their relative level of competitiveness with the market. |
• | We generally target all elements of pay and total direct compensation to be positioned near the 50 th percentile of our peer group based on several factors, including the relative size of the Company compared with some of its peers. |
• | Individual executive pay positioning will vary based on the requirements of the job (competencies and skills), the executive’s experience and performance, and the organizational structure (internal alignment and pay relationships). |
• | We also consider internal pay equity when establishing compensation levels. Currently, we believe that our compensation level for each of our NEOs reflects his or her job responsibility and scope appropriately and scale down from the CEO in a reasonable manner. |
• | Exceptions to normal practice may be made based on critical business and people needs. |
• | The Compensation Committee reviews and approves business goals and objectives relevant to executive compensation, evaluates the performance of the CEO in light of these goals and objectives, and determines and establishes the CEO’s compensation level. |
• | Based on review of market data, individual performance and internal pay comparisons, the Compensation Committee independently sets the pay for our CEO and reviews and approves all NEO and other executive pay arrangements. |
• | The CEO makes recommendations on program design and pay levels other than his own, where appropriate, and oversees the implementation of such programs and directives approved by the Compensation Committee. |
• | The CEO develops pay recommendations for his direct reports and other key executives based on the results of the analysis of current market compensation levels by Pearl Meyer. This includes all of our NEOs (with the exception of the CEO himself). |
• | Our CFO provides the financial information used by the Compensation Committee to make decisions with respect to incentive compensation goals and related payouts. |
• | Pearl Meyer’s primary role is to provide advice and perspective regarding market compensation trends that may impact decisions we make about our executive compensation program and practices. |
• | The compensation consultant is responsible for gathering, analyzing and presenting peer group pay practices and relevant data to the Compensation Committee. They do not have the authority to determine pay. |
• | The consultant provides periodic updates to the Compensation Committee regarding various tax, accounting and regulatory issues that could have an impact on executive compensation design, administration and/or disclosure. |
• | The compensation consultant provides risk assessment of our executive compensation programs and practices. |
Compensation Peer Group | ||||
American Vanguard Corp. | Flotek Industries, Inc. | Intrepid Potash, Inc. | ||
Balchem Corporation | FutureFuel Corp. | Kraton Corporation | ||
Chase Corporation | Hawkins Inc. | LSB Industries, Inc. | ||
Core Molding Technologies, Inc. | Innospec Inc | Stepan Company |
• | limits on annual cash incentive and long-term performance awards, thereby defining and capping potential payouts; |
• | application of annual incentive metrics that align employees with the common goal of increasing Adjusted EBITDA, improving our EHS performance and our productivity; |
• | use of an LTI vehicle that vests over a number of years, thereby providing strong incentives for sustained operational and financial performance; |
• | Compensation Committee discretion to adjust payouts under the annual incentive plan to reflect the core operating performance of the company but prohibits discretion for payouts above stated maximum awards; |
• | |
• | |
Name of Executive |
2021 Base Salary |
Target Annual Cash Incentive |
Target Long-Term Incentive Equity Compensation (2) |
Target Total Direct Compensation |
||||||||||||
Patrick D. Quarles |
$ | 591,000 | $ | 591,000 | $ | 916,050 | $ | 2,098,050 | ||||||||
S. Sami Ahmad |
$ | 311,257 | $ | 186,754 | $ | 186,754 | $ | 684,765 | ||||||||
Peter M. Loggenberg |
$ | 323,420 | $ | 194,052 | $ | 177,881 | $ | 695,353 | ||||||||
Rafael F. Pons (1) |
$ | 300,000 | $ | 165,000 | $ | 165,000 | $ | 630,000 | ||||||||
Michael W. Silberman |
$ | 325,000 | $ | 178,750 | $ | 178,750 | $ | 682,500 |
(1) |
The target compensation amounts for Mr. Pons reflect his increased base salary and target annual and long-term incentive compensation following his promotion to Chief Manufacturing Officer effective May 15, 2021. Mr. Pons actual compensation for 2021 reflects pro ration between his base salary and target incentive compensation levels for the periods before and after his promotion. See the information regarding Mr. Pons compensation under “Employment and Change in Control Arrangements” and our “2021 Summary Compensation Table” for additional information. |
(2) |
The compensation amount represents the value of the award on the grant date disregarding any estimates for forfeitures of RSUs granted to the NEOs in the first quarter of 2021 with half vesting over three years and the remainder upon the achievement of certain performance metrics. The compensation does not correspond to the actual value that will be realized by the NEOs. |
Name of Executive |
Base Salary 2021 |
% Change from 2020 (pre-COVID Reductions) |
Base Salary 2022 |
% Change from 2021 |
||||||||||||
Patrick D. Quarles |
$ | 591,000 | (1.5 | )% | $ | 620,550 | 5.0 | % | ||||||||
S. Sami Ahmad |
311,257 | (1.4 | )% | 326,820 | 5.0 | % | ||||||||||
Peter M. Loggenberg |
323,420 | (1.5 | )% | 339,591 | 5.0 | % | ||||||||||
Rafael F. Pons (1) |
300,000 | — | 315,000 | 5.0 | % | |||||||||||
Michael W. Silberman |
325,000 | — | 341,250 | 5.0 | % |
(1) |
Mr. Pons’ base salary was increased to $300,000 in connection with his appointment as Chief Manufacturing Officer of the Company effective May 15, 2021. In addition, neither Mr. Pons nor Mr. Silberman were impacted by the COVID-19 related austerity measures that remained in effect for 2021 as they were not yet executive officers when such measures were enacted. |
NEO’s Target Cash Bonus ($) (Base Salary x Target %) |
x |
Performance Factor |
± |
Individual Performance Adjustments |
= |
NEO’s Award Payout |
Participant |
Target Annual Cash Incentive (as % of Base Salary) |
Target Annual Cash Incentive |
||||||
Patrick D. Quarles |
100 | % | $ | 591,000 | ||||
S. Sami Ahmad |
60 | % | $ | 186,754 | ||||
Peter M. Loggenberg |
60 | % | $ | 194,052 | ||||
Rafael F. Pons (1) |
55 | % | $ | 165,000 | ||||
Michael W. Silberman |
55 | % | $ | 178,750 |
(1) | Mr. Pons’ annual incentive target was increased to 55% in connection with his appointment as Chief Manufacturing Officer effective May 15, 2021. Mr. Pons’ annual cash bonus for 2021 was prorated based on his periods of service prior to and after the effective date of his promotion, and the applicable cash bonus target in effect, and base salary paid, for such periods. See the information regarding Mr. Pons compensation under “Employment and Change in Control Arrangements” and our “2021 Summary Compensation Table” for additional information. |
Weight |
Goal | |
60% |
Adjusted EBITDA (Financial Goal). “Non-GAAP Financial Measures” in Part II, Item 7. Management’s Discussion and Analysis of Financial Condition and Results of Operations in the Original Filing. | |
20% |
EHS (Performance Goal). | |
20% |
Annual Controllable Cost Budget (Productivity Goal) |
Beginning of the Performance Period |
During the Performance Period |
End of the Performance Period | ||
Adjusted EBITDA goals, TRIR industry benchmark and spending plans are established by the Compensation Committee and management and approved by the Compensation Committee. | Performance against performance metrics is monitored relative to goals. | Management presents actual Adjusted EBITDA results relative to goals, actual controllable cost results and actual TRIR results along with related process safety and environmental performance and the Compensation Committee reviews performance to determine any payouts. |
Metric |
Weighting |
Threshold (50% Funding) |
Target (100% Funding) |
Maximum (200% Funding) |
Actual Results |
Factor (1) |
||||||||||
Adjusted EBITDA ($) |
60% | $17.92 million (80% of target) |
$22.4 million (2021 budget) |
$26.88 million (20% above target) |
$ | 21.6 million | 0.55 | |||||||||
EHS |
20% | 0.97 | 0.69 | No Injuries No Significant Process Safety Incidents No Environmental enforcements |
0.70 | 0.20 | ||||||||||
Cost Budget ($) |
20% | $84.15 million (10% over budget) |
$76.5 million (2021 budget) |
$68.85 million (10% under budget) |
$ | 75.8 million | 0.22 | |||||||||
|
|
|||||||||||||||
Total Performance Factor |
|
0.96 |
(1) |
Reflects interpolation between funding levels and rounding. |
• | Performance-based RSU awards |
• | RSU awards |
Name of Employee |
Target LTI (as % of Base Salary) |
2021 Base Salary |
Target LTI |
|||||||||
Patrick D. Quarles |
155 | % | $ | 591,000 | $ | 916,050 | ||||||
S. Sami Ahmad |
60 | % | 311,257 | $ | 186,754 | |||||||
Peter M. Loggenberg |
55 | % | 323,420 | $ | 177,881 | |||||||
Rafael F. Pons (1) |
55 | % | 300,000 | $ | 165,000 | |||||||
Michael W. Silberman |
55 | % | 325,000 | $ | 178,750 |
(1) | Mr. Pons’ target LTI equity percentage was increased to 55% in connection with his appointment as Chief Manufacturing Officer effective May 15, 2021. Mr. Pons’ annual LTI equity award was prorated based on his service prior to and after the effective date of his promotion, and the applicable LTI equity target in effect, and base salary paid, for such periods. See the information regarding Mr. Pons compensation under “Employment and Change in Control Arrangements” and our “2021 Summary Compensation Table” for additional information. |
Name of Employee |
Time Vesting Period #1 2/25/21- 2/25/22 |
Time Vesting Period #2 2/25/22- 2/25/23 |
Time Vesting Period #3 2/25/23- 2/25/24 |
Performance Vesting Period 1/1/21- 12/31/24 |
Total number of Time and Performance Vesting RSUs |
|||||||||||||||
Patrick D. Quarles |
21,443 | 21,444 | 21,444 | 64,328 | 128,659 | |||||||||||||||
S. Sami Ahmad |
4,371 | 4,371 | 4,372 | 13,116 | 26,230 | |||||||||||||||
Peter M. Loggenberg |
4,163 | 4,164 | 4,164 | 12,492 | 24,983 | |||||||||||||||
Rafael F. Pons (1) |
3,202 | 3,204 | 3,206 | 9,612 | 19,224 | |||||||||||||||
Michael W. Silberman |
4,184 | 4,184 | 4,185 | 12,552 | 25,105 | |||||||||||||||
|
|
|
|
|
|
|
|
|
|
|||||||||||
Total |
37,363 | 37,367 | 37,371 | 112,100 | 224,201 | |||||||||||||||
|
|
|
|
|
|
|
|
|
|
(1) | Reflects the full LTI equity award granted to Mr. Pons in 2021 prorated based on his service prior to and after the effective date of his promotion, and the applicable LTI equity target in effect, and base salary paid, for such periods. See the information regarding Mr. Pons compensation under “Employment and Change in Control Arrangements” and our “2021 Summary Compensation Table” for additional information. |
Performance |
Percentile Rank |
Earned Percent of Target |
||||
Below Threshold |
<25 th |
0 | % | |||
Threshold |
25 th |
50 | % | |||
Target |
50 th |
100 | % | |||
Maximum (highest) |
100 th |
200 | % |
Relative ROIC Calculation |
||||||
Performance |
Percentile Rank |
Earned Percentage |
||||
Below Threshold |
<25 th |
0 | % | |||
Threshold |
25 th |
50 | % | |||
Target |
50 th |
100 | % | |||
Maximum (highest) |
100 th |
200 | % | |||
Actual Relative ROIC |
<25 th |
0 |
% |
Adjusted EBITDA Growth Calculation |
||||||
Performance |
Percentile Rank |
Earned Percentage |
||||
Below Threshold |
<25 th |
0 | % | |||
Threshold |
25 th |
50 | % | |||
Target |
50 th |
100 | % | |||
Maximum (highest) |
100 th |
200 | % | |||
Actual Relative Adjusted EBITDA Growth |
40 th |
79.8 |
% |
• | the amount (or vesting) of incentive compensation was calculated based upon the achievement of certain financial results that were subsequently reduced due to a restatement (other than as a result of a change in accounting principles); |
• | the amount (or vesting) of incentive compensation that would have been paid (or, in the case of equity-based compensation, vested) to the Covered Officer had the financial results been properly reported would have been lower than the amount actually paid (or, in the case of equity-based compensation, vested); and |
• | the Covered Officer engaged in fraud or misconduct that caused the need for the restatement. |
Name and Principal Position |
Year |
Salary ($) |
Stock Award(s) ($)(1) |
Non-Equity Incentive Plan Compensation ($)(2) |
All Other Compensation ($)(3) |
Total ($) |
||||||||||||||||||
Patrick D. Quarles President and Chief Executive Officer |
2021 | 591,000 | 916,052 | 567,360 | 20,281 | 2,094,693 | ||||||||||||||||||
2020 | 595,742 | 809,998 | 372,330 | 19,084 | 1,797,154 | |||||||||||||||||||
2019 | 600,000 | 780,000 | 838,407 | 73,179 | 2,291,586 | |||||||||||||||||||
S. Sami Ahmad Chief Financial Officer and Treasurer |
2021 | 311,257 | 186,758 | 179,284 | 32,531 | 709,830 | ||||||||||||||||||
2020 | 311,321 | 189,469 | 98,046 | 27,936 | 626,772 | |||||||||||||||||||
2019 | 298,113 | 180,439 | 209,602 | 39,277 | 727,431 | |||||||||||||||||||
Peter M. Loggenberg Chief Commercial and Sustainability Officer |
2021 | 323,420 | 177,879 | 186,290 | 25,550 | 713,139 | ||||||||||||||||||
2020 | 325,230 | 180,557 | 122,253 | 23,491 | 651,531 | |||||||||||||||||||
2019 | 329,135 | 218,537 | 270,806 | 44,357 | 862,835 | |||||||||||||||||||
Rafael F. Pons (4) Chief Manufacturing Officer |
2021 | 269,713 | 136,875 | 137,216 | 18,897 | 562,701 | ||||||||||||||||||
Michael W. Silberman General Counsel and Corporate Secretary |
2021 | 325,000 | 178,748 | 171,600 | 70,531 | 745,879 |
(1) | This column represents the dollar amounts for the years shown of the grant date fair value of RSU awards that were granted in those years, calculated in accordance with SEC rules. For purposes of the time-based RSU awards granted in 2021, fair value is calculated using the closing price of a share of our stock on the date of grant. For purposes of the performance-based RSU awards granted in 2021, fair value is calculated based on the probability of attaining the target performance goals on the date of grant. Assuming that maximum performance was the probable outcome on the date of grant, the grant date value of the performance-based RSU awards granted in 2021 would have been $458,015, $93,386, $68,437, $88,101 and $89,370 for each of Messrs. Quarles, Ahmad, Loggenberg, Pons and Silberman, respectively. For purposes of the performance-based RSU awards granted in 2020, fair value is calculated based on the probability of attaining the target performance goals on the date of grant. Assuming that maximum performance was the probable outcome on the date of grant, the grant date value of the performance-based RSU awards granted in 2021 would have been $404,989, $94,731, $90,272 and $52,137 for each of Messrs. Quarles, Ahmad, Loggenberg and Silberman, respectively. For purposes of the time-based RSU awards granted in 2019, fair value is calculated using the closing price of a share of our stock on the date of grant. For purposes of the |
performance-based RSU awards granted in 2019, fair value is calculated based on the probability of attaining the target performance goals on the date of grant. Assuming that maximum performance was the probable outcome on the date of grant, the grant date value of the performance-based RSU awards granted in 2019 would have been $389,986, $90,214 and $88,940 for each of Messrs. Quarles, Ahmad and Loggenberg, respectively. Amounts for all years do not correspond to the actual value that will be realized by the NEOs. For information on the valuation assumptions used in calculating the amounts in this column, see “Note 2 – Summary of Significant Accounting Policies – Share-Based Compensation” and “Note 15 – Share-Based Compensation” in the Consolidated Financial Statements included in the Original Filing. |
(2) | Payments under our annual cash incentive plan were calculated based on each NEO’s actual cumulative base pay in 2021. |
(3) | See the 2021 All Other Compensation Table below for additional information. |
(4) | Amounts presented for Mr. Pons reflect pro ration based on his service prior to and after the effective date of his promotion to Chief Manufacturing Officer effective May 15, 2021, and the applicable incentive compensation targets in effect, and base salary paid, for such periods. See the information regarding Mr. Pons compensation under “Employment and Change in Control Arrangements” for additional information. |
Name of Executive |
Company 401(k) Contributions |
Holiday Bonus |
Personal Use of Company Car |
Long Term Disability |
Life Insurance Premiums |
Housing |
Total |
|||||||||||||||||||||
Patrick D. Quarles |
$ | 17,400 | $ | 661 | $ | — | $ | 324 | $ | 1,896 | $ | — | $ | 20,281 | ||||||||||||||
S. Sami Ahmad |
17,400 | 661 | 12,250 | 324 | 1,896 | — | 32,531 | |||||||||||||||||||||
Peter M. Loggenberg |
18,146 | 661 | 4,523 | 324 | 1,896 | — | 25,550 | |||||||||||||||||||||
Rafael F. Pons |
16,096 | 661 | — | 324 | 1,816 | — | 18,897 | |||||||||||||||||||||
Michael W. Silberman |
18,150 | 661 | — | 324 | 1,896 | 49,500 | 70,531 |
Estimated Future Payouts Under Non-Equity Incentive Plan Awards(1) |
Estimated Future Payouts under Equity Incentive Plan Awards (2) |
All Other Stock Awards: |
||||||||||||||||||||||||||||||||||||||
Name of Executive |
Grant Date |
Approval Date |
Threshold ($) |
Target ($) |
Maximum ($) |
Threshold (#) |
Target (#) |
Maximum (#) |
Number of Shares of Stock (#)(3) |
Grant Date Fair Value of Stock Awards ($)(4) |
||||||||||||||||||||||||||||||
Patrick D. Quarles |
2/25/21 | 2/14/21 | 32,164 | 64,328 | 128,656 | 64,331 | 916,052 | |||||||||||||||||||||||||||||||||
295,500 | 591,000 | 1,182,000 | ||||||||||||||||||||||||||||||||||||||
S. Sami Ahmad |
2/25/21 | 2/14/21 | 6,558 | 13,116 | 26,232 | 13,114 | 186,758 | |||||||||||||||||||||||||||||||||
93,377 | 186,754 | 373,508 | ||||||||||||||||||||||||||||||||||||||
Peter M. Loggenberg |
2/25/21 | 2/14/21 | 6,246 | 12,492 | 24,984 | 12,491 | 177,879 | |||||||||||||||||||||||||||||||||
97,026 | 194,052 | 388,104 | ||||||||||||||||||||||||||||||||||||||
Rafael F. Pons (5) |
2/25/21 | 2/14/21 | 4,806 | 9,612 | 19,224 | 9,612 | 136,875 | |||||||||||||||||||||||||||||||||
82,500 | 165,000 | 330,000 | ||||||||||||||||||||||||||||||||||||||
Michael W. Silberman |
2/25/21 | 2/14/21 | 6,276 | 12,552 | 25,104 | 12,553 | 178,748 | |||||||||||||||||||||||||||||||||
89,375 | 178,750 | 357,500 |
(1) | Represents the threshold, target and maximum amount of awards that could have been paid pursuant to the 2021 Bonus Plan. Payouts of approximately $1.2 million were awarded under 2021 Bonus Plan. This amount was paid in the first quarter of 2022. |
(2) | Represents the threshold, target and maximum number of shares that could be subject to the performance-based RSU awards granted in 2021 under the Stock Incentive Plan. Fifty percent of the performance awards will be calculated based upon TSR, and the remaining fifty percent will be based on cumulative FCF. The actual number of shares that may become vested will be determined as of December 31, 2024, the end of the performance period. |
(3) | Represents time-based restricted stock awards, granted at a closing price on February 25, 2021, of $7.12 per share which will vest ratably over a three-year period. These awards were granted under the Stock Incentive Plan. |
(4) | Represents the aggregate grant date fair value of both the time-based and performance-based awards granted on February 25, 2021. |
(5) | Amounts presented for Mr. Pons reflect pro ration based on his service prior to and after the effective date of his promotion to Chief Manufacturing Officer effective May 15, 2021, and the applicable incentive compensation targets in effect, and base salary paid, for such periods. See the information regarding Mr. Pons compensation under “Employment and Change in Control Arrangements” for additional information. |
Stock Awards |
||||||||||||||||
Name of Executive |
Number of Shares or Units of Stock That Have Not Vested (#)(2) |
Market Value of Shares or Units of Stock That Have Not Vested ($)(3) |
Equity Incentive Plan Awards: Number of Unearned Shares, Units or Other Rights That Have Not Vested (#)(4)(5)(6) |
Equity Incentive Plan Awards: Market or Payout Value of Unearned Shares, Units or Other Rights That Have Not Vested ($)(3) |
||||||||||||
Patrick D. Quarles |
||||||||||||||||
2019 RSU (Time-Based) |
14,085 | 113,807 | — | — | ||||||||||||
2019 RSU (ROIC) |
— | — | 21,126 | 170,698 | ||||||||||||
2019 RSU (EBITDA Growth) |
— | — | 21,126 | 170,698 | ||||||||||||
2020 RSU (Time-Based) |
41,538 | 335,627 | — | — | ||||||||||||
2020 RSU (ROIC) |
— | — | 31,154 | 251,724 | ||||||||||||
2020 RSU (EBITDA Growth) |
— | — | 31,154 | 251,724 | ||||||||||||
2021 RSU (Time-Based) |
64,331 | 519,794 | — | — | ||||||||||||
2021 RSU (TSR) |
— | — | 32,164 | 259,885 | ||||||||||||
2021 RSU (FCF) |
— | — | 32,164 | 259,885 |
Stock Awards |
||||||||||||||||
Name of Executive |
Number of Shares or Units of Stock That Have Not Vested (#)(2) |
Market Value of Shares or Units of Stock That Have Not Vested ($)(3) |
Equity Incentive Plan Awards: Number of Unearned Shares, Units or Other Rights That Have Not Vested (#)(4)(5)(6) |
Equity Incentive Plan Awards: Market or Payout Value of Unearned Shares, Units or Other Rights That Have Not Vested ($)(3) |
||||||||||||
S. Sami Ahmad |
||||||||||||||||
2019 RSU (Time-Based) |
3,259 | 26,333 | — | — | ||||||||||||
2019 RSU (ROIC) |
— | — | 4,887 | 39,487 | ||||||||||||
2019 RSU (EBITDA Growth) |
— | — | 4,887 | 39,487 | ||||||||||||
2020 RSU (Time-Based) |
9,716 | 78,505 | — | — | ||||||||||||
2020 RSU (ROIC) |
— | — | 7,287 | 58,879 | ||||||||||||
2020 RSU (EBITDA Growth) |
— | — | 7,287 | 58,879 | ||||||||||||
2021 RSU (Time-Based) |
13,114 | 105,961 | — | — | ||||||||||||
2021 RSU (TSR) |
— | — | 6,558 | 52,989 | ||||||||||||
2021 RSU (FCF) |
— | — | 6,558 | 52,989 | ||||||||||||
Peter M. Loggenberg |
||||||||||||||||
2019 RSU (Time-Based) (1) |
1,467 | 11,853 | — | — | ||||||||||||
2019 RSU (Time-Based) |
3,212 | 25,953 | — | — | ||||||||||||
2019 RSU (ROIC) |
— | — | 4,818 | 38,929 | ||||||||||||
2019 RSU (EBITDA Growth) |
— | — | 4,818 | 38,929 | ||||||||||||
2020 RSU (Time-Based) |
9,260 | 74,821 | — | — | ||||||||||||
2020 RSU (ROIC) |
— | — | 6,944 | 56,108 | ||||||||||||
2020 RSU (EBITDA Growth) |
— | — | 6,943 | 56,099 | ||||||||||||
2021 RSU (Time-Based) |
12,491 | 100,927 | — | — | ||||||||||||
2021 RSU (TSR) |
— | — | 6,246 | 50,468 | ||||||||||||
2021 RSU (FCF) |
— | — | 6,246 | 50,468 | ||||||||||||
Rafael F. Pons |
||||||||||||||||
2020 RSU (Time-Based) |
4,617 | 37,305 | — | — | ||||||||||||
2020 RSU (ROIC) |
— | — | 3,462 | 27,973 | ||||||||||||
2020 RSU (EBITDA Growth) |
— | — | 3,462 | 27,973 | ||||||||||||
2021 RSU (Time-Based) |
9,611 | 77,657 | — | — | ||||||||||||
2021 RSU (TSR) |
— | — | 4,806 | 38,832 | ||||||||||||
2021 RSU (FCF) |
— | — | 4,807 | 38,841 |
Stock Awards |
||||||||||||||||
Name of Executive |
Number of Shares or Units of Stock That Have Not Vested (#)(2) |
Market Value of Shares or Units of Stock That Have Not Vested ($)(3) |
Equity Incentive Plan Awards: Number of Unearned Shares, Units or Other Rights That Have Not Vested (#)(4)(5)(6) |
Equity Incentive Plan Awards: Market or Payout Value of Unearned Shares, Units or Other Rights That Have Not Vested ($)(3) |
||||||||||||
Michael W. Silberman |
||||||||||||||||
2020 RSU (Time-Based) (1) |
24,578 | 198,590 | — | — | ||||||||||||
2020 RSU (Time-Based) |
5,348 | 43,212 | — | — | ||||||||||||
2020 RSU (ROIC) |
— | — | 4,010 | 32,401 | ||||||||||||
2020 RSU (EBITDA Growth) |
— | — | 4,011 | 32,409 | ||||||||||||
2021 RSU (Time-Based) |
12,553 | 101,428 | — | — | ||||||||||||
2021 RSU (TSR) |
— | — | 6,276 | 50,710 | ||||||||||||
2021 RSU (FCF) |
— | — | 6,276 | 50,710 |
(1) | The 2019 time-based RSU awards granted on February 12, 2019 to Mr. Loggenberg were part of his letter agreement and vest as follows: one third on February 12, 2020, 2021, and 2022, respectively. The 2020 time-based RSU awards granted on June 1, 2020 to Mr. Silberman were part of his offer letter and vest as follows: one third on June 1, 2021, 2022, and 2023, respectively. |
(2) | The 2019 time-based RSU awards were granted on February 15, 2019, and vest as follows: one third on February 15, 2020, 2021, and 2022, respectively. The 2020 time-based RSU awards were granted on February 13, 2020, and vest as follows: one third on February 13, 2021, 2022, and 2023, respectively. The 2021 time-based RSU awards were granted on February 25, 2021, and vest as follows: one third on February 25, 2022, 2023, and 2024, respectively. |
(3) | The market value of stock reported is calculated by multiplying the number of shares by the closing market price on December 31, 2021, the last day of trading on the NYSE for the 2021 fiscal year, which was $8.08 per share. |
(4) | The 2019 ROIC RSU awards and 2019 EBITDA Growth RSU awards were granted on February 15, 2019 and have a three-year performance period. Payouts will range from 0% to 200% of the target award. The number shown represents the payout assuming threshold performance. For more information on these awards and the associated performance metrics, please see “—2021 Executive Compensation Program—Long-Term Incentive Plan (Equity Compensation)” above. |
(5) | The 2020 ROIC RSU awards and 2020 EBITDA Growth RSU awards were granted on February 13, 2020 and have a three-year performance period. Payouts will range from 0% to 200% of the target award. The number shown represents the payout assuming threshold performance. For more information on these awards and the associated performance metrics, please see “—2021 Executive Compensation Program—Long-Term Incentive Plan (Equity Compensation)” above. |
(6) | The 2021 TSR RSU awards and 2021 FCF RSU awards were granted on February 25, 2021 and have a three-year performance period. Payouts will range from 0% to 200% of the target award. The number shown represents the payout assuming threshold performance. For more information on these awards and the associated performance metrics, please see “—2021 Executive Compensation Program—Long-Term Incentive Plan (Equity Compensation)” above. |
Stock awards |
||||||||
Name of Executive |
Number of shares acquired on vesting (#) |
Value realized on vesting ($)(1) |
||||||
Patrick D. Quarles |
59,854 | 460,502 | ||||||
S. Sami Ahmad |
10,451 | 74,898 | ||||||
Peter M. Loggenberg |
12,028 | 86,198 | ||||||
Ralph F. Pons |
2,308 | 16,571 | ||||||
Michael W. Silberman |
14,961 | 120,691 |
(1) | Amounts reflected in this column are based on the closing price of the Company’s common stock on the date or dates of vesting for each NEO’s restricted stock award. |
• | a lump sum payment in an amount equal to twelve months of his then base salary; |
• | Mr. Quarles’ annual cash incentive award for the year in which termination occurs, prorated for the portion of the year in which Mr. Quarles worked and calculated based on target performance; and |
• | all unvested RSUs granted in connection with his appointment and all other time-vesting awards under our LTI equity plan will immediately vest. |
• | a lump sum payment in an amount equal to twenty-four months of his then base salary; |
• | Mr. Quarles’ annual cash incentive award for the year in which termination occurs, prorated for the portion of the year in which Mr. Quarles worked and calculated based on target performance; and |
• | all unvested RSUs granted in connection with his appointment and all other time-vesting awards under our LTI equity plan will immediately vest. |
• | a lump sum payment in an amount equal to twelve months of his or her then base salary; |
• | the NEO’s annual cash incentive award for the year in which termination occurs, prorated for the portion of the year in which the NEO worked and calculated based on target performance; and |
• | all of the participant’s equity grants under the Company’s LTI plan will immediately vest. |
Name and Triggering Event |
Severance Payment ($) |
Acceleration and Vesting of Equity Awards ($) (1) |
Total ($) |
|||||||||
Patrick D. Quarles |
||||||||||||
Retirement, resignation without good reason or termination with cause |
$ | — | $ | — | $ | — | ||||||
Termination without cause or resignation with good reason |
1,182,000 | 969,228 | 2,151,228 | |||||||||
Termination without cause or resignation with good reason within eighteen months following a corporate change |
1,773,000 | 2,333,843 | (2) |
4,106,843 | ||||||||
Upon death or disability |
— | — | — | |||||||||
S. Sami Ahmad |
||||||||||||
Retirement, resignation without good reason or termination with cause |
$ | — | $ | — | $ | — | ||||||
Termination without cause or resignation with good reason |
— | — | — | |||||||||
Termination without cause or resignation with good reason within eighteen months following a corporate change |
498,011 | 513,508 | (2) |
1,011,519 | ||||||||
Upon death or disability |
— | — | — | |||||||||
Peter M. Loggenberg |
||||||||||||
Retirement, resignation without good reason or termination with cause |
$ | — | $ | — | $ | — | ||||||
Termination without cause or resignation with good reason |
323,420 | (3) |
— | 323,420 | ||||||||
Termination without cause or resignation with good reason within eighteen months following a corporate change |
517,472 | 504,556 | (2) |
1,022,028 | ||||||||
Upon death or disability |
— | — | — | |||||||||
Rafael F. Pons |
||||||||||||
Retirement, resignation without good reason or termination with cause |
$ | — | $ | — | $ | — | ||||||
Termination without cause or resignation with good reason |
— | — | — | |||||||||
Termination without cause or resignation with good reason within eighteen months following a corporate change |
465,000 | 248,581 | (2) |
713,581 | ||||||||
Upon death or disability |
— | — | — | |||||||||
Michael W. Silberman |
||||||||||||
Retirement, resignation without good reason or termination with cause |
$ | — | $ | — | $ | — | ||||||
Termination without cause or resignation with good reason |
503,750 | — | 503,750 | |||||||||
Termination without cause or resignation with good reason within eighteen months following a corporate change |
503,750 | 509,460 | 1,013,210 | |||||||||
Upon death or disability |
— | — | — |
(1) | The value in this column represents an amount equal to the number of shares of common stock underlying the executive officer’s awards that would vest upon the circumstances described as of December 31, 2021 multiplied by the closing market price of our common stock on December 31, 2021 ($8.08), which was the last trading day of 2021. |
(2) | These values including amounts related to the acceleration of awards outstanding as of December 31, 2021 that were issued prior to 2020 and accelerate upon a corporate change (without termination) as described under “Other Change in Control Severance Arrangements — Under Trecora Resources Stock and Incentive Plan.” As noted above, all awards granted since 2020 provided, and it is our intention that future award agreements will provide, that a corporate change will not trigger vesting of the related award unless it is followed by the termination of the NEO consistent with our other change in control severance arrangements. All remaining awards granted prior to 2020 had vesting dates in the first quarter 2021. |
(3) | Under Mr. Loggenberg’s severance agreement, he is entitled to this cash payment only in connection with his termination other than for good cause (as defined in the severance agreement). |
• | We determined that as of December 31, 2021, our employee population consisted of approximately 290 individuals with all of these individuals located in the U.S. This population consisted of our full-time, part-time, and temporary employees. |
• | We identified the median employee from our employee population by listing all employees based on gross wages received for 2021 and calculating the median. The list for calculating the median excluded the CEO. |
• | Since all our employees are located in the U.S., as is our CEO, we did not make any cost-of-living |
• | Once we identified our median employee, we combined all of the elements of such employee’s compensation for 2021 in accordance with the requirements of Item 402(c)(2)(x) of Regulation S-K and as required under the Pay Ratio Rule. |
Name |
Fees Earned or Paid in Cash ($)(1) |
Stock awards ($)(2)(3) |
Total ($) |
|||||||||
Gary K. Adams |
80,000 | 75,000 | 155,000 | |||||||||
Pamela R. Butcher |
80,000 | 75,000 | 155,000 | |||||||||
Nicholas N. Carter |
70,000 | 75,000 | 145,000 | |||||||||
Adam C. Peakes |
85,000 | 75,000 | 160,000 | |||||||||
Janet S. Roemer |
70,000 | 75,000 | 145,000 | |||||||||
Karen A. Twitchell |
110,000 | 75,000 | 185,000 |
(1) | In the aggregate, this column includes committee fees for 2021 in the amount of $35,000, Company Board fees in the amount of $420,000, and Board Chair fees in the amount of $40,000. |
(2) | Represents the aggregate grant date fair value of RSU awards granted to the non-employee directors in 2021, pursuant to ASC 718, disregarding any estimates for forfeitures. These amounts reflect the Company’s total estimated accounting expense and may not correspond to the actual value that will be realized by the non-employee directors. For information on the valuation assumptions, see “Note 2 – Summary of Significant Accounting Policies – Share-Based Compensation” and “Note 15 – Share-Based Compensation” in the Consolidated Financial Statements included in the Original Filing. |
(3) | As of December 31, 2021, aggregate outstanding RSU awards for each director is set forth below. |
Name |
Aggregate Outstanding RSUs |
|||
Gary K. Adams |
10,533 | |||
Pamela R. Butcher |
10,533 | |||
Nicholas N. Carter |
10,533 | |||
Adam C. Peakes |
10,533 | |||
Janet S. Roemer |
10,533 | |||
Karen A. Twitchell |
13,011 |
Annual cash stipend for each non-employee Board member |
$ | 70,000/year | ||
Additional cash stipend for service as Independent Chair of the Board |
$ | 40,000/year | ||
Additional cash stipend for service as Chair of the Audit Committee |
$ | 15,000/year | ||
Additional cash stipend for service as Chair of the Compensation Committee |
$ | 10,000/year | ||
Additional cash stipend for service as Chair of the Nominating and Governance Committee |
$ | 10,000/year |
Plan Category |
Number of securities to be issued upon exercise of outstanding options, warrants, and rights (1) |
Weighted-average exercise price of outstanding options, warrants, and rights |
Number of securities remaining available for future issuance under equity compensation plans (excluding securities reflected in column (a)) |
|||||||||
(a) |
(b) |
(c) |
||||||||||
Equity compensation plans approved by security holders |
1,053,444 | $ | $11.16 | 864,630 | ||||||||
Equity compensation plans not approved by security holders |
— | — | — | |||||||||
Total |
1,053,444 | $ | $11.16 | 864,630 |
(1) | Column (a) includes shares issuable pursuant to outstanding RSUs under the Stock Incentive Plan. RSU awards are not reflected in the exercise price in column (b) as these awards do not have an exercise price. |
• | Company non-employee directors; |
• | Each of our NEOs; |
• | Current directors and Company executive officers as a group; and |
• | All individuals owning more than 5% of the Company’s outstanding common stock. |
Name of Beneficial Owner |
Amount and Nature of Beneficial Ownership (1) |
Note |
Percent of Class |
|||||||
Current Non-Employee Directors |
||||||||||
Gary K. Adams |
139,153 | 2,3 | * | |||||||
Pamela R. Butcher |
43,894 | 3 | * | |||||||
Nicholas N. Carter |
561,344 | 2,3 | 2.36 | % | ||||||
Adam C. Peakes |
28,679 | 3 | * | |||||||
Janet S. Roemer |
45,223 | 3 | * | |||||||
Karen A. Twitchell |
51,942 | 3 | * | |||||||
Named Executive Officers |
||||||||||
S. Sami Ahmad |
33,552 | * | ||||||||
Peter M. Loggenberg |
69,277 | * | ||||||||
Rafael F. Pons |
5,590 | * | ||||||||
Patrick D. Quarles |
318,365 | 1.35 | % | |||||||
Michael W. Silberman |
27,217 | 3 | * | |||||||
All directors and executive officers as a group (11 persons) |
1,324,236 | 2,3,7 | 5.52 | % | ||||||
Individuals with beneficial ownership of more than 5% of outstanding Common Stock |
||||||||||
Funds affiliated with Pangaea Ventures, L.P., Ortelius Advisors, L.P. and Mr. Peter DeSorcy |
2,674,683 | 4 | 11.31 | % | ||||||
Bradley L. Radoff |
2,147,000 | 5 | 9.08 | % | ||||||
Yacktman Asset Management LP |
1,610,000 | 6 | 6.81 | % |
* | Indicates beneficial ownership of less than 1% of shares outstanding. |
(1) | Unless otherwise indicated, to the knowledge of the Company, the owner has sole voting and investment power. |
(2) | Includes 250,000 aggregate shares, which these directors have the right to acquire through the exercise of presently exercisable stock options. These options are held as follows: Mr. Adams 100,000 shares and Mr. Carter 150,000 shares. |
(3) | Includes 77,964 aggregate shares, which these directors and NEO have the right to acquire presently or upon vesting of RSUs within 60 days. These shares are held as follows: Mr. Adams 10,533 shares; Mr. Carter 10,533 shares; Ms. Butcher 10,533 shares; Mr. Peakes 10,533 shares; Ms. Roemer 10,533 shares; Ms. Twitchell 13,011 shares; and Mr. Silberman 12,288. |
(4) | As reported in Amendment No. 5 to Schedule 13D filed jointly by Pangaea Ventures, L.P., Ortelius Advisors, L.P., Mr. Peter DeSorcy, Temmien Ventures III, L.P. and Panthalassa Ventures, L.P. (collectively, the “Pangaea Entities”) with the SEC on February 7, 2022, for their holdings as of February 7, 2022. Each or Ortelius Advisors, L.P. and Mr. DeSorcy reported having shared power to vote 2,674,683 shares of common stock and shared power to dispose of 2,674,683 shares of common stock. Pangaea Ventures, L.P. reported having shared power to vote 2,328,024 shares of common stock and shared power to dispose of 2,328,024 shares of common stock. Temnein Ventures III, L.P. reported having shared power to vote 346,659 shares of common stock and shared power to dispose of 346,659 shares of common stock. According to such filing, Ortelius Advisors, L.P. is the investment manager of Pangaea Ventures, L.P., Temmien Ventures III, L.P. and Panthalassa Ventures, L.P. and Mr. DeSorcy is the Managing Member of the general partner of Ortelius Advisors, L.P., a Managing Member of Ortelius Advisors, L.P., and has a controlling interest in Ortelius Advisors, L.P., and, as a result, Mr. DeSorcy may be deemed to beneficially own the securities beneficially owned by Pangaea Ventures, L.P., Temmien Ventures III, L.P. and Panthalassa Ventures, L.P. Each of the Pangaea Entities principal business office address is 450 Park Avenue, Suite 2700, New York, NY 10022. |
(5) | As reported in Amendment No. 3 to Schedule 13D filed jointly by Bradley L. Radoff (“Mr. Radoff”), The Radoff Family Foundation (“The Foundation”), The K. Peter Heiland 2008 Irrevocable Trust (“The Trust”), JEC II Associates, LLC (“JEC II”), and Michael Torok (“Mr. Torok”, and collectively with Mr. Radoff, the Foundation, The Trust, and JEC II, the “The Radoff Entities”) with the SEC on March 14, 2022, for their holdings as of March 14, 2022 (the “Radoff Filing”). Mr. Radoff reported having sole power to vote 1,422,100 shares of common stock and sole power to dispose of 1,422,100 shares of common stock. The Foundation reported having sole power to vote 133,500 shares of common stock and sole power to dispose of 133,500 shares of common stock. JEC II reported the sole power to vote 513,643 shares of common stock and sole power to dispose of 513,643 shares of common stock. The Trust reported having the sole power to vote 101,357 shares of common stock and the sole power to dispose of 101,357 shares of common stock. Mr. Torok reported having the sole power to vote 725,000 shares of common stock and the sole power to dispose of 725,000 shares of common stock. According to the Radoff Filing, each of the Radoff Entities may be deemed to be a member of a “group” with the other Radoff Entities for the purposes of Section 13(d)(3) of the Exchange Act, and such group may be deemed to beneficially own the 2,147,000 shares owned in the aggregate by the Radoff Entities. Each of the Radoff Entities disclaims beneficial ownership of the shares of common stock that he or it does not directly own. The address provided for Mr. Radoff is 2727 Kirby Drive, Unit 29L, Houston, Texas 77098. |
(6) | As reported on Schedule 13G filed on February 10, 2022, for its holdings as of December 31, 2021. Yacktman Asset Management’s principal business office address is 6300 Bridgepoint Parkway, Building One, Suite 500, Austin, TX 78730. |
(7) | Includes directors and current executive officers. |
• | a director (including any director nominee), |
• | an executive officer, |
• | a person known by the Company to be the beneficial owner of more than 5% of the Company’s common stock (a “5% stockholder”), or |
• | a person known by the Company to be an immediate family member (as defined in the Related Party Transaction Policy) of any of the foregoing. |
2021 |
2020 |
|||||||
Audit Fees |
$ | 285,100 | $ | 347,928 | ||||
Audit-Related Fees |
— | — | ||||||
Tax Fees |
36,225 | 56,710 | ||||||
All Other Fees |
62,822 | 32,860 | ||||||
Total |
$ |
383,647 |
$ |
437,498 |
† | Previously filed with the Original Filing. |
31.2** | Certification of Chief Financial Officer pursuant to Rule 13a-14(a) or 15d-14(a) of the Securities Exchange Act of 1934, as adopted pursuant to Section 302 of the Sarbanes-Oxley Act of 2002 | |
32* | Certification of Chief Executive Officer and Chief Financial Officer pursuant to 18 U.S.C. Section 1350, as adopted pursuant to Section 906 of the Sarbanes-Oxley Act of 2002 | |
101.INS* | XBRL Instance Document | |
101.SCH* | XBRL Taxonomy Schema Document | |
101.CAL* | XBRL Taxonomy Calculation Linkbase Document | |
101.LAB* | XBRL Taxonomy Label Linkbase Document | |
101.PRE* | XBRL Taxonomy Extension Presentation Linkbase Document | |
101.DEF* | XBRL Taxonomy Extension Definition Linkbase Document | |
104** | Cover Page Interactive Data File (formatted as inline XBRL and included as Exhibit 101) |
TRECORA RESOURCES | ||||||
Dated: April 29, 2022 | By: | /s/ Patrick Quarles | ||||
Patrick Quarles | ||||||
Chief Executive Officer and President |
Signature |
Title | |||
/s/ Patrick Quarles Patrick Quarles |
Chief Executive Officer, President and Director (principal executive officer) | |||
/s/ Sami Ahmad Sami Ahmad |
Chief Financial Officer (principal financial officer) | |||
/s/ Christopher Groves Christopher Groves |
Corporate Controller (principal accounting officer) | |||
* Karen A. Twitchell |
Chair of the Board and Director | |||
* Gary K. Adams |
Director | |||
* Pamela R. Butcher |
Director | |||
* Nicolas Carter |
Director | |||
* Adam C. Peakes |
Director | |||
* Janet S. Roemer |
Director |
*By: | /s/ Patrick Quarles | |
Attorney-in-Fact |