UNITED STATES SECURITIES AND EXCHANGE COMMISSION
Washington, D.C. 20549
___________________
FORM 10-K
(MARK ONE)
|
ý
|
ANNUAL REPORT PURSUANT TO SECTION 13 OR 15(d) OF THE SECURITIES EXCHANGE ACT OF 1934
For The Fiscal Year Ended December 31, 2010
OR
|
|
¨
|
TRANSITION REPORT PURSUANT TO SECTION 13 OR 15(d) OF THE SECURITIES EXCHANGE ACT OF 1934
For The Transition Period from ___________ to ________
|
Commission File Number 1-33926
ARABIAN AMERICAN DEVELOPMENT COMPANY
(Exact name of registrant as specified in its charter)
|
Delaware
(State or other jurisdiction of incorporation or organization)
|
75-1256622
(I.R.S. Employer
Identification No.)
|
|
1600 Hwy 6 S, Suite 240
Sugar Land, TX
(Address of principal executive offices)
|
77478
(Zip code)
|
Registrant’s telephone number, including area code: (409) 385-8300
Securities registered pursuant to Section 12(b) of the Act:
None
Securities registered pursuant to Section 12(g) of the Act:
(Title of Class)
Common stock, par value $0.10 per share
___________________
Indicate by check mark if the registrant is a well-known seasoned issuer, as defined in Rule 405 of the Securities Act. Yes¨ Noý
Indicate by check mark if the registrant is not required to file reports pursuant to Section 13 or Section 15(d) of the Act. Yes¨ No ý
_____________________
Indicate by check mark whether the registrant (l) has filed all reports required to be filed by Section 13 or 15(d) of the Securities Exchange Act of 1934 during the preceding 12 months (or for such shorter period that the registrant was required to file such reports), and (2) has been subject to such filing requirements for the past 90 days. Yesý No ¨
Indicate by check mark whether the registrant has submitted electronically and posted on its corporate Website, if any, every Interactive Data File required to be submitted and posted pursuant to Rule 405 of Regulation S-T (§232.405 of this chapter) during the preceding 12 months (or for such shorter period that the registrant was required to submit and post such files). Yes¨ No ¨ The registrant is not yet subject to this requirement.
Indicate by check mark if disclosure of delinquent filers pursuant to Item 405 of Regulation S-K (§229.405 of this chapter) is not contained herein, and will not be contained, to the best of registrant’s knowledge, in definitive proxy or information statements incorporated by reference in Part III of this Form 10-K or any amendment to this Form 10-K. ý
Indicate by check mark whether the registrant is a large accelerated filer, an accelerated filer, a non-accelerated filer, or a smaller reporting company.
Large accelerated filer ¨ Accelerated filer ¨
Non-accelerated filer ý Smaller reporting company¨
Indicate by check mark whether the registrant is a shell company (as defined in Rule 12b-2 of the Act.) Yes¨ No ý
The aggregate market value on June 30, 2010, of the registrant’s voting securities held by non-affiliates was approximately $41 million.
Number of shares of registrant’s Common Stock, par value $0.10 per share, outstanding as of March 15, 2011: 23,690,415.
DOCUMENTS INCORPORATED BY REFERENCE
No documents are incorporated by reference into this report.
Item Number and Description
|
|
|
|
|
| |
|
1
|
| |
|
1
|
| |
|
1
|
| |
|
2
|
| |
|
2
|
| |
|
3
|
| |
|
4
|
| |
|
7
|
| |
|
7
|
| |
|
7
|
| |
|
8
|
| |
|
|
|
|
8
|
| |
|
|
|
|
14
|
| |
|
|
|
|
14
|
| |
|
|
|
|
14
|
| |
|
|
|
|
15
|
| |
|
|
| |
|
|
|
|
15
|
| |
|
|
|
|
16
|
| |
|
|
|
|
|
| |
|
16
|
| |
|
17
|
| |
|
17
|
| |
|
17
|
| |
|
21
|
| |
|
25
|
| |
|
26
|
| |
|
|
|
|
27
|
| |
|
|
|
|
28
|
| |
|
|
|
|
28
|
| |
|
|
|
|
28
|
| |
|
|
|
|
29
|
| |
|
|
| |
|
|
|
|
30
|
| |
|
|
|
|
33
|
| |
|
|
|
|
49
|
Arabian American Development Company (the “Company”) was incorporated in the State of Delaware in 1967. The Company’s principal business activity is the manufacturing of various specialty petrochemical products. The Company also owns a 41% interest in Al Masane Al Kobra, a Saudi Arabian closed joint stock mining company (“AMAK”) and a 55% interest in Pioche Ely Valley Mines, Inc. (“PEVM”), a Nevada mining corporation which presently does not conduct any substantial business activity but owns undeveloped properties in the United States. Unless the context requires otherwise, references to “we,” “us,” “our,” and the “Company” are intended to mean consolidated Arabian American Development Company and its subsidiaries. There have been no significant changes during 2010 in the method of conducting our business.
In 2010 the Company operated in one business segment; the manufacturing of various specialty petrochemical products. See Note 16 of Notes to Consolidated Financial Statements for information concerning the Company’s business segments.
On November 30, 2010, the Company entered into a Letter of Intent and Agreement and Plan of Reorganization with Silsbee Trading and Transportation Company, Inc. (“STTC”) owned by Nicholas N. Carter, the President and CEO of the Company, pursuant to which South Hampton Transportation, Inc. (“SHTI”), a Delaware corporation and an indirectly, wholly owned subsidiary of the Company, acquired 100% of the common stock of STTC. The acquisition was completed on November 30, 2010, and the Company plans in 2011 to merge STTC into South Hampton Resources, Inc. (“South Hampton”), an indirectly, wholly owned subsidiary of the Company with South Hampton as the surviving corporation. Prior to the acquisition of STTC, South Hampton leased transportation related equipment from STTC pursuant to a Master Lease Agreement dated February 3, 2009, which was set to expire in May 2014. The purpose of the acquisition of STTC was the acquisition of various transportation related assets from STTC that are important to South Hampton’s operations and termination of a related-party transaction and lease agreement. Also see Item 13 – Certain Relationships and Related Party Transactions and Director Independence” and Notes 1 and 19 of Notes to Consolidated Financial Statements.
The Company acquired STTC in exchange for the payment to Mr. Carter of (i) cash of $250,000, (ii) a note payable in the amount of $300,000 and (iii) 232,170 shares of the Company’s common stock having a fair value of $775,448.
The most significant asset that the Company recorded as the result of this acquisition was a contractual based intangible asset representing STTC’s right under its lease agreement to lease equipment to and receive lease payments from South Hampton through May 2014. The amount recorded for this asset was based on the discounted net cash flows STTC would have received and represents South Hampton’s cost to cancel the lease by acquiring STTC.
The acquisition of STTC did not have a material effect on the Company’s consolidated financial position or results of operations.
Our domestic activities are primarily conducted through a wholly owned subsidiary, Texas Oil and Chemical Co. II, Inc. (the “Petrochemical Company”), which owns all of the capital stock of South Hampton and until recently STTC. South Hampton owns all of the capital stock of Gulf State Pipe Line Company, Inc. (“Gulf State”). South Hampton owns and operates a specialty petrochemical facility near Silsbee, Texas which produces high purity petrochemical solvents and other petroleum based products including isopentane, normal pentane, isohexane and hexane which may be used in the production of polyethylene, packaging, polypropylene, expandable polystyrene, poly-iso/urethane foams, and in the catalyst support industry. Our petrochemical products are typically transported to customers by rail car, tank truck and iso-container. STTC is the transportation arm of South Hampton. Gulf State owns and operates three pipelines which connect the South Hampton facility to a natural gas line, to South Hampton’s truck and rail loading terminal and to a major petroleum products pipeline owned by an unaffiliated third party. We also directly own approximately 55% of the
capital stock of a Nevada mining company, PEVM. PEVM did not conduct any substantial business activity during 2010, and we have no plans to make any capital expenditures in the near term involving PEVM.
In 2009 the Company formed South Hampton Resources International, SL (“SHRI”) which is located in Madrid, Spain. The Company owns 100% of the capital stock of SHRI. SHRI serves as a sales office for South Hampton products in Europe and the Middle East. SHRI utilizes one sales person.
South Hampton owns and operates a specialty petrochemical facility near Silsbee, Texas which is approximately 30 miles north of Beaumont and 90 miles east of Houston. The facility consists of six operating units which, while interconnected, make distinct products through differing processes: (i) a Penhex Unit; (ii) a Reformer; (iii) a Cyclo-pentane Unit; (iv) an Aromax® Unit; (v) an Aromatics Hydrogenation Unit; and (vi) a White Oil Fractionation Unit. All of these units are currently in operation.
The Penhex Unit has the capacity to process approximately 6,700 barrels per day of fresh feed with the Reforming Unit, the Aromax® Unit, and the Cyclo-Pentane Unit further processing streams produced by the Penhex Unit. The Aromatics Hydrogenation Unit has a capacity of approximately 400 barrels per day, and the White Oils Fractionation Unit has a capacity of approximately 3,000 barrels per day. The facility generally consists of equipment commonly found in most petrochemical facilities such as fractionation towers and hydrogen treaters except the facility is adapted to produce specialized products that are high purity, very consistent, precise specification materials utilized in the petrochemical industry as solvents, additives, blowing agents and cooling agents. South Hampton produces eight distinct product streams and markets several combinations of blends as needed in various customer applications. South Hampton does not produce motor fuel products or any other commodity type products commonly sold directly to retail consumers or outlets.
Products from the Penhex Unit, Reformer Unit, Aromax® Unit, and Cyclo-pentane Unit are marketed directly to the customer by South Hampton marketing personnel. The Penhex Unit had a utilization rate during 2010 of approximately 54%. This compares to a rate of 56% for 2009. The decrease in the utilization rate was due to a decrease in product demand during difficult economic times. The Penhex Unit capacity was essentially doubled in 2008 and is now configured in two independent process units. Since the marketing effort may take several years to utilize the expanded capacity, utilization rates of the unit will be significantly lower over the next few years. However, the volume of material available for sale will be much improved as the original PenHex Unit was operating near capacity for several years prior to the expansion. The two unit configuration also improves reliability by reducing the amount of total down time due to mechanical and other factors. In October 2010 the Company completed the construction of a small Isomerization unit which will allow for greater flexibility in the product slate and provide the ability to convert a product which is less in demand, into one which is a stronger performer.
The Reformer and Aromax® Units are operated as needed to support the Penhex and Cyclo-pentane Units. Consequently, utilization rates of these units are driven by production from the Penhex Unit. Operating utilization rates are affected by product demand, mechanical integrity, and unforeseen natural occurrences, such as weather events. The nature of the petrochemical process demands periodic shut-downs for de-coking and other mechanical repairs.
The other two operating units at the plant site, an Aromatics Hydrogenation Unit and a White Oils Fractionation Unit, are operated as two, independent and completely segregated processes. These units are dedicated to the needs of two different toll processing customers. The customers supply and maintain title to the feedstock, South Hampton processes the feedstock into products based upon customer specifications, and the customers market the products. Products may be sold directly from South Hampton’s storage tanks or transported to the customers’ location for storage and marketing. The units have a combined capacity of 3,400 BPD. Together they realized a utilization rate 53% for 2010 and 45% for 2009. The units are operated in accordance with customer needs, and the contracts call for take or pay minimums of production.
South Hampton, in support of the petrochemical operation, owns approximately 69 storage tanks with total capacity approaching 225,000 barrels, and 95 acres of land at the plant site, 55 acres of which are developed. South Hampton also owns a truck and railroad loading terminal consisting of storage tanks, four rail spurs, and truck and tank car loading facilities on approximately 53 acres of which 13 acres are developed.
South Hampton obtains its feedstock requirements from a sole supplier. A contract was signed on June 1, 2004, between South Hampton and the supplier for the purchase of 65,000 barrels per month of natural gasoline on a secured basis for the period from June 1, 2004 through May 31, 2006, subsequently extended to May 31, 2007 and annually thereafter with thirty days written notice of termination by either party. In December 2006 the agreement was modified so that all purchases are simply on open account under normal credit terms and amounts owed are classified as current. The supplier built a tank to receive feedstock from a major pipeline system and provides storage for use by South Hampton. The arrangement is viewed as a means of solidifying a dependable, long term supply of feedstock for the Company. Storage fees for this arrangement were offset by the cancellation of tank rental fees in place with another party. The tank was completed in July 2007 and began full operation in October 2007.
As a result of various expansion programs and the toll processing contracts, essentially all of the standing equipment at South Hampton is operational. South Hampton has various surplus equipment stored on-site which may be used in the future to assemble additional processing units as needs arise.
Gulf State owns and operates three (3) 8-inch diameter pipelines aggregating approximately 50 miles in length connecting South Hampton’s facility to: (1) a natural gas line, (2) South Hampton’s truck and rail loading terminal and (3) a major petroleum products pipeline system owned by an unaffiliated third party. All pipelines are operated within Texas Railroad Commission and DOT regulations for maintenance and integrity.
South Hampton sells its products to predominantly Fortune 500 companies for use in the production of polyethylene, packaging, polypropylene, expandable polystyrene, poly-iso/urethane foams, and in the catalyst support industries. Products are marketed via personal contact and through continued long term relationships. Sales personnel visit customer facilities regularly and also attend various petrochemical conferences throughout the world. We have an internet presence as well. South Hampton has adopted a strategy of moving its larger volume customers to formula based pricing to reduce the effect of feedstock cost volatility. Under formula pricing the price charged to the customer is based on a formula which includes as a component the average cost of feedstock over the prior month. As a result, with this pricing mechanism, product prices move in conjunction with feedstock prices without the necessity of announced price changes. However, because the formulas use an average feedstock price from the prior month, the movement of prices will trail the movement of costs, and formula prices may or may not reflect our actual feedstock cost for the month during which the product is actually sold. In addition, while formula pricing can benefit product margins during periods of increasing feedstock costs, during periods of decreasing feedstock costs formula pricing may cause the Company to lose the ability to maintain product pricing and retain higher margins. The Company believes that the use of formula pricing can reduce the volatility and increase the predictability of product margins. However, the Company continues to investigate alternative product pricing methods. During 2010 and 2009, sales to two customers exceeded 10 percent or more of the Company’s revenues. In both cases these sales represented multiple products at multiple facilities.
The Company’s only mineral interest in the United States is its ownership interest in PEVM. PEVM has been inactive for many years. PEVM’s properties include 48 patented and 5 unpatented claims totaling approximately 1,500 acres. All the claims are located in the PEVM Mining District, Lincoln County, Nevada. There are prospects and mines on these claims that previously produced silver, gold, lead, zinc and copper. There is a 300-ton-a-day processing mill on property owned by PEVM. The mill is not currently in use and a significant expenditure would be required in order to put the mill into continuous operation if commercial mining is to be conducted on the property. PEVM’s properties are located approximately 100 miles from Las Vegas, Nevada, and with the significant growth which has occurred in Las Vegas, the Company believes the real estate value of PEVM is potentially greater than the metal value. However, the recent real estate crisis has caused the Company to re-evaluate the holdings and a write down of approximately $496,000 was recorded at the end of 2008. No additional impairment was recorded in 2009 or 2010.
The Board of Directors of PEVM has determined that the Company should sell parcels of the real estate if market conditions are acceptable. Mr. Carter, appointed as a Director in 2007, was appointed President of PEVM, and Charles Goehringer was appointed Director and Vice President in January 2008. Mr. Goehringer resigned as Vice President in March 2009. Title research has been conducted and the Company is satisfied that most of the claims can be sold for real estate value. In 2008 the Company learned of a claim by the U.S. Bureau of Land Management (“BLM”) against World Hydrocarbons, Inc. for contamination of real property owned by the BLM north of and immediately adjacent to the processing mill situated on property owned by PEVM. The BLM’s claim alleged that mine tailings from the processing mill containing lead and arsenic migrated onto BLM property during the first half of the twentieth century. World Hydrocarbons, Inc. responded to the BLM by stating that it does not own the mill and that PEVM is the owner and
responsible party. PEVM subsequently commenced dialogue with the BLM in late 2008 to determine how best to remedy the situation. Communication with the BLM is continuing. PEVM has retained an environmental consultant to assist with the resolution of this matter and as of December 31, 2010, had recorded a liability of $350,000 to cover estimated remediation costs.
At this time, neither the Company nor PEVM have plans to develop the mining assets near Pioche, Nevada. Periodically proposals are received from outside parties who are interested in developing or using certain assets. Management does not anticipate making any significant domestic mining capital expenditures.
General. The Company’s operations are subject to stringent and complex federal, state, local and foreign laws and regulations relating to release of hazardous substances or wastes into the environment or otherwise relating to protection of the environment. As with the industry generally, compliance with existing and anticipated environmental laws and regulations increases our overall costs of doing business, including costs of planning, constructing, and operating plants, pipelines, and other facilities. Included in our construction and operation costs are capital cost items necessary to maintain or upgrade equipment and facilities. Similar costs are likely upon changes in laws or regulations and upon any future acquisition of operating assets.
Any failure to comply with applicable environmental laws and regulations, including those relating to equipment failures and obtaining required governmental approvals, may result in the assessment of administrative, civil or criminal penalties, imposition of investigatory or remedial activities and, in less common circumstances, issuance of injunctions or construction bans or delays. We believe that we currently hold all material governmental approvals required to operate our major facilities. As part of the regular overall evaluation of our operations, we have implemented procedures to review and update governmental approvals as necessary. We believe that our operations and facilities are in substantial compliance with applicable environmental laws and regulations and that the cost of compliance with such laws and regulations currently in effect will not have a material adverse effect on our operating results or financial condition.
The clear trend in environmental regulation is to place more restrictions and limitations on activities that may affect the environment, and thus there can be no assurance as to the amount or timing of future expenditures for environmental compliance or remediation, and actual future expenditures may be different from the amounts we currently anticipate. Moreover, risks of process upsets, accidental releases or spills are associated with our possible future operations, and we cannot assure you that we will not incur significant costs and liabilities, including those relating to claims for damage to property and persons as a result of any such upsets, releases, or spills. In the event of future increases in environmental costs, we may be unable to pass on those cost increases to customers. A discharge of hazardous substances or wastes into the environment could, to the extent losses related to the event are not insured, subject us to substantial expense, including both the cost to comply with applicable laws and regulations and to pay fines or penalties that may be assessed and the cost related to claims made by neighboring landowners and other third parties for personal injury or damage to natural resources or property. The Company will attempt to anticipate future regulatory requirements that might be imposed and plan accordingly to comply with changing environmental laws and regulations and to minimize costs with respect to more stringent future laws and regulations of more rigorous enforcement of existing laws and regulations.
Hazardous Substance and Waste. To a large extent, the environmental laws and regulations affecting the Company’s operations relate to the release of hazardous substances or solid wastes into soils, groundwater and surface water, and include measures to prevent and control pollution. These laws and regulations generally regulate the generation, storage, treatment, transportation and disposal of solid and hazardous wastes, and may require investigatory and corrective actions at facilities where such waste may have been released or disposed. For instance, the Comprehensive Environmental Response, Compensation and Liability Act, or CERCLA, also known as the “Superfund” law, and comparable state laws, impose liability without regard to fault or the legality of the original conduct, on certain classes of persons that contributed to a release of “hazardous substance” into the environment. Potentially liable persons include the owner or operator of the site where a release occurred and companies that disposed or arranged for the disposal of the hazardous substances found at the site. Under CERCLA, these persons may be subject to joint and several liability for the costs of cleaning up the hazardous substances that have been released into the environment, for damages to natural resources, and for the costs of certain health studies. CERCLA also authorizes the EPA and, in some cases, third parties to take actions in response to threats to the public health or the environment and to seek to recover from the potentially responsible classes of persons the costs they incur. The
Company has not received any notification that it may be potentially responsible for cleanup costs under CERCLA or any analogous federal or state laws, except as expressly provided herein.
We also generate, and may in the future generate, both hazardous and nonhazardous solid wastes that are subject to requirements of the federal Resource Conservation and Recovery Act, or RCRA, and/or comparable state statutes. From time to time, the Environmental Protection Agency, or EPA, and state regulatory agencies have considered the adoption of stricter disposal standards for nonhazardous wastes, including crude oil and natural gas wastes. Moreover, it is possible that some wastes generated by us that are currently classified as nonhazardous may in the future be designated as “hazardous wastes,” resulting in the wastes being subject to more rigorous and costly management and disposal requirements.
Air Emissions. The Company’s current and future operations are subject to the federal Clean Air Act and comparable state laws and regulations. These laws and regulations regulate emissions of air pollutants from various industrial sources, including our facilities, and impose various monitoring and reporting requirements. Pursuant to these laws and regulations, we may be required to obtain environmental agency pre-approval for the construction or modification of certain projects or facilities expected to produce air emissions or result in an increase in existing air emissions, obtain and comply with the terms of air permits, which include various emission and operational limitations, or use specific emission control technologies to limit emissions. The Company will likely be required to incur certain capital expenditures in the future for air pollution control equipment in connection with maintaining or obtaining governmental approvals addressing air-emission related issues. Failure to comply with applicable air statutes or regulations may lead to the assessment of administrative, civil or criminal penalties, and may result in the limitation or cessation of construction or operation of certain air emission sources. We believe such requirements will not have a material adverse effect on our financial condition or operating results, and the requirements are not expected to be more burdensome to us than any similarly situated company.
Climate Change. In response to concerns suggesting that emissions of certain gases, commonly referred to as “greenhouse gases” (including carbon dioxide and methane), may be contributing to warming of the Earth’s atmosphere, the U.S. Congress is actively considering legislation to reduce such emissions. In addition, at least one-third of the states, either individually or through multi-state regional initiatives, have already taken legal measures intended to reduce greenhouse gas emissions, primarily through the planned development of greenhouse gas emission inventories and/or greenhouse gas cap and trade programs. In addition, EPA is taking steps that would result in the regulation of greenhouse gases as pollutants under the federal Clean Air Act. Furthermore, in September 2009 EPA finalized regulations that require monitoring and reporting of greenhouse gas emissions on an annual basis including extensive greenhouse gas monitoring and reporting requirements beginning in 2010. Although the greenhouse gas reporting rule does not control greenhouse gas emission levels from any facilities, it will still cause us to incur monitoring and reporting costs for emissions that are subject to the rule. Some of our facilities include source categories that are subject to the greenhouse gas reporting requirements included in the final rule. In December 2009 EPA also issued findings that greenhouse gases in the atmosphere endanger public health and welfare and emissions from mobile sources cause or contribute to greenhouse gases in the atmosphere. The endangerment findings will not immediately affect our operations, but standards eventually promulgated pursuant to these findings could affect our operations and ability to obtain air permits for new or modified facilities. Legislation and regulations relating to control or reporting of greenhouse gas emissions are also in various stages of discussions or implementation in about one-third of the states. Lawsuits have been filed seeking to force the federal government to regulate greenhouse gases emissions under the Clean Air Act and to require individual companies to reduce greenhouse gas emissions from their operations. These and other lawsuits may result in decisions by state and federal courts and agencies that could impact the Company’s operations and ability to obtain certifications and permits to construct future projects.
Passage of climate change legislation or other federal or state legislative or regulatory initiatives that regulate or restrict emissions of greenhouse gases in areas in which we conduct business could adversely affect the demand for the products we store, transport, and process, and depending on the particular program adopted, could increase the costs of our operations including costs to operate and maintain our facilities, install new emission controls on our facilities, acquire allowances to authorize the Company’s greenhouse gas emissions, pay any taxes related to the Company’s greenhouse gas emissions and/or administer and manage a greenhouse gas emissions program. We may be unable to recover any such lost revenues or increase costs in the rates we charge customers, and any such recovery may depend on events beyond our control. Reductions in our revenues or increases in our expenses as a result of climate control initiatives could have adverse effects on the Company’s business, financial position, results of operations and prospects.
Clean Water Act. The Federal Water Pollution Control Act, also known as the Clean Water Act, and comparable state laws impose restrictions and strict controls regarding the discharge of pollutants, including natural gas liquid related wastes, into state waters or waters of the United States. Regulations promulgated pursuant to these laws require that entities that discharge into federal and state waters obtain National Pollutant Discharge Elimination System, or NPDES, and/or state permits authorizing these discharges. The Clean Water Act and analogous state laws assess administrative, civil and criminal penalties for discharges of unauthorized pollutants into the water and impose substantial liability for the costs of removing spills from such waters. In addition, the Clean Water Act and analogous state laws require that individual permits or coverage under general permits be obtained by covered facilities for discharges of storm water runoff. The Company believes that it is in substantial compliance with Clean Water Act permitting requirements as well as the conditions imposed there under, and that continued compliance with such existing permit conditions will not have a material effect on the Company’s operations.
TCEQ. In 1993 during remediation of a small spill area, the Texas Commission on Environmental Quality (TCEQ) required South Hampton to drill a well to check for groundwater contamination under the spill area. Two pools of hydrocarbons were discovered to be floating on the groundwater at a depth of approximately 25 feet. One pool is under the site of a former gas processing plant owned and operated by Sinclair, Arco and others before its purchase by South Hampton in 1981. Analysis of the material indicates it entered the ground prior to South Hampton’s acquisition of the property. The other pool is under the original South Hampton facility and analysis indicates the material was deposited decades ago. Tests conducted have determined that the hydrocarbons are contained on the property and not migrating in any direction. The recovery process was initiated in June 1998 and approximately $53,000 was spent setting up the system. The recovery is proceeding as planned and is expected to continue for many years until the pools are reduced to acceptable levels. Expenses of recovery and periodic migration testing are being recorded as normal operating expenses. Expenses for future recovery are expected to stabilize and be less per annum than the initial set up cost, although there is no assurance of this effect. The light hydrocarbon recovered from the former gas plant site is compatible with our normal Penhex feedstock and is accumulated and transferred into the Penhex feedstock tank. The material recovered from under the original South Hampton site is accumulated and sold as a by-product. Approximately 150 barrels were recovered during 2010 and 473 barrels during 2009. The recovered material had an economic value of approximately $13,000 during 2010 and $30,000 during 2009. Consulting engineers estimate that as much as 20,000 barrels of recoverable material may be available to South Hampton for use in its process or for sale. At current market values this material, if fully recovered would be worth approximately $1,500,000. The final volume present and the ability to recover it are both highly speculative issues due to the area over which it is spread and the fragmented nature of the pockets of hydrocarbon. South Hampton has drilled additional wells periodically to further delineate the boundaries of the pools and to ensure that migration has not taken place. These tests confirmed that no migration of the hydrocarbon pools has occurred. The TCEQ has deemed the current action plan acceptable and reviews the plan on a semi-annual basis. Also, see Item 3. Legal Proceedings.
The Clean Air Act Amendments of 1990. The Clean Air Act Amendments of 1990 had a positive effect on the Petrochemical Company’s business as manufacturers search for ways to use more environmentally acceptable materials in their processes. There is a current trend among manufacturers toward the use of lighter and more recoverable C5 hydrocarbons (pentanes) which comprise a large part of the Petrochemical Company’s product line. We believe our ability to manufacture high quality solvents in the C5 hydrocarbon market will provide a basis for growth over the coming years. Also, as the use of C6 solvents is phased out in parts of the industry, several manufacturers of such solvents have opted to no longer market those products. As the number of producers has consolidated, we have increased our market share at higher sales prices from customers who still require C6 solvents in their business. Also, see Item 2. Properties.
As discussed above under “United States Mineral Interests” in 2008 the Company learned of a claim by the BLM against World Hydrocarbons, Inc. for contamination of real property owned by the BLM north of and immediately adjacent to the processing mill situated on property owned by PEVM. World Hydrocarbons, Inc. responded to the BLM by stating that it does not own the mill and that PEVM is the owner and responsible party.
The number of regular employees was approximately 145, 140 and 130 at years ended 2010, 2009 and 2008, respectively. Regular employees are defined as active executive, management, professional, technical and wage employees who work full time or part time for the Company and are covered by our benefit plans and programs.
During 2010 we either terminated or transferred to AMAK all of our employees working in Saudi Arabia except for 2 who were subsequently terminated early in 2011. In connection therewith, we paid accrued salaries and termination benefits due these employees with the exception of Mr. Hatem El Khalidi whose termination benefits were accrued pending resolution of a lawsuit brought by Mr. El Khalidi against the Company in Saudi Arabia seeking back pay for overtime and holidays. Also, see Item 3. Legal Proceedings.
The petrochemical and mining industries are highly competitive. There is competition within the industries and also with other industries in supplying the chemical and mineral needs of both industrial and individual consumers. We compete with other firms in the sale or purchase of needed goods and services and employ all methods of competition which are lawful and appropriate for such purposes. See further discussion under “Intense competition” in Item 1a.
We own a 41% interest in AMAK, a Saudi Arabian closed joint stock mining company. The AMAK project site is located in the Najran province in southwestern Saudi Arabia. AMAK’s mining activities are expected to produce copper, zinc, nickel, gold and silver. The project site is located 75 km northwest of Najran, midway between the outpost of Rihab and the district town of Sufah.
In August 2010, the Saudi Arabian Ministry of Commerce approved amendments to AMAK’s Articles of Association and Bylaws which provide that the Company has fully and completely paid the subscription price for 18,450,000 shares of AMAK stock (or 41% of the issued and outstanding shares), that neither AMAK nor the other AMAK shareholders may require the Company to make an additional capital contribution without the Company’s written consent, and that the Company will retain seats on the AMAK Board equal in number to that of the Saudi Arabian shareholders for a three year period beginning August 25, 2009. This was the final step in settling the issue as to whether the Company might be obligated to pay in an additional capital contribution to AMAK.
On October 24, 2010, we executed a limited Guarantee in favor of the Saudi Industrial Development Fund (“SIDF”) guarantying up to 41% of the SIDF loan to AMAK in the principal amount of 330,000,000 Saudi Riyals (US$88,000,000) (the “Loan”). As a condition of the Loan, SIDF required all shareholders of AMAK to execute personal or corporate Guarantees totaling 162.55% of the overall Loan amount. The other AMAK shareholders provided personal Guarantees. We were the only AMAK shareholder providing a corporate Guarantee. The Loan was required in order for AMAK to fund construction of the underground and above-ground portions of its mining project in southwest Saudi Arabia and to provide working capital for commencement of operations.
Accounting Treatment of Investment in AMAK. Initially, we accounted for our investment in AMAK using the equity method of accounting under the presumption that since we owned more than 20% of AMAK, we would have the ability to exercise significant influence over the operating and financial policies of AMAK. AMAK’s bylaws require that audited financial statements for each year ended December 31 be submitted to its stockholders by June 30 of the following year. As a result, we had expected to obtain the audited financial statements of AMAK by June 30, 2009, and in addition we expected to be able to secure the cooperation of AMAK and its auditors in converting those financial statements from generally accepted accounting principles in Saudi Arabia (“Saudi GAAP”) to U.S. generally accepted accounting principles (“U.S. GAAP”). However, by August 2009, no financial statements of AMAK had been produced. In May 2010 we received a draft of the 2009 financial statements of AMAK prepared under Saudi Arabian GAAP. At that time we introduced a resolution at a meeting of the AMAK Board of Directors that would have required AMAK to produce the annual and quarterly financial statements prepared in accordance with U.S. GAAP which the Company required in order to apply the equity method of accounting for the investment. The resolution was defeated as the result of the casting of the tie breaking vote held by the Saudi Chairman of the Board. Consequently, we concluded that since August 2009 we no longer had significant influence over the operating and financial policies of AMAK, and we changed to the cost method of accounting for our investment in AMAK. We recorded our cost method investment in AMAK at the carrying amount of its equity method investment
at the date the method of accounting was changed. Also see Item 1A – Risk Factors - Inability to significantly influence AMAK activities.”
Going forward, the lack of ability to exert significant influence basically means that we hold a passive ownership interest in AMAK. The AMAK Saudi directors have taken the lead in dealing with: (i) the various contractors who are constructing the underground and above ground mining facilities, (ii) personnel issues, (iii) credit facilities from third party lenders, and (iv) consultants assisting in various phases of mine development. The Company believes that it has developed a good working relationship with the other AMAK stockholders and feels comfortable with allowing the AMAK Saudi directors to oversee the operation, especially since the project is located in their region and they are better qualified to deal with cultural issues and other unique aspects of doing business in Saudi Arabia. Periodically we make suggestions as to how the operation could be improved and generally the AMAK Saudi directors have been receptive to those ideas.
Cash Flows from AMAK. Our investment in AMAK will produce cash flows to the Company at such time as AMAK pays dividends. The Company anticipates that AMAK may have the ability to begin paying dividends once it has commenced commercial operations, and its cash flows from those operations are sufficient to pay dividends after AMAK first services its $88 million credit facility and AMAK’s Board of Directors sets aside cash for required statutory reserves and any other reserves its Board of Directors believes are necessary and appropriate. Since we have no significant influence over AMAK’s Board of Directors, the amount and timing of the dividends we receive from AMAK will be controlled by the other investors in AMAK.
AMAK will nonetheless not begin paying any dividends until it has commenced commercial production and achieved positive operating cash flows. AMAK’s current development plans call for the final stages of underground development to commence in the second half of 2011 with small quantities of ore being processed in the mill and gradually increasing over time as the underground tunnels, vent shafts and turnarounds are constructed. Metal concentrates will be trucked to the Port of Jizan and stored until such time as there are quantities sufficient to fill a cargo ship. Once the mine reaches full capacity, several vessels per year will be loaded with copper and zinc concentrates which can then be shipped worldwide. Cash flows to AMAK from the sale of its production will be subject to the timing of full vessels actually getting underway unless AMAK can successfully negotiate advanced payment from customers at the time the metal concentrates are delivered to the Jizan storage facility.
As a result of the foregoing, we do not anticipate receiving any substantial cash flows from its investment in AMAK until 2013 at the earliest, and there can be no assurance as to the amount or timing of any cash flows we will receive from our investment in AMAK.
We will test our investment in AMAK to determine if it is impaired at least annually and at other times if circumstances arise that indicate that impairment may have occurred. The AMAK investment will be considered impaired if its fair value is less than its recorded amount at the time of the impairment test. In such instances, the recorded amount of the AMAK investment will be reduced to its fair value. The fair value of our investment in AMAK will be estimated by using updated estimates of AMAK’s recoverable ore reserves and the amount and timing of the cash flows to be generated by the production of those reserves.
The Company will provide paper copies of this Annual Report on Form 10-K, our quarterly reports on Form 10-Q, our current reports on Form 8-K and amendments to those reports, all as filed or furnished pursuant to Section 13(a) or 15(d) of the Securities Exchange Act of 1934, free of charge upon written or oral request to Arabian American Development Company, P. O. Box 1636, Silsbee, TX 77656, (409) 385-8300. These reports are also available free of charge on our website, www.arabianamericandev.com, as soon as reasonably practicable after they are filed electronically with the SEC. South Hampton also has a website at www.southhamptonr.com, and AMAK has a website at www.amak.com.sa. These websites and the information contained on or connected to them are not incorporated by reference herein to the SEC filings.
The Company’s financial and operating results are subject to a variety of risks inherent in the global petrochemical and mining businesses (due to our investment in AMAK). Many of these risk factors are not within our control and could
adversely affect our business, our financial and operating results or our financial condition. We discuss some of those risks in more detail below.
Use of single source suppliers for raw materials could create supply issues
The Company’s use of single source suppliers for certain raw materials could create supply issues. Replacing a single source supplier could delay production of some products as replacement suppliers initially may be subject to capacity constraints or other output limitations. The loss of a single source supplier, the deterioration of our relationship with a single source supplier, or any unilateral modification to the contractual terms under which we are supplied raw materials by a single source supplier could adversely affect our revenue and gross margins.
Dependence on a limited number of customers could adversely impact profitability
During 2010 and 2009, sales to each of two customers by the Petrochemical Company exceeded 10 percent or more of the Company’s revenues. In both cases these sales represented multiple products at multiple facilities. The loss of either of these two customers could adversely affect the Petrochemical Company’s ability to market its products on a competitive basis and generate a profit.
Varying economic conditions could adversely impact demand for products
The demand for petrochemicals and metals correlates closely with general economic growth rates. The occurrence of recessions or other periods of low or negative growth will typically have a direct adverse impact on our results. Other factors that affect general economic conditions in the world or in a major region, such as changes in population growth rates or periods of civil unrest, also impact the demand for petrochemicals and metals. Economic conditions that impair the functioning of financial markets and institutions also pose risks to the Company, including risks to the safety of our financial assets and to the ability of our partners and customers to fulfill their commitments to the Company. In addition, the revenue and profitability of our operations have historically varied, which makes future financial results less predictable. The Company’s revenue, gross margin and profit vary among our products, customer groups and geographic markets; and therefore, will likely be different in future periods than currently. Overall gross margins and profitability in any given period are dependent partially on the product, customer and geographic mix reflected in that period’s net revenue. In addition, newer geographic markets may be relatively less profitable due to investments associated with entering those markets and local pricing pressures. Market trends, competitive pressures, increased raw material or shipping costs, regulatory impacts and other factors may result in reductions in revenue or pressure on gross margins of certain segments in a given period which may necessitate adjustments to our operations.
Environmental regulation
The petrochemical industry is subject to extensive environmental regulation pursuant to a variety of federal and state regulations. Such environmental legislation imposes, among other things, restrictions, liabilities and obligations in connection with storage, transportation, treatment and disposal of hazardous substances and waste. Legislation also requires us to operate and maintain our facilities to the satisfaction of applicable regulatory authorities. Costs to comply with these regulations are significant to our business. Failure to comply with these laws or failure to obtain permits may expose us to fines, penalties or interruptions in operations that could be material to our results of operations.
Regulatory and litigation
Even in countries with well-developed legal systems where the Company does business, we remain exposed to changes in law that could adversely affect our results, such as increases in taxes, price controls, changes in environmental regulations or other laws that increase our cost of compliance, and government actions to cancel contracts or renegotiate items unilaterally. We may also be adversely affected by the outcome of litigation or other legal proceedings, especially in countries such as the United States in which very large and unpredictable punitive damage awards may occur. AMAK’s mining lease for the Al Masane area in Saudi Arabia is subject to the risk of termination if AMAK does not comply with its contractual obligations. Further, our investment in AMAK is subject to the risk of expropriation or nationalization. If a dispute arises, the Company may have to submit to the jurisdiction of a foreign court or panel or may have to enforce the judgment of a foreign court or panel in that foreign jurisdiction. Because of our substantial international investments, our business is affected by changes in foreign laws and regulations (or interpretation of existing laws and regulations) affecting both the mining and petrochemical industries, and foreign taxation. The Company will be directly affected by the adoption of rules and regulations (and the interpretations of such rules and
regulations) regarding the exploration and development of mineral properties for economic, environmental and other policy reasons. We may be required to make significant capital expenditures to comply with non-U.S. governmental laws and regulations. It is also possible that these laws and regulations may in the future add significantly to our operating costs or may significantly limit our business activities. Additionally, the Company’s ability to compete in the international market may be adversely affected by non-U.S. governmental regulations favoring or requiring the awarding of leases, concessions and other contracts or exploration licenses to local contractors or requiring foreign contractors to employ citizens of, or purchase supplies from, a particular jurisdiction. We are not currently aware of any specific situations of this nature, but there are always opportunities for this type of difficulty to arise in the international business environment.
Loss of key personnel
In order to be successful, we must attract, retain and motivate executives and other key employees, including those in managerial, technical, sales, and marketing positions. We must also keep employees focused on our strategies and goals. The failure to hire or loss of key employees could have a significant adverse impact on operations.
Market place volatility
The Company’s stock price, like that of other companies, can be volatile. Some of the factors that can affect our stock price are:
|
•
|
Speculation in the press or investment community about, or actual changes in, our executive team, strategic position, business, organizational structure, operations, financial condition, financial reporting and results, effectiveness of cost cutting efforts, prospects or extraordinary transactions;
|
|
•
|
Announcements of new products, services, technological innovations or acquisitions by the Company or competitors; and
|
|
•
|
Quarterly increases or decreases in revenue, gross margin or earnings, changes in estimates by the investment community or guidance provided by the Company, and variations between actual and estimated financial results.
|
General or industry-specific market conditions or stock market performance or domestic or international macroeconomic and geopolitical factors unrelated to our performance may also affect the price of our common stock. For these reasons, investors should not rely on recent trends to predict future stock prices, financial condition, results of operations or cash flows. In addition, following periods of volatility in a company’s securities, securities class action litigation against a company is sometimes instituted. If instituted against us, this type of litigation, while insured against monetary awards and defense cost, could result in substantial diversion of management’s time and resources.
Risk associated with extraordinary transactions
As part of the Company’s business strategy, we sometimes engage in discussions with third parties regarding possible investments, acquisitions, strategic alliances, joint ventures, divestitures and outsourcing transactions (“extraordinary transactions”) and enter into agreements relating to such extraordinary transactions in order to further our business objectives. In order to pursue this strategy successfully, we must identify suitable candidates for and successfully complete extraordinary transactions, some of which may be large and complex, and manage post-closing issues such as the integration of acquired companies or employees. Integration and other risks of extraordinary transactions can be more pronounced for larger and more complicated transactions, or if multiple transactions are pursued simultaneously. If the Company fails to identify and complete successfully extraordinary transactions that further our strategic objectives, we may be required to expend resources to develop products and technology internally, we may be at a competitive disadvantage or we may be adversely affected by negative market perceptions, any of which may have a material adverse effect on the Company’s revenue, gross margin and profitability. Integration issues are complex, time-consuming and expensive and, without proper planning and implementation, could significantly disrupt our business. The challenges involved in integration include:
|
•
|
Combining product offerings and entering into new markets in which we are not experienced;
|
|
•
|
Convincing customers and distributors that the transaction will not diminish client service standards or business focus, preventing customers and distributors from deferring purchasing decisions or switching to other suppliers
|
(which could result in our incurring additional obligations in order to address customer uncertainty), and coordinating sales, marketing and distribution efforts;
|
•
|
Minimizing the diversion of management attention from ongoing business concerns;
|
|
•
|
Persuading employees that business cultures are compatible, maintaining employee morale and retaining key employees, engaging with employee works councils representing an acquired company’s non-U.S. employees, integrating employees into the Company, correctly estimating employee benefit costs and implementing restructuring programs;
|
|
•
|
Coordinating and combining administrative, manufacturing, and other operations, subsidiaries, facilities and relationships with third parties in accordance with local laws and other obligations while maintaining adequate standards, controls and procedures;
|
|
•
|
Achieving savings from supply chain integration; and
|
|
•
|
Managing integration issues shortly after or pending the completion of other independent transactions.
|
The Company periodically evaluates and enters into significant extraordinary transactions on an ongoing basis. We may not fully realize all of the anticipated benefits of any extraordinary transaction, and the timeframe for achieving benefits of an extraordinary transaction may depend partially upon the actions of employees, suppliers or other third parties. In addition, the pricing and other terms of our contracts for extraordinary transactions require us to make estimates and assumptions at the time we enter into these contracts, and, during the course of our due diligence, we may not identify all of the factors necessary to estimate our costs accurately. Any increased or unexpected costs, unanticipated delays or failure to achieve contractual obligations could make these agreements less profitable or unprofitable. Managing extraordinary transactions requires varying levels of management resources, which may divert our attention from other business operations. These extraordinary transactions also have resulted and in the future may result in significant costs and expenses and charges to earnings. Moreover, the Company has incurred and will incur additional depreciation and amortization expense over the useful lives of certain assets acquired in connection with extraordinary transactions, and, to the extent that the value of goodwill or intangible assets with indefinite lives acquired in connection with an extraordinary transaction becomes impaired, we may be required to incur additional material charges relating to the impairment of those assets. In order to complete an acquisition, we may issue common stock, potentially creating dilution for existing stockholders, or borrow, affecting our financial condition and potentially our credit ratings. Any prior or future downgrades in the Company’s credit rating associated with an acquisition could adversely affect our ability to borrow and result in more restrictive borrowing terms. In addition, the Company’s effective tax rate on an ongoing basis is uncertain, and extraordinary transactions could impact our effective tax rate. We also may experience risks relating to the challenges and costs of closing an extraordinary transaction and the risk that an announced extraordinary transaction may not close. As a result, any completed, pending or future transactions may contribute to financial results that differ from the investment community’s expectations in a given quarter.
Guaranteeing Performance by Others including Third Parties and Others
From time to time, the Company may be required or determine it is advisable to guarantee performance of loan agreements by others in which the Company maintains a financial interest. In such instances, if the primary obligor is unable to perform its obligations, the Company might be forced to perform the primary obligor’s obligations which could negatively impact the Company’s financial interests.
Economic and Political Instability; Terrorist Acts; War and Other Political Unrest
The U.S. military action in Iraq and Afghanistan, the terrorist attacks that took place in the United States on September 11, 2001, the potential for additional future terrorist acts and other recent events, including terrorist related activities and civil unrest in Egypt, Yemen, Libya, Bahrain and various other middle eastern countries have caused uncertainty in the world’s financial markets and have significantly increased global political, economic and social instability, including in Saudi Arabia, a country in which we have a substantial investment. It is possible that further acts of terrorism may be directed against the United States domestically or abroad, and such acts of terrorism could be directed against our investment in those locations. Such economic and political uncertainties may materially and adversely affect our business, financial condition or results of operations in ways that cannot be predicted at this time. Although it is impossible to predict the occurrences or consequences of any such events, they could result in a decrease in demand for
our products, make it difficult or impossible to deliver products to our customers or to receive components from our suppliers, create delays and inefficiencies in our supply chain and result in the need to impose employee travel restrictions. We are predominantly uninsured for losses and interruptions caused by terrorist acts, conflicts and wars. Our future revenue, gross margin, expenses and financial condition also could suffer due to a variety of international factors, including:
|
•
|
Ongoing instability or changes in a country’s or region’s economic or political conditions, including inflation, recession, interest rate fluctuations and actual or anticipated military or political conflicts;
|
|
•
|
Longer accounts receivable cycles and financial instability among customers;
|
|
•
|
Trade regulations and procedures and actions affecting production, pricing and marketing of products;
|
|
•
|
Local labor conditions and regulations;
|
|
•
|
Geographically dispersed workforce;
|
|
•
|
Changes in the regulatory or legal environment;
|
|
•
|
Differing technology standards or customer requirements;
|
|
•
|
Import, export or other business licensing requirements or requirements relating to making foreign direct investments, which could affect our ability to obtain favorable terms for labor and raw materials or lead to penalties or restrictions;
|
|
•
|
Difficulties associated with repatriating cash generated or held abroad in a tax-efficient manner and changes in tax laws; and
|
|
•
|
Fluctuations in freight costs and disruptions in the transportation and shipping infrastructure at important geographic points of exit and entry for our products and shipments.
|
Currency fluctuations
Currency variations also contribute to fluctuations in sales of products and services in impacted jurisdictions. In addition, currency variations can adversely affect margins on sales of our products in countries outside of the United States.
Business disruption
Business disruptions could harm the Company’s future revenue and financial condition and increase our costs and expenses. Our operations could be subject to earthquakes, power shortages, telecommunications failures, water shortages, tsunamis, floods, hurricanes, typhoons, fires, extreme weather conditions, medical epidemics and other natural or manmade disasters or business interruptions, for some of which we may be self-insured. The occurrence of any of these business disruptions could harm our revenue and financial condition and increase our costs and expenses.
Lack of mining management expertise
We are depending upon AMAK’s management and Board to employ various respected engineering and financial advisors to assist in the development and evaluation of the mining projects in Saudi Arabia. During 2010 AMAK utilized the services Behre Dolbear of London, England and SRK of Australia for ongoing guidance regarding construction, turn over and eventual operation of the ore-processing and underground facilities, and other items to ensure success of the project. The amount of risk will ultimately depend upon the AMAK’s ability to use consultants and experienced personnel to manage the operation in Saudi Arabia.
Inability to significantly influence AMAK activities
We do not have the ability to significantly influence AMAK activities for a number of reasons including disputed terms of organizational documents which diluted our ownership percentage, inability to persuade the remaining board members regarding certain management decisions, lack of control at the board of director level, cultural differences,
differing accounting and management practices, differing governmental laws and regulations, and the fact that the AMAK mining project is halfway around the world from the Company’s main base of operations in the United States.
Inability to recoup investment in AMAK
The Company will only recover its investment in AMAK through either the receipt of dividends from AMAK or the sale of part or all of its interest in AMAK. There is a risk that we will be unable to recover our investment in AMAK if AMAK is not profitable, or if AMAK’s Board of Directors chooses not to declare dividends even if AMAK is profitable. However, since the Company has no significant influence over AMAK’s Board of Directors, the amount and timing of the dividends we receive from AMAK will be controlled by the other investors in AMAK. With respect to the sale of part or all of our interest in AMAK, under Saudi law, AMAK must sell a portion of its equity to the public once AMAK has been profitable for two years. While the proceeds of such a sale might allow the Company to recover its investment in AMAK, there is no assurance that AMAK will achieve the profitability required for such a public sale, or that the market conditions for any such public sale will be favorable enough to allow us to recover our investment.
AMAK’s inability to obtain sufficient funding
In the event AMAK is unable to continue to borrow funds in an amount sufficient to complete and pay for the remaining portions of construction, AMAK may be forced to take other less desirable methods to raise necessary capital such as selling additional equity in AMAK at a possible discount, construction could come to a halt and the newly constructed assets could sit unused and deteriorate over time, or worst case the AMAK shareholders could lose their investment or be forced to sell for a significant loss.
AMAK’s inability to obtain additional mining leases
In the event AMAK is unable obtain additional mining leases, there would be a loss of future opportunities but the effect on our current investment is not expected to be a significant.
Cancellation of the current mining lease held by AMAK
In the event that the Saudi Ministry cancels the current lease, AMAK shareholders including the Company could lose their investment or be forced to sell for a loss.
Intense competition
The Company competes in the petrochemical industry. Accordingly, we are subject to intense competition among a large number of companies, both larger and smaller than us, many of which have financial capability, facilities, personnel and other resources greater than us. In the specialty products and solvents markets, the Petrochemical Company has one principal competitor in North America, ConocoPhillips. Multiple competitors exist when searching for new business in other parts of the world. We compete primarily on the basis of performance, price, quality, reliability, reputation, distribution, service, and account relationships. If our products, services, support and cost structure do not enable us to compete successfully based on any of those criteria, our operations, results and prospects could be harmed. The Company has a portfolio of businesses and must allocate resources across these businesses while competing with companies that specialize in one or more of these product lines. As a result, we may invest less in certain areas of our businesses than competitors do, and these competitors may have greater financial, technical and marketing resources available to them than our businesses that compete against them. Industry consolidation may also affect competition by creating larger, more homogeneous and potentially stronger competitors in the markets in which we compete, and competitors also may affect our business by entering into exclusive arrangements with existing or potential customers or suppliers. We may have to continue to lower the prices of many of our products and services to stay competitive, while at the same time, trying to maintain or improve revenue and gross margin.
Research and Development
If the Company cannot continue to develop, manufacture and market products and services that meet customer requirements, its revenue and gross margin may suffer. We must make long-term investments and commit significant resources before knowing whether our predictions will accurately reflect customer demand for products and services. After we develop a product, we must be able to manufacture appropriate volumes quickly and at competitive costs. In the course of conducting business, the Company must adequately address quality issues associated with our products and
services. In order to address quality issues, we work extensively with our customers and suppliers to determine the cause of the problem and to determine appropriate solutions. However, we may have limited ability to control quality issues. If the Company is unable to determine the cause or find an appropriate solution, it may delay shipment to customers, which would delay revenue recognition and could adversely affect our revenue and reported results. Finding solutions to quality issues can be expensive, adversely affecting our profits. If new or existing customers have difficulty utilizing our products, our operating margins could be adversely affected, and we could face possible claims if we fail to meet customers’ expectations. In addition, quality issues can impair the Company’s relationships with new or existing customers and adversely affect its reputation, which could have a material adverse effect on operating results.
Not Applicable
South Hampton owns and operates a specialty petrochemical facility near Silsbee, Texas which is approximately 30 miles north of Beaumont, Texas, and 90 miles east of Houston. The facility consists of six operating units which, while interconnected, make distinct products through differing processes: (i) a Penhex Unit; (ii) a Reformer; (iii) a Cyclo-pentane Unit; (iv) an Aromax® Unit; (v) an Aromatics Hydrogenation Unit; and (vi) a White Oil Fractionation Unit. All of these units are currently in operation.
During 2010 we acquired Silsbee Trading and Transportation Company which owns and operates 14 transport trucks and 23 trailers for delivery of South Hampton’s products.
Gulf State owns and operates three (3) 8-inch diameter pipelines aggregating approximately 50 miles in length connecting South Hampton’s facility to: (1) a natural gas line, (2) South Hampton’s truck and rail loading terminal and (3) a major petroleum products pipeline system owned by an unaffiliated third party. All pipelines are operated within Texas Railroad Commission and DOT regulations for maintenance and integrity.
The Company’s only mineral interest in the United States is its ownership interest in PEVM. See Item 1 – Business – United States Mineral Interests.
The Company had a year-to-year lease on space in an office building in Jeddah, Saudi Arabia, used for office occupancy and a house in Jeddah that is used as a technical office and for staff housing. Both were terminated in 2010.
South Hampton has a corporate and sales office in Sugar Land, Texas and a sales office in Madrid, Spain. Both properties are leased.
In August of 1997, the Executive Director of the Texas Commission on Environmental Quality (TCEQ), filed a preliminary report and petition with the TCEQ alleging that South Hampton violated various TCEQ rules, TCEQ permits issued to South Hampton, a TCEQ order issued to South Hampton, the Texas Water Code, Texas Clean Air Act and Texas Solid Waste Disposal Act. The violations generally relate to the management of volatile organic compounds in a manner that allegedly violates the TCEQ air quality rules and the storage, processing and disposal of hazardous waste in a manner that allegedly violates the TCEQ industrial and hazardous waste rules. In March 2008 we reached a tentative agreement with TCEQ for a settlement of $274,433. The agreement was approved by the TCEQ governing body of Commissioners in the third quarter of 2008. Payments were initiated immediately upon approval by the Commissioners, and the final payment was made in December 2008. Approximately one half of the settlement amount was paid into a state operated fund for local environmental improvement projects and was applied to connect low income families to sewer facilities in Hardin County, Texas. South Hampton has no additional liability related to these environmental issues at December 31, 2010, or 2009.
On May 9, 2010, after numerous attempts to resolve certain issues with Mr. Hatem El Khalidi, the Board of Directors terminated the retirement agreement, options, retirement bonuses, and all outstanding directors’ fees due to Mr. El Khalidi, former CEO, President and Director of the Company. In late 2010, the Company filed suit against Mr. El Khalidi in the United States District Court in the Eastern District of Texas, Beaumont Division, seeking declaratory
judgment that all monies allegedly owed to Mr. El Khalidi are terminated. These benefits and options will remain recorded on the Company’s books until the lawsuits are resolved.
On September 14, 2010, the Company received notice of a lawsuit filed in the 58th Judicial Court of Jefferson County, Texas which was subsequently transferred to the 11th Judicial Court of Harris County, Texas. The suit alleges that the plaintiff became ill from exposure to asbestos. There are approximately 44 defendants named in the suit. On October 18, 2010, the Company received notice of another lawsuit filed in the 136th Judicial Court of Jefferson County, Texas. The suit alleges that the plaintiff became ill from benzene exposure during his employment from 1970 to 2008 with Goodyear Tire and Rubber Company, a customer of South Hampton. There are approximately 7 defendants named in the suit. The Company has placed its insurers on notice of the claims.
The Company’s common stock trades on the NASDAQ Stock Market LLC during the last two fiscal years under the symbol: ARSD. The following table sets forth the high and low bid prices for each quarter as reported by NASDAQ. The quotations reflect inter-dealer prices, without retail mark-up, mark-down or commission and may not represent actual transactions.
| |
|
NASDAQ
|
|
| |
|
High
|
|
|
Low
|
|
|
Fiscal Year Ended December 31, 2010
|
|
|
|
|
|
|
|
First Quarter ended March 31, 2010
|
|
$ |
3.15 |
|
|
$ |
2.14 |
|
|
Second Quarter ended June 30, 2010
|
|
$ |
3.30 |
|
|
$ |
1.99 |
|
|
Third Quarter ended September 30, 2010
|
|
$ |
2.60 |
|
|
$ |
1.63 |
|
|
Fourth Quarter ended December 31, 2010
|
|
$ |
4.53 |
|
|
$ |
2.20 |
|
| |
|
|
|
|
|
|
|
|
|
Fiscal Year Ended December 31, 2009
|
|
|
|
|
First Quarter ended March 31, 2009
|
|
$ |
1.99 |
|
|
$ |
0.60 |
|
|
Second Quarter ended June 30, 2009
|
|
$ |
3.64 |
|
|
$ |
1.21 |
|
|
Third Quarter ended September 30, 2009
|
|
$ |
3.97 |
|
|
$ |
2.68 |
|
|
Fourth Quarter ended December 31, 2009
|
|
$ |
3.45 |
|
|
$ |
2.06 |
|
| |
|
|
|
|
|
|
|
|
At March 10, 2011, there were approximately 606 recorded holders (including brokers’ accounts) of the Company’s common stock. The Company has not paid any dividends since its inception and, at this time, does not have any plans to pay dividends in the foreseeable future. The current lender allows the petrochemical subsidiaries to pay dividends to the parent company of up to 30% of EBITDA. The Petrochemical Company was in compliance with this restriction as of December 31, 2010. See Note 10 to the Consolidated Financial Statements.
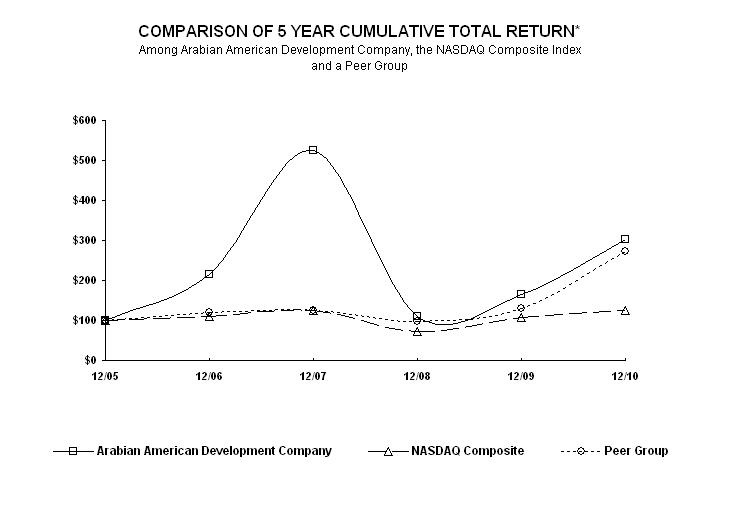
Total Stockholder Return
The following graph compares the cumulative total stockholder return on our common stock against the NASDAQ Composite Index and Quaker Chemical Corporation ("the Peer Group"), for the five years ending December 31, 2010. The graph was constructed on the assumption that $100 was invested in our common stock, the NASDAQ Composite Index and the Peer Group on December 31, 2005, and that any dividends were fully reinvested.
*100 invested on 12/31/05 in stock or index, including reinvestment of dividends.
Fiscal year ending December 31.
The following is a five-year summary of selected financial data of the Company (in thousands, except per share amounts):
| |
|
|
|
|
|
|
|
|
|
|
|
|
|
|
|
|
Revenues
|
|
$ |
139,110 |
|
|
$ |
117,587 |
|
|
$ |
154,630 |
|
|
$ |
108,638 |
|
|
$ |
98,502 |
|
|
Net Income (Loss)
|
|
$ |
2,686 |
|
|
$ |
6,627 |
|
|
$ |
(10,731 |
) |
|
$ |
7,771 |
|
|
$ |
7,875 |
|
|
Net Income (Loss) Per Share-Diluted
|
|
$ |
0.11 |
|
|
$ |
0.28 |
|
|
$ |
(0. 46 |
) |
|
$ |
0.33 |
|
|
$ |
0.34 |
|
|
Total Assets (at December 31)
|
|
$ |
92,528 |
|
|
$ |
90,487 |
|
|
$ |
96,290 |
|
|
$ |
84,221 |
|
|
$ |
71,590 |
|
|
Notes Payable (at December 31)
|
|
$ |
12 |
|
|
$ |
12 |
|
|
$ |
12 |
|
|
$ |
11,012 |
|
|
$ |
11,013 |
|
|
Current Portion of Long-Term Debt (at December 31)
|
|
$ |
1,865 |
|
|
$ |
1,400 |
|
|
$ |
4,920 |
|
|
$ |
31 |
|
|
$ |
489 |
|
|
Total Long-Term Debt Obligations
(at December 31)
|
|
$ |
20,836 |
|
|
$ |
23,439 |
|
|
$ |
23,557 |
|
|
$ |
9,078 |
|
|
$ |
5,108 |
|
Statements in Items 7 and 7A, as well as elsewhere in or incorporated by reference in, this Annual Report on Form 10-K regarding the Company’s financial position, business strategy and plans and objectives of the Company’s management for future operations and other statements that are not historical facts, are “forward-looking statements” as that term is defined under applicable Federal securities laws. In some cases, “forward-looking statements” can be identified by
terminology such as “may,” “will,” “should,” “expects,” “plans,” “anticipates,” “contemplates,” “proposes,” “believes,” “estimates,” “predicts,” “potential” or “continue” or the negative of such terms and other comparable terminology. Forward-looking statements are subject to risks, uncertainties and other factors that could cause actual results to differ materially from those expressed or implied by such statements. Such risks, uncertainties and factors include, but are not limited to, general economic conditions domestically and internationally; insufficient cash flows from operating activities; difficulties in obtaining financing; outstanding debt and other financial and legal obligations; lawsuits; competition; industry cycles; feedstock, specialty petrochemical product and mineral prices; feedstock availability; technological developments; regulatory changes; environmental matters; foreign government instability; foreign legal and political concepts; and foreign currency fluctuations, as well as other risks detailed in the Company’s filings with the U.S. Securities and Exchange Commission, including this Annual Report on Form 10-K, all of which are difficult to predict and many of which are beyond the Company’s control.
The following discussion and analysis of the Company’s financial results, as well as the accompanying consolidated financial statements and related notes to consolidated financial statements to which they refer, are the responsibility of the management of the Company.
Petrochemical Operations
Worldwide petrochemical demand continued to be weak during 2010 due to the soft economy. However, we believe that South Hampton benefitted from continued operational excellence and competitive advantages achieved through its business mix and focus on producing high quality products and outstanding customer service.
In the first quarter of 2010 feedstock prices continued to rise, however in mid-May feedstock prices decreased approximately 20% resulting in a proportionate increase in margins going forward until prices began to rise again in the fourth quarter. The full effect of the lower feedstock prices was not realized immediately as the higher prices took some time to work through inventories and materials within the system. This continued volatility in the market makes it difficult for the Company to plan and forecast its product prices. The Company may be able to mitigate some of this uncertainty through the use of derivative contracts to hedge against changes in feedstock prices. As of the end of 2010, approximately 30 percent of our anticipated feedstock needs for the coming three months were covered by derivative contracts.
In addition, the Company has adopted a strategy of moving its larger volume customers to formula based pricing to reduce the effect of feedstock cost volatility. Under formula pricing the price charged to the customer is based on a formula which includes as a component the average cost of feedstock over the prior month. As a result, with this pricing mechanism, product prices move in conjunction with feedstock prices without the necessity of announced price changes. However, because the formulas use an average feedstock price from the prior month, the movement of prices will trail the movement of costs, and formula prices may or may not reflect our actual feedstock cost for the month during which the product is actually sold. In addition, while formula pricing can benefit product margins during periods of increasing feedstock costs, during periods of decreasing feedstock costs formula pricing may cause the Company to lose the ability to maintain product pricing and retain higher margins. The Company believes that the use of formula pricing can reduce the volatility and increase the predictability of product margins. However, the Company continues to investigate alternative product pricing methods.
In October 2010 the Company completed the construction of a small Isomerization unit which will allow for greater flexibility in the selection of product production and provide the ability to convert a product which is less in demand, into one which is in greater demand.
Sources and Uses of Cash
Cash and cash equivalents increased by $5.16 million during the year ended December 31, 2010. The change in cash and cash equivalents is summarized as follows:
| |
|
2010
|
|
|
2009
|
|
|
2008
|
|
|
Net cash provided by (used in)
|
|
(in thousands)
|
|
|
Operating activities
|
|
$ |
11,330 |
|
|
$ |
6,515 |
|
|
$ |
(5,979 |
) |
|
Investing activities
|
|
|
(3,149 |
) |
|
|
(3,184 |
) |
|
|
(15,421 |
) |
|
Financing activities
|
|
|
(3,023 |
) |
|
|
(3,638 |
) |
|
|
19,369 |
|
|
Increase (decrease) in cash and equivalents
|
|
$ |
5,158 |
|
|
$ |
(307 |
) |
|
$ |
(2,031 |
) |
|
Cash and cash equivalents
|
|
$ |
7,610 |
|
|
$ |
2,452 |
|
|
$ |
2,759 |
|
Operating Activities
Operating activities generated cash of approximately $11,330,000 during fiscal 2010 as compared with cash provided of approximately $6,515,000 during fiscal 2009. Although the Company’s net income decreased by $3,942,000 from 2009 to 2010, the cash provided by operations increased by 73.9% due primarily to the following factors:
|
•
|
Net income for 2009 included a non-cash deferred tax benefit of $8,977,000 in 2010 as compared to 2010 which included a non-cash deferred tax benefit of $685,000, a change of $8,292,000;
|
|
•
|
Trade receivables decreased approximately $1,062,000 (due to decreased sales volume in the fourth quarter) as compared to an increase of $510,000 in 2009;
|
|
•
|
In 2010 the Company received an income tax refund of $4,510,000 which had been recognized as a non-cash credit (increase in tax receivable) in 2009;
|
|
•
|
As the result of changes in demand and production the increase in inventory was approximately $852,000 in 2010 as compared to an increase of about $2,619,000 in 2009;
|
|
•
|
Accounts payable and accrued liabilities decreased approximately $504,000 (due to a decrease in the amount owed for federal income tax) while in 2009 the same accounts decreased by about $2,146,000 (due to the payment of derivative related items);
|
|
·
|
Net income for 2010 included non-cash compensation charges of $808,000 as compared to $280,000 in 2009, a change of $528,000
|
These sources of increased operating cash flow were partially offset by the following increases in the use of cash for operations:
|
•
|
No cash flows were derived from the return of derivative instrument deposits in 2010 while in 2009 cash of $3,950,000 was provided from the return of a previous margin call;
|
|
•
|
2009 included a non-cash unrealized gain on derivative instruments of $6,976,000 as compared to a non-cash unrealized gain of $177,000 in 2010, a change of $6,699,000;
|
|
•
|
Accrued liabilities in Saudi Arabia decreased approximately $207,000 (due to the payment of amounts owed for termination benefits to Saudi employees) as compared to a decrease of $935,000 (due to the payment of amounts owed to the previous President of the Company and termination of some of the Saudi employees) in 2009.
|
Operating activities generated cash of approximately $6,515,000 during fiscal 2009 as compared with cash used of approximately $5,979,000 during fiscal 2008. The Company’s net income for fiscal 2009 increased by approximately $17,359,000 or 162.8% in 2009 as compared to the corresponding period of 2008 due primarily to the following factors:
|
•
|
Net income for 2008 included a non-cash deferred tax charge of $5,528,000 as compared to 2009 which included a non-cash deferred tax benefit of $8,977,000, a change of $14,505,000;
|
|
•
|
Other liabilities increased $773,000 (due to funds received from outside parties for capital projects), as compared to no change in 2008;
|
|
•
|
Notes receivable decreased about $582,000 as compared to a decrease of $711,000 in 2008 (due to notes receivable being paid down in 2009);
|
|
|
Derivative instrument deposits decreased $3,950,000 (due to return of previous margin call deposits), as compared to an increase of $3,950,000 (due to the payment of margin calls) in 2008;
|
These sources of increased operating cash flow were partially offset by the following increases in the use of cash for operations:
|
•
|
Trade receivables increased approximately $510,000 (due to additional foreign sales with longer payment terms) as compared to an increase of only $58,000 in 2008;
|
|
•
|
Income tax receivable increased by about $4,297,000 (due to carry-back of the current year taxable loss) as compared to a decrease of $641,000 in 2008;
|
|
•
|
Inventory increased approximately $2,619,000 (due to increased volume and prices) as compared to a decrease of about $441,000 (due to decreased prices but increased volumes) in 2008;
|
|
•
|
Accounts payable and accrued liabilities decreased approximately $2,146,000 (due to the payment of derivative related items) while in 2008 the same accounts increased by about $2,750,000 (due to outstanding derivative related items);
|
|
|
Accrued liabilities in Saudi Arabia decreased approximately $958,000 (due to the payment of amounts owed to the previous President of the Company and termination of some of the Saudi employees) while in 2008 there was a increase of about $22,000.
|
Investing Activities
Cash used for investing activities during fiscal 2010 was approximately $3,149,000, representing a decrease of approximately $35,000 over the corresponding period of 2009. Capital expenditures decreased approximately 9.0% from 2009 to 2010. During 2010 approximately $1.8 million was expended for the construction of an isomerization and hexane treater unit. This expenditure will allow us greater flexibility in our product mix as the isomerization unit allows the conversion of normal pentane into isopentane. Capital expenditures decreased significantly from 2008 to 2009 due to the completion in 2008 of the expansion project. Calendar year 2009 reflects a “return to normal” amount of expenditures. The hexane treater unit was the final phase of the 2008 expansion.
Approximately $250,000 in cash was used for the merger of South Hampton with STTC. See Note 1 to the Consolidated Financial Statements.
Cash used for investing activities during fiscal 2009 was approximately $3,184,000, representing a decrease of approximately $12,237,000 over the corresponding period of 2008. The Company made a conscious decision in 2009 to limit cash used for capital purchases. During 2008 approximately $12.0 million was spent for additions to Property, Pipeline and Equipment related to the Penhex Expansion project with another $1.1 million being expended for the construction of additional office space.
Financing Activities
Cash used in financing activities during fiscal 2010 decreased approximately $615,000 compared to the corresponding period of 2009. We made principal payments on long-term debt during 2010 of $3,000,000 on our line of credit and $1,420,000 on term loans. Additions to long term debt of $1.4 million were from a $1.0 million draw on the line of credit and the signing of a note for approximately $397,000 relating to the purchase of additional transportation equipment.
Cash used in financing activities during fiscal 2009 was approximately $3,638,000 versus cash provided by financing activities of approximately $19,369,000 during the corresponding period of 2008. The Company made net principal payments on long-term debt during 2009 of $2,000,000 on the Company’s line of credit and $1,638,000 on the term loan. In 2008 net additions to long term debt of $19.4 million were from an $8.4 million draw on the line of credit and an $11.0 million draw on the term loan.
Credit Agreement
On May 25, 2006, South Hampton entered into a Credit Agreement, as amended, with Bank of America. We were in compliance with all of our financial covenants as of December 31, 2010, under the Credit Agreement. All of our obligations under the Credit Agreement are fully and unconditionally secured pursuant to a perfected first priority security interest on all of South Hampton’s assets. As of December 31, 2010, the Credit Agreement provided for an aggregate principal amount of up to $32 million available through the following facilities: (i) $18 million revolving credit facility which includes a $3 million sublimit for use in the hedging program and a sublimit of $9 million for the issuance of standby or commercial letters of credit; and (ii) $14 million term loan (advanced as a $10 million loan and a $4 million loan) obtained in 2007 to finance the expansion of South Hampton’s petrochemical facility. The revolving credit facility matures on June 30, 2012, and the term loan matures on October 31, 2018.
Under the terms of the Credit Agreement, accrued and unpaid interest is due and payable in arrears on the first business day of each month on any outstanding borrowings at the lower of: (i) the higher of the federal funds rate plus 0.50% or the prime rate plus applicable margin, or (ii) the rate equal to the British Bankers Association LIBOR plus the applicable margin. The applicable margin is determined from TOCCO’s most recent compliance certificate and current financials based on the following:
|
Level
|
Leverage Ratio
|
Applicable Margin for Base Rate Loans
|
Applicable Margin for LIBOR Loans
|
Applicable Margin for Commitment Fee
|
|
I
|
Greater than or equal to 1.5:1.0
|
(0.50%)
|
2.00%
|
0.25%
|
|
II
|
Less than 1.5:1.0 but greater than or equal to 1.0:1.0
|
(0.75%)
|
1.75%
|
0.25%
|
|
III
|
Less than 1.0:1.0
|
(1.00%)
|
1.50%
|
0.25%
|
In March 2008 we entered into a pay-fixed, receive-variable interest rate swap agreement with respect to the $10.0 million floating rate term loan under the credit facility. The notional amount of the interest rate swap was $7,750,000 at December 31, 2010. The Company receives credit for payments of variable rate interest made on the term loan at the loan’s variable rates which are based upon the London InterBank Offered Rate (LIBOR), and pays Bank of America an interest rate of 5.83% less the credit on the interest rate swap. The swap agreement terminates on December 15, 2017. We designated the interest rate swap agreement as a cash flow hedge according to ASC Topic 815, Derivatives and Hedging. The derivative instrument is reported at fair value with any changes in fair value reported within other comprehensive income (Loss) in our Statement of Stockholders’ Equity. At December 31, 2010, Accumulated Other Comprehensive Loss net of $379,515 tax was $736,706 related to this transaction.
Our average floating interest rate on debt outstanding under our credit facility at December 31, 2010, was 2.75%. The Credit Agreement includes customary representations and warranties made by us to Bank of America.
The Credit Agreement contains customary, affirmative and negative covenants requiring us to take certain actions and restricting us from taking others. Such covenants include but are not limited to (i) restrictions on certain payments, including dividends, (ii) the use of the loan proceeds only for certain purposes, and (iii) limitations on the occurrence of liens, certain investments, and/or subsidiary indebtedness (subject to certain exceptions).
In addition the Credit Agreement contains certain financial covenants, which include but are not limited to:
|
●
|
Maintaining a minimum EBITDA of $8.5 million at end of each trailing four fiscal quarter period;
|
| |
|
|
●
|
Maintaining a maximum leverage ratio of 2.0:1.0 measured at end of each fiscal quarter;
|
| |
|
|
●
|
Prohibition of unfinanced capital expenditures in excess of $4.0 million for trailing four fiscal quarter period; and
|
| |
|
|
●
|
Limitations on dividends paid to the parent company of 30% of EDITDA.
|
The Credit Agreement contains standard default triggers, which include but are not limited to (i) default on certain of our other indebtedness, (ii) the entry of certain judgments against South Hampton and its subsidiaries, and (iii) a change in the control of the Company. Upon the occurrence of any event of default Bank of America may take certain actions including declaring any outstanding amount due and payable.
On November 30, 2010, due to the merger of South Hampton and STTC, various notes were assumed during the transaction. The agreements were with JPMorgan Chase Bank, NA and were originally created for the purchase of transportation equipment. The aggregate amount of the notes at December 31, 2010, was approximately $563,000. Interest rates vary from approximately 6.6% to 10% with remaining lives of between 18 and 40 months. Interest and principal are payable monthly.
On November 30, 2010, as part of the consideration for the acquisition of STTC, South Hampton issued a $300,000 note to Nicholas N. Carter, our President and CEO, with a 3 year term bearing interest at 4.0% per annum. Principal and interest are payable annually on November 30th of each year.
On December 7, 2010, STTC entered into a loan agreement with JPMorgan Chase Bank, NA for approximately $397,000 for the purchase of transportation equipment. The loan bears an interest rate of 4.0% per annum and matures on December 7, 2014. Principal and interest are paid monthly.
Comparison of Years 2010, 2009, 2008
The discussion of the business uses the tables below for purposes of illustration and discussion. The reader should rely on the Audited Financial Statements attached to this report for financial analysis under United States generally accepted accounting principles.
| |
|
|
|
|
|
|
|
|
|
|
|
|
| |
|
(in thousands)
|
|
|
|
|
|
Petrochemical Product Sales
|
|
$ |
133,579 |
|
|
$ |
109,179 |
|
|
$ |
24,400 |
|
|
|
22.3 |
% |
|
Transloading Sales
|
|
|
854 |
|
|
|
4,625 |
|
|
|
(3,771 |
) |
|
|
(81.5 |
%) |
|
Processing
|
|
|
4,677 |
|
|
|
3,783 |
|
|
|
894 |
|
|
|
23.6 |
% |
|
Gross Revenue
|
|
$ |
139,110 |
|
|
$ |
117,587 |
|
|
$ |
21,523 |
|
|
|
18.3 |
% |
| |
|
|
|
|
|
|
|
|
|
|
|
|
|
|
|
|
|
Volume of sales (thousand gallons)
|
|
|
46,721 |
|
|
|
49,909 |
|
|
|
(3,188 |
) |
|
|
(6.4 |
%) |
| |
|
|
|
|
|
|
|
|
|
|
|
|
|
|
|
|
|
Cost of Materials
|
|
$ |
93,298 |
|
|
$ |
69,474 |
|
|
$ |
23,824 |
|
|
|
34.3 |
% |
|
Petrochemical Facility Operating Expense
|
|
|
28,597 |
|
|
|
26,214 |
|
|
|
2,383 |
|
|
|
9.1 |
% |
|
Natural Gas Expense*
|
|
|
4,991 |
|
|
|
4,572 |
|
|
|
419 |
|
|
|
9.2 |
% |
|
General & Administrative Expense
|
|
|
10,930 |
|
|
|
9,145 |
|
|
|
1,785 |
|
|
|
19.5 |
% |
| |
|
|
|
|
|
|
|
|
|
|
|
|
|
|
|
|
|
Capital Expenditures
|
|
$ |
2,899 |
|
|
$ |
3,184 |
|
|
$ |
(285 |
) |
|
|
(9.0 |
%) |
| |
|
|
|
|
|
|
|
|
|
|
|
|
| |
|
(in thousands)
|
|
|
|
|
|
Petrochemical Product Sales
|
|
$ |
109,179 |
|
|
$ |
130,264 |
|
|
$ |
(21,085 |
) |
|
|
(16.2 |
%) |
|
Transloading Sales
|
|
|
4,625 |
|
|
|
20,239 |
|
|
|
(15,614 |
) |
|
|
(77.1 |
%) |
|
Processing
|
|
|
3,783 |
|
|
|
4,127 |
|
|
|
(344 |
) |
|
|
( 8.3 |
%) |
|
Gross Revenue
|
|
$ |
117,587 |
|
|
$ |
154,630 |
|
|
$ |
(37,043 |
) |
|
|
(24.0 |
%) |
| |
|
|
|
|
|
|
|
|
|
|
|
|
|
|
|
|
|
Volume of sales (thousand gallons)
|
|
|
49,909 |
|
|
|
46,311 |
|
|
|
3,598 |
|
|
|
7.8 |
% |
| |
|
|
|
|
|
|
|
|
|
|
|
|
|
|
|
|
|
Cost of Materials
|
|
$ |
69,474 |
|
|
$ |
131,665 |
|
|
$ |
(62,191 |
) |
|
|
(47.2 |
%) |
|
Petrochemical Facility Operating Expense
|
|
|
26,214 |
|
|
|
27,562 |
|
|
|
(1,348 |
) |
|
|
( 4.9 |
%) |
|
Natural Gas Expense*
|
|
|
4,572 |
|
|
|
7,310 |
|
|
|
(2,738 |
) |
|
|
(37.5 |
%) |
|
General & Administrative Expense
|
|
|
9,145 |
|
|
|
9,034 |
|
|
|
111 |
|
|
|
1.2 |
% |
| |
|
|
|
|
|
|
|
|
|
|
|
|
|
|
|
|
|
Capital Expenditures
|
|
$ |
3,184 |
|
|
$ |
15,031 |
|
|
$ |
(11,847 |
) |
|
|
(78.8 |
%) |
*Natural gas expense is included in operating expense as shown on the face of the Consolidated Financial Statements
Revenues
2009-2010
Revenues increased from 2009 to 2010 by approximately 18.3% primarily due to increases in selling prices of approximately 22.3% offset by the expiration of the transloading contract in April 2009. Total sales volume decreased approximately 6.4% due to expiration of the transloading contract; however, petrochemical product sales volume remained steady.
Processing revenues increased from 2009 to 2010 primarily due to one of our toll customers running above take or pay minimum during 2010. The Petrochemical Company remains dedicated to maintaining a certain level of toll processing business in the facility and continues to pursue opportunities.
2008-2009
Revenues decreased from 2008 to 2009 by approximately 24.0% primarily due to reductions in selling prices of approximately 29.0% and expiration of the transloading contract in April 2009. However, sales volume increased approximately 7.8% indicating strong demand for products and additional market share being garnered by the Petrochemical Company as allowed by the increase in production capacity.
Processing revenues decreased from 2008 to 2009 primarily due to economic conditions dictating that tolling customers ran at minimum capacities as allowed by their take or pay minimum contract.
Cost of Materials
2009-2010
Cost of Materials increased from 2009 to 2010 due to higher feedstock prices which increased an average of 38.9%. The Petrochemical Company uses natural gasoline as feedstock which is the heavier liquid remaining after butane and propane are removed from liquids produced by natural gas wells. The material is a commodity product in the oil/petrochemical markets.. Alternative uses are in motor gasoline blending, ethanol denaturing, and as a feedstock in other petrochemical processes, including ethylene crackers. The price of natural gasoline historically has an 88% correlation to the price of crude oil although after the 2008 drop in the crude market, the price is more closely aligned with unleaded gasoline price movements. The price of feedstock generally does not carry the day to day volatility of crude oil simply because the market is made by commercial users and there is not the participation of non-commercial speculators as is true with the commodities traded on the public exchanges. The cost of materials in 2010 was reduced by $205,000 for the net recognized and unrecognized gains the company recorded on feedstock and natural gas contracts the Company purchased to hedge against changes in commodity prices. The Cost of Materials in 2009 was reduced by $1,120,000 of net recognized and unrecognized gains the company recorded on feedstock and natural gas contracts the Company purchased to hedge against changes in commodity prices. See Note 20 of Notes to the Consolidated Financial Statements.
2008-2009
Cost of Materials decreased from 2008 to 2009 due to lower feedstock prices and gains on derivative transactions. The Cost of Materials in 2009 was reduced by $1,120,000 of net recognized and unrecognized gains the company recorded on feedstock, crude and natural gas contracts the Company purchased to hedge against changes in commodity prices The Cost of Feedstock in 2008 included $19,195,000 of net recognized and unrecognized losses the company recorded on feedstock, crude and natural gas contracts.
Petrochemical Operating and Natural Gas Expense
2009-2010
Total Operating Expense for the Petrochemical Company increased from 2009 to 2010. Natural gas, labor and transportation costs are the largest individual expenses in this category. The cost of natural gas purchased increased 11.4% from 2009 to 2010 due to higher per-unit costs. The average price per MMBTU for 2009 was $4.07; whereas, for 2010 the per-unit cost was $4.73. Volume purchased actually decreased from approximately 1,124,000 MMBTU to
about 1,077,000 MMBTU but was offset by the increase in price. Labor increased slightly by approximately 2.2%. Transportation costs increased 22% due to additional costs involved in shipping products overseas; however, these costs are recovered through our selling price.
2008-2009
Total Operating Expense for the Petrochemical Company decreased from 2008 to 2009. Natural gas and labor are the largest individual expenses in this category. The cost of natural gas purchased decreased 37.5% from 2008 to 2009 due to lower per-unit costs. The average price per MMBTU for 2008 was $8.87; whereas, for 2009 the per-unit cost was $4.07. Volume purchased actually increased from approximately 841,000 MMBTU to about 1,124,000 MMBTU but was offset by the reduction in price. The labor increased because the Company gave a 4% cost of living increase to the total workforce in June 2009. The cost of living increases were determined by sampling local industry and arriving at an average increase. Another cost component that has increased over the past several years is the cost of transportation which is largely passed through to the customer.
General and Administrative Expense
2009-2010
General and Administrative costs from 2009 to 2010 increased 19.5% due to expenses recorded for PEVM environmental issues, administrative payroll costs, insurance premiums, consulting fees, property taxes, directors’ fees, post retirement benefits, and legal fees. Payroll costs increased approximately $392,000 due to the addition of personnel and the 2009 cost of living adjustment being in effect for all of 2010 versus one-half of the 2009 fiscal year. Insurance premiums increased approximately $313,000 largely due to additional property coverage, an increase in health insurance premiums, and the addition of a credit policy. Consulting fees increased about $271,000 due to the employ of a compensation consultant and an energy consultant for hedging purposes. Directors’ fees increased approximately $265,000 due to the newly approved directors’ fees policy. Legal fees also rose approximately $307,000 for the year due to additional assistance provided by outside parties in response to issues with SEC comment letters, affairs in Saudi Arabia, merger and acquisition opportunities and litigation. On the positive side, the adjustment to the allowance for doubtful accounts decreased based upon historical bad debt calculation. Administrative costs in Saudi Arabia also decreased significantly.
2008-2009
General and Administrative costs from 2008 to 2009 increased 1.2% due to higher administrative payroll costs, insurance premiums, directors’ fees, legal fees and travel expense. Payroll costs increased approximately $307,000 due to the addition of personnel and a 4% cost of living adjustment. Insurance premiums increased about $170,000 largely due to additional property coverage and an increase in health insurance premiums. Directors’ fees increased approximately $274,000 due to compensation expensed in 2009 for 2008 service. Legal and consulting fees also rose about $455,000 for the year due to additional assistance provided by outside parties. On the bright side, the adjustment to the allowance for doubtful accounts decreased about $354,000 based upon historical bad debt calculation, officer compensation decreased approximately $206,000, post retirement benefits decreased about $143,000, investor related expenses decreased approximately $93,000 and no additional impairment loss on PEVM was incurred.
Our general and administrative expenses have two principle components; general and administrative expenses for our petrochemical operation and general corporate expenses.
General & Administrative Expenses for our Specialty Petrochemicals Operations
| |
|
|
|
|
|
|
|
|
|
|
|
|
|
Petrochemical Company
|
|
(in thousands)
|
|
|
|
|
|
General & Administrative Expense
|
|
$ |
8,396 |
|
|
$ |
7,200 |
|
|
$ |
1,196 |
|
|
|
16.6 |
% |
General and Administrative costs from 2009 to 2010 increased 16.6% due to increases in administrative payroll, insurance premiums, consulting fees and property taxes. Payroll costs increased approximately $392,000 due to the addition of personnel and the 2009 cost of living adjustment being in effect for all of 2010 versus one-half of the 2009 fiscal year. Insurance premiums increased about $313,000 largely due to additional property coverage, an increase in health insurance premiums, and the addition of a credit policy. Consulting fees increased about $189,000 due to employ
of an energy consultant for hedging purposes. Property taxes increased approximately $103,000 due to a higher taxable base plus a decrease in the amount of the abatement allowed for the plant expansion.
| |
|
|
|
|
|
|
|
|
|
|
|
|
|
Petrochemical Company
|
|
(in thousands)
|
|
|
|
|
|
General & Administrative Expense
|
|
$ |
7,200 |
|
|
$ |
6,636 |
|
|
$ |
564 |
|
|
|
8.5 |
% |
General and Administrative costs from 2008 to 2009 increased 8.5% due to higher administrative payroll costs, insurance premiums and additional travel expense. Payroll costs increased approximately $307,000 due to the addition of personnel and a 4% cost of living adjustment in effect of the second half of 2009. Insurance premiums increased about $170,000 largely due to additional property coverage and an increase in health insurance premiums. Legal and consulting fees also increased approximately $326,000 for the year due to additional services required from these professionals. These increases were partially offset by a decrease of about $354,000 in the provision for doubtful accounts decreased based upon historical bad debt experience.
General Corporate Expenses
|
(in thousands)
|
|
|
|
|
|
|
|
|
|
|
|
|
|
General corporate expenses
|
|
$ |
3,229 |
|
|
$ |
1,945 |
|
|
$ |
1,284 |
|
|
|
66.0 |
% |
General corporate expenses increased from 2009 to 2010 primarily due to increases in officer compensation of $90,000 post retirement benefits of $133,000, directors’ fees of $265,000, travel of $122,000, accounting fees of $149,000, consulting fees of $83,000, legal fees of $381,000 $350,000 due to accrued environmental liability on PEVM and equity in loss of AMAK of $263,000 offset by decreases in Saudi corporate expenses of $489,000.
|
(in thousands)
|
|
|
|
|
|
|
|
|
|
|
|
|
|
General corporate expenses
|
|
$ |
1,945 |
|
|
$ |
2,398 |
|
|
$ |
(453 |
) |
|
|
(18.9 |
%) |
General corporate expenses decreased from 2009 to 2008 primarily due to decreases in officer compensation of $206,000, post retirement benefits of $143,000, investor related expenses of $93,000 and $496,000 due to no additional impairment loss on PEVM offset by increases in directors’ fees of $274,000, Saudi corporate expenses of $95,000 and legal expense of $125,000.
Capital Resources and Requirements
2009-2010
Capital Expenditures decreased approximately 9.0% from 2009 to 2010. During 2010 approximately $1.8 million was expended for the construction of an isomerization and hexane treater unit. This expenditure will allow us greater flexibility in our product mix as the isomerization unit allows the conversion of normal pentane into isopentane. The hexane treater unit was the final phase of the 2008 expansion.
2008-2009
Capital Expenditures decreased significantly from 2008 to 2009 due to the completion in 2008 of the expansion project. Calendar year 2009 reflects a “return to normal” amount of expenditures.
The Company has no capital commitments for 2011; however, capital expenditures typically average $3.0 million per year for facility improvements. At December 31, 2010, there was $2.9 million available on the Company’s line of credit. The Company believes that operating cash flows along with credit availability will be sufficient to finance its 2011 operations.
The table below summarizes the following contractual obligations of the Company:
| |
|
Payments due by period
|
|
|
Contractual Obligations
|
|
Total
|
|
|
Less than
1 year
|
|
|
1-3 years
|
|
|
3-5 years
|
|
|
More than 5 years
|
|
|
Long-Term Debt Obligations
|
|
$ |
22,700,868 |
|
|
$ |
1,864,770 |
|
|
$ |
13,960,722 |
|
|
$ |
2,925,376 |
|
|
$ |
3,950,000 |
|
The anticipated source of funds for payments due within three years that relate to contractual obligations is from a combination of continuing operations and long-term debt refinancing.
Investment in AMAK
See Note 8 of Notes to Consolidated Financial Statements.
In January 2010 the FASB issued ASU No. 2010-06, Fair Value Measurements and Disclosures (Topic 820): Improving Disclosures about Fair Value Measurements. This ASU requires some new disclosures and clarifies some existing disclosure requirements about fair value measurement as set forth in Codification Subtopic 820-10. ASU 2010-06 amends Codification Subtopic 820-10 to now require a reporting entity to disclose separately the amounts of significant transfers in and out of Level 1 and Level 2 fair value measurements and describe the reasons for the transfers; and in the reconciliation for fair value measurements using significant unobservable inputs, a reporting entity should present separately information about purchases, sales, issuances and settlements. In addition, ASU 2010-06 clarifies the disclosures for reporting fair value measurement for each class of assets and liabilities and the valuation techniques and inputs used to measure fair value for both recurring and nonrecurring fair value measurements. ASU 2010-06 is effective for interim and annual reporting periods beginning after December 15, 2009, except for the disclosures about purchases, sales, issuances and settlements in the roll forward of activity in Level 3 fair value measurements. Those disclosures are effective for fiscal years beginning after December 15, 2010, and for interim periods within those fiscal years. Early application is permitted. The Company is currently evaluating the impact of the disclosures about purchases, sales, issuances and settlements in the roll forward of activity in Level 3 fair value measurements.
In February 2010 the FASB issued ASU No. 2010-09, Subsequent Events (Topic 855): Amendments to Certain Recognition and Disclosure Requirements. ASU 2010-09 reiterates that an SEC filer is required to evaluate subsequent events through the date that the financial statements are issued and eliminates the required disclosure of the date through which subsequent events have been evaluated. The updated guidance was effective upon issuance and its adoption had no impact on the Company’s consolidated financial statements.
In April 2010 the FASB issued ASU No. 2010-17, Revenue Recognition—Milestone Method (Topic 605) — Revenue Recognition (ASU 2010-17). ASU 2010-17 provides guidance on defining the milestone and determining when the use of the milestone method of revenue recognition for research or development transactions is appropriate. Consideration that is contingent on achievement of a milestone in its entirety may be recognized as revenue in the period in which the milestone is achieved only if the milestone is judged to meet certain criteria to be considered substantive. Milestones should be considered substantive in their entirety and may not be bifurcated. An arrangement may contain both substantive and non-substantive milestones, and each milestone should be evaluated individually to determine if it is substantive. ASU 2010-17 is effective on a prospective basis for milestones achieved in fiscal years, and interim periods within those years, beginning on or after June 15, 2010. The adoption of this ASU had no impact on the Company’s consolidated financial statements.
In July 2010 the FASB issued ASU No. 2010-20, Disclosures about the Credit Quality of Financing Receivables and the Allowance for Credit Losses (ASU 2010-20). ASU 2010-20 requires enhanced disclosures about the credit quality of financing receivables and the allowance for credit losses. Entities will be required to provide a greater level of disaggregated information about the credit quality of their financing receivables and their allowances for credit losses. In addition, entities will be required to disclose credit quality indicators, past due information, and modifications of financing receivables. The required disclosures as of the end of a reporting period are effective for interim and annual reporting periods ending on or after December 15, 2010. The required disclosures about activity that occurs during a reporting period are effective for interim and annual reporting periods beginning on or after December 15, 2010. Adoption of this ASU had no impact on the Company’s consolidated financial statements.
In December 2010 the FASB has issued ASU No. 2010-28, Intangibles - Goodwill and Other (Topic 350): When to Perform Step 2 of the Goodwill Impairment Test for Reporting Units with Zero or Negative Carrying Amounts. The amendments in this ASU modify Step 1 of the goodwill impairment test for reporting units with zero or negative carrying amounts. For those reporting units, an entity is required to perform Step 2 of the goodwill impairment test if it is more likely than not that a goodwill impairment exists. In determining whether it is more likely than not that goodwill impairment exists, an entity should consider whether there are any adverse qualitative factors indicating that impairment may exist. The qualitative factors are consistent with the existing guidance and examples, which require that goodwill of
a reporting unit be tested for impairment between annual tests if an event occurs or circumstances change that would more likely than not reduce the fair value of a reporting unit below its carrying amount. For public entities, the amendments in this ASU are effective for fiscal years, and interim periods within those years, beginning after December 15, 2010. Early adoption is not permitted. The Company is currently evaluating the impact adoption of this update may have on the consolidated financial statements.
In December 2010 the FASB has issued ASU No. 2010-29, Business Combinations (Topic 805): Disclosure of Supplementary Pro Forma Information for Business Combinations. The amendments in this ASU affect any public entity as defined by Topic 805, Business Combinations that enters into business combinations that are material on an individual or aggregate basis. The amendments in this ASU clarify certain aspects of the computation and disclosure of the pro forma net income and earnings per share required to be disclosed in connection with business combinations. The amendments are effective prospectively for business combinations for which the acquisition date is on or after the beginning of the first annual reporting period beginning on or after December 15, 2010. Early adoption is permitted. The Company does not expect that the adoption of this update will have a material effect on the consolidated financial statements.
Long-lived Assets
Long-lived assets are reviewed for impairment whenever events or changes in circumstances indicate that the carrying amount may not be recoverable. An impairment loss is recognized when the carrying amount of the asset exceeds the estimated undiscounted future cash flows expected to result from the use of the asset and its eventual disposition. The Company’s long-lived assets include its petrochemical facility, its contract based intangible asset resulting from its acquisition of STTC, and its investments in AMAK and PEVM.
The Company’s petrochemical facility is currently its only revenue generating asset. The facility was in full operation at December 31, 2010. Property, pipeline and equipment costs are reviewed annually to determine if adjustments should be made.
The Company assesses the carrying values of its assets on an ongoing basis. Factors which may affect carrying values include, but are not limited to, mineral prices, capital cost estimates, the estimated operating costs of any mines and related processing, ore grade and related metallurgical characteristics, the design of any mines and the timing of any mineral production. There are no assurances that, particularly in the event of a prolonged period of depressed mineral prices, the Company will not be required to take a material write-down of any of its mineral properties.
Environmental Liabilities
The Petrochemical Company is subject to the rules and regulations of the TCEQ, which inspects the operations at various times for possible violations relating to air, water and industrial solid waste requirements. As noted in Item 1. Business and Item 3. Legal Proceedings, evidence of groundwater contamination was discovered in 1993. The recovery process, initiated in 1998, is proceeding as planned and is expected to continue for many years.
Also in 1997, the TCEQ notified South Hampton of several alleged violations relating to air quality rules and the storage, processing and disposal of hazardous waste. Some claims have been dropped, some have been settled and others continue to be negotiated. It is the Company’s policy to accrue remediation costs based on estimates of known environmental remediation exposure. During 2007 an additional $75,000 was accrued for potential settlement of these violations. At December 31, 2007, a total liability of $275,000 was accrued to cover the final negotiated settlement costs of these environmental issues. The settlement was paid beginning in September 2008 with the last payment being made in December 2008. Approximately one half of the total amount was paid into a fund operated by the State which pays for local environmental enhancement projects. In this case the money was designated to a project connecting low income families to a municipal sewer system in the County in which the Company operates.
In 2008 the Company learned of a claim by the U.S. Bureau of Land Management (“BLM”) against World Hydrocarbons, Inc. for contamination of real property owned by the BLM north of and immediately adjacent to the processing mill situated on property owned by PEVM. The BLM’s claim alleged that mine tailings from the processing mill containing lead and arsenic migrated onto BLM property during the first half of the twentieth century. World Hydrocarbons, Inc. responded to the BLM by stating that it does not own the mill and that PEVM is the owner and
responsible party. PEVM subsequently commenced dialogue with the BLM in late 2008 to determine how best to remedy the situation. Communication with the BLM is continuing. PEVM has retained an environmental consultant to assist with the resolution of this matter and as of December 31, 2010, had recorded a liability of $350,000 to cover estimated remediation costs.
Share-Based Compensation
The Company expenses the cost of employee services received in exchange for an award of equity instruments based on the grant date fair value of such instruments. The Company uses the Black-Sholes model to calculate the fair value of the equity instrument on the grant date.
Income Taxes
In assessing the realization of deferred tax assets, the Company considers whether it is more likely than not that some portion or all of the deferred tax assets will not be realized. As a result of uncertainty of achieving sufficient taxable income in the future a valuation allowance against a portion of its deferred tax asset has been recorded. If these estimates and assumptions change in the future, the Company may reverse the valuation allowance against deferred tax assets. The Company assesses its tax positions taken or expected to be taken in a tax return to record any unrecognized tax benefits. At January 1, 2007 (adoption date), and at December 31, 2010, there were no unrecognized tax benefits.
Derivative Instruments
The Company uses financial commodity swaps to hedge the cost of natural gasoline, the primary source of feedstock, and natural gas used as fuel to operate our plant to manage risks generally associated with price volatility. The contracts are recorded in our consolidated balance sheets as either an asset or liability measured at its fair value. Our commodity agreements are not designated as hedges; therefore, all changes in estimated fair value are recognized in cost of petrochemical product sales and processing in the consolidated statements of operations.
On March 21, 2008, South Hampton entered into a pay-fixed, receive-variable interest rate swap agreement with Bank of America related to the $10.0 million term loan secured by property, pipeline and equipment. The effective date of the interest rate swap agreement was August 15, 2008, and terminates on December 15, 2017. The notional amount of the interest rate swap was $7,750,000 at December 31, 2010. South Hampton receives credit for payments of variable rate interest made on the term loan at the loan’s variable rates, which are based upon the London InterBank Offered Rate (LIBOR), and pays Bank of America an interest rate of 5.83% less the credit on the interest rate swap. South Hampton designated the transaction as a cash flow hedge according to ASC Topic 815, Derivatives and Hedging. Beginning on August 15, 2008, the derivative instrument was reported at fair value with any changes in fair value reported within other comprehensive income (loss) in the Company’s Consolidated Statement of Stockholders’ Equity. The Company entered into the interest rate swap to minimize the effect of changes in the LIBOR rate.
The fair value of the derivative liability associated with the interest rate swap at December 31, 2010, and 2009 totaled $1,116,220 and $1,274,692, respectively. The cumulative loss from the changes in the swap contract’s fair value that is included in other comprehensive loss is reclassified into income when interest is paid.
South Hampton assesses the fair value of the interest rate swap using a present value model that includes quoted LIBOR rates and the nonperformance risk of the Company and Bank of America based on the Credit Default Swap Market (Level 2 of fair value hierarchy).
The market risk inherent in the Company’s financial instruments represents the potential loss resulting from adverse changes in interest rates, foreign currency rates and commodity prices. The Company’s exposure to interest rate changes results from its variable rate debt instruments which are vulnerable to changes in short term United States prime interest rates. At December 31, 2010, 2009 and 2008, the Company had approximately $21,558,000, $24,839,000 and $28,459,000, respectively, in variable rate debt outstanding. A hypothetical 10% change in interest rates underlying these borrowings would result in annual changes in the Company’s earnings and cash flows of approximately $2,156,000, $2,484,000 and $2,846,000 at December 31, 2010, 2009 and 2008, respectively. However, the interest rate swap will limit this exposure in future periods on $10.0 million of the outstanding term debt.
The Company does not view exchange rates exposure as significant and has not acquired or issued any foreign currency derivative financial instruments.
The Petrochemical Company purchases all of its raw materials, consisting of feedstock and natural gas, on the open market. The cost of these materials is a function of spot market oil and gas prices. As a result, the Petrochemical Company’s revenues and gross margins could be affected by changes in the price and availability of feedstock and natural gas. As market conditions dictate, the Petrochemical Company from time to time will engage in various hedging techniques including financial swap and option agreements. The Petrochemical Company does not use such financial instruments for trading purposes and is not a party to any leveraged derivatives. The Petrochemical Company’s policy on such hedges is to buy positions as opportunities present themselves in the market and to hold such positions until maturity, thereby offsetting the physical purchase and price of the materials.
At the end of 2010, market risk for 2011 was estimated as a hypothetical 10% increase in the cost of natural gas and feedstock over the market price prevailing on December 31, 2010. The Company had economic hedges in effect at December 31, 2010, through March 2011. Assuming that 2011 total petrochemical product sales volumes stay at the same rate as 2010 and that feed prices stay in the range that they were at the end of the year, the 10% market risk increase will result in an increase in the cost of natural gas and feedstock of approximately $11,000,000 in fiscal 2011.
At the end of 2009, market risk for 2010 was estimated as a hypothetical 10% increase in the cost of natural gas and feedstock over the market price prevailing on December 31, 2009. The Company had no economic hedges in effect at December 31, 2009. Assuming that 2010 total petrochemical product sales volumes stay at the same rate as 2009 and that feed prices stay in the range that they were at the end of the year, the 10% market risk increase will result in an increase in the cost of natural gas and feedstock of approximately $7,500,000 in fiscal 2010.
The consolidated financial statements of the Company and the consolidated financial statement schedules, including the report of our independent registered public accounting firm thereon, are set forth beginning on Page F-1.
None
Disclosure Controls and Procedures
Management of the Company has evaluated, under the supervision and with the participation of the Company’s principal executive officer and principal financial officer, the effectiveness of the design and operation of the Company’s “disclosure controls and procedures” (as defined in the Securities Exchange Act of 1934 Rules 13a-15(e) and 15d-15(c)) as of the end of the period covered by this report. Based on this evaluation, the principal executive officer and principal financial officer have concluded that our disclosure controls and procedures were effective at December 31, 2010, and designed to provide reasonable assurance that material information relating to us and our consolidated subsidiaries is recorded, processed, summarized and reported within the time periods specified in the Securities and Exchange Commission’s rules and forms, and is accumulated and communicated to management, including the Company’s principal executive officer and principal financial officer, as appropriate, to allow timely decisions regarding required disclosure.
Management’s Report on Internal Control Over Financial Reporting
Management of the Company is responsible for establishing and maintaining adequate internal control over financial reporting. The Company’s internal control system was designed to provide reasonable assurance regarding the reliability of financial reporting and preparation of financial statements for external purposes in accordance with accounting principles generally accepted in the United States of America. All internal control systems, no matter how well designed, have inherent limitations and may not prevent or detect misstatements. Therefore, even those systems determined to be effective can provide only reasonable assurance with respect to financial statement preparation and presentation. Company management assessed the effectiveness of the Company’s internal control over financial reporting as of December 31, 2010. In making this assessment, The Company used the criteria set forth by the Committee of Sponsoring
Organizations of the Treadway Commission (COSO) in Internal Control—Integrated Framework. Our management concluded that based on its assessment, our internal control over financial reporting was effective as of December 31, 2010.
This annual report does not include an attestation report of the Company’s registered public accounting firm regarding internal control over financial reporting. Management’s report was not subject to attestation by the Company’s registered public accounting firm pursuant to rules of the SEC that permit the Company to provide only management’s report in this annual report.
Internal Control Over Financial Reporting
There were no changes in our internal control over financial reporting that occurred during the quarter ended December 31, 2010, that have materially affected, or are reasonably likely to affect materially, the Company’s internal control over financial reporting.
None
The following sets forth the name and age of each director of the Company as of December 31, 2010, the date of his election as a director and all other positions and offices with the Company held by him.
|
Name; Current Positions Held
|
Age
|
Director since
|
Term expires at Annual meeting in
|
|
Nicholas N. Carter ………………………………………….
President, Chief Executive Officer of the Company since July 2009, President of the Petrochemical Company since 1987, Member of AMAK and PEVM Boards
|
63
|
2004
|
2011
|
|
Robert E. Kennedy ………………………………………….
Chairman of the Audit and Compensation Committees; Member of Nominating Committee
|
66
|
2007
|
2012
|
|
Ghazi Sultan
Chairman of the Nominating Committee; Member of Compensation and Audit Committees and AMAK Board
|
74
|
1993
|
2013
|
|
Allen P. McKee
Member of the Audit, Compensation and Nominating
Committees and AMAK Board
|
69
|
2009
|
2012
|
|
Mohammed Al Omair
Member of Audit, Compensation and Nominating
Committees
|
67
|
2007
|
2011
|
|
Charles W. Goehringer, Jr.
General Counsel and Member of AMAK and PEVM Boards
|
52
|
2007
|
2011
|
Mr. Nicholas N. Carter, a U.S. citizen and the President and Chief Executive Officer of the Company since July 2009, is a 1975 graduate of Lamar University with a Bachelor of Business Administration Degree in Accounting. Mr. Carter has been a Certified Public Accountant since 1977. He worked at the Sabine River Authority of Texas as a Project Accountant from 1973 to 1975. From 1975 to 1977 he was a Staff Accountant with Wathen, DeShong and Company, CPA's. In 1977 he joined South Hampton as Controller. His job titles with the Company include 1979, Facility Manager at TOCCO, 1982, Treasurer of TOCCO, 1987, President of South Hampton. In 2007 he added the title of Executive Vice President of Arabian American Development Co. in addition to the petrochemical duties. He was named to his current position in 2009. From 1977 until the present Mr. Carter has been employed by the Company in a succession of positions with increasing and broader operating responsibilities, as follows; 1977-1979, Controller of South Hampton; 1979 to 1982, Facility Manager at a ship dock and terminal facility owned by TOCCO; 1982 to 1987, Treasurer of TOCCO; 1987 to 2010, President of South Hampton; and 2007 to 2009, Executive Vice President of Arabian American Development Co. This succession of positions with the Company gave Mr. Carter broad experience and knowledge in both the operations and finances of the Company, and in 2009 he was named to his current position, and also retains the petrochemical duties. Mr. Carter also serves as a Director and President of PEVM Ely Valley Mines, Inc. of which the Company owns 55% of the outstanding stock. Mr. Carter was appointed to the Board of AMAK in February 2009.
Mr. Robert Kennedy, a U.S. citizen, is the President of Robert E. Kennedy and Associates, a consulting firm assisting various entities with transportation and project development issues in Europe and the Middle East. He has over thirty years experience in the oil and petrochemical industry and retired as General Manager for Supply, Logistics, and Procurement from Chevron Chemical in 2000. During his employment with Chevron he was instrumental in developing the Aromax project in Jubail, Saudi Arabia. Mr. Kennedy holds a Bachelors of Science Degree in Chemical Engineering from the University of Iowa and attended the Masters of Business Administration program of American University. Mr.
Kennedy was appointed to the Board of AMAK in 2009 but replaced in January 2010. We believe that this experience, as well as his leadership abilities, brings valuable experience and skill to our board of directors.
Mr. Ghazi Sultan, a Saudi citizen, received Bachelor of Science Degrees in Geology and Chemistry from the University of Cairo in 1958. He received a Master’s of Science Degree in Geology from the University of Texas in 1964. From 1965-1988, Mr. Sultan served in various Saudi Arabian governmental posts for the Ministry of Petroleum and Minerals, including Director of the Geology Department, Director General of Mineral Resources, Assistant Deputy Minister, and finally as Deputy Minister for Mineral Resources. Mr. Sultan previously served as a member of the Board of Directors of Petromin, the Jeddah Refinery, and King Fahad University of Petroleum and Minerals. He is currently a member of the Board of AMAK. During his career, Mr. Sultan supervised, assisted and negotiated contracts on behalf of the Ministry of Petroleum and Mineral resources with the United States Geological Survey, BRGM of France, Rio – UK Tinto Zinc, British Steel – UK, Roan Selection Trust – UK, Min-Atom – France, Preussag – Germany, Arabian Drilling – Saudi Arabia, and Saudi Sudanese Mission for Red Sea mining. We believe that his knowledge of the mining industry and manner of conducting business in Saudi Arabia provide a critical resource and skill set to our board of directors.
Mr. Allen P. McKee, a US citizen, appointed to the board in 2009 and subsequently elected to serve until 2012, has an extensive background in investment evaluation and management as well as international finance. He has been an advisor to Fal Holdings Arabia Co. Ltd., Riyadh, since its inception in 1977. Mr. McKee served as president of Montgomery Associates Inc. from 1975-2000, a firm focusing on both venture-stage companies and real property investments. From 1974-78 he was an advisor to companies seeking funding through the International Finance Corp (World Bank Group) and regional development banks. From 1971-74, Mr. McKee served as vice president of Union International (Union Bank’s international venture subsidiary) and previously was investment officer with BankAmerica International Financial Corp. From 1967-70 he was area relations officer on the headquarters staff overseeing the Middle East banking group at Bank of America. He holds a Bachelor of Arts Degree in Economics from the University of Michigan (1964) and a Masters of Business Administration Degree in Finance from the University of California, Berkeley (1971). Mr. McKee served as a naval officer in the US Pacific Fleet from 1964-67. He was appointed to the Board of AMAK in 2009 and serves on the audit, nominations and compensation committees of the Company, chairing the latter. We believe that his knowledge of the Middle East and finance and accounting provide a critical resource and skill set to our board of directors.
Mr. Charles W. Goehringer, Jr., a U.S. citizen and partner of the law firm of Germer Gertz, L.L.P. in Beaumont, Texas, serves as corporate counsel for the Company. From 1981-1987, Mr. Goehringer worked for Gulf States Utilities Company as a mechanical engineer and unit superintendent. From 1987-1995, Mr. Goehringer worked for Quantum Chemical Company as a mechanical engineer and maintenance superintendent. He next worked as an attorney for the law firm of Mehaffy Weber, P.C. from 1995-2000. From 2000 to the present, Mr. Goehringer has been employed as an attorney with the law firm of Germer Gertz, L.L.P. Mr. Goehringer holds a Bachelor of Science Degree in Mechanical Engineering from Lamar University, a Masters of Business Administration Degree from Colorado University, and a Doctor of Jurisprudence from South Texas College of Law. Mr. Goehringer also serves as a Director of PEVM of which the Company owns 55% of the outstanding stock. He was appointed to the AMAK board in January 2011. We believe that his knowledge of the industry and finance provide a critical resource and skill set to our board of directors.
Mr. Mohammed O. Al Omair, a Saudi citizen, resides in Riyadh, Saudi Arabia, and previously served as Senior Vice President & Deputy Chief Executive Officer for Fal Holdings Arabia Co. Ltd. Prior to his service with Fal, he held a senior position with the Gulf Cooperation Counsel (GCC), a six-nation organization of Arab nations in the region. He holds a Bachelor of Arts Degree in Political Science and a Master of Public Administration from the University of Washington. We believe that this experience, as well as his leadership abilities, brings valuable experience and skill to our board of directors.
On February 24, 2011, John R. Townsend was appointed to be a member of the Board of Directors of the Company, and shall hold office until the next annual meeting of stockholders. Mr. Townsend is expected to serve on the Audit and Compensation Committees. Mr. Townsend has 33 years of experience in the Petrochemicals Industry including over 20 years experience as a Plant Manager in olefins, aromatics, paraxylene, polystyrene, synthetic lubricants and catalyst plants.
The Nominating Committee solicits recommendations for potential Board candidates from a number of sources including members of the Board, officers of the Company, individuals personally known to the members of the Board and through third-party research. In addition, the Committee will consider candidates submitted by stockholders when
submitted in accordance with the procedure described in the Company’s annual proxy statement. The Committee will consider all candidates identified through the processes above and will evaluate each of them on the same basis.
The Board of Directors of the Company has an Audit Committee which is composed of Ghazi Sultan, Mohammed Al Omair, Robert Kennedy and Allen McKee. The Board has determined that each of the members of the Audit Committee meets the Securities and Exchange Commission and Nasdaq Stock Market standards for independence. The Board has also determined that Allen McKee meets the Securities and Exchange Commission criteria of an “audit committee financial expert.”
The following sets forth the name and age of each executive officer of the Company as of December 31, 2010, the date of his appointment and all other positions and offices with the Company held by him.
|
Name
|
Positions
|
Age
|
Appointed
|
|
Nicholas N. Carter
|
President, Chief Executive Officer and Director/President - TOCCO
|
63
|
2009/1987
|
|
Mark Williamson
|
Vice President of Marketing - TOCCO
|
55
|
1996
|
|
Connie Cook
|
Chief Accounting Officer, Secretary, Treasurer/Secretary, Treasurer - TOCCO
|
47
|
2008/2004
|
|
Ronald Franklin
|
Vice President of Manufacturing – TOCCO
|
52
|
2010
|
Each executive officer of the Company serves for a term extending until his successor is elected and qualified.
Please refer to the director discussion above for Mr. Carter’s business experience.
Mr. Mark Williamson is a U.S. Citizen and has been Vice President of Marketing for TOCCO since 1995. Mr. Williamson is a graduate of Sam Houston State University with a BBA in Marketing. Mr. Williamson has been with TOCCO since 1987 and has over 30 years within the petrochemical industry. Before TOCCO, Mr. Williamson spent 5 years with Ashland Chemicals as Sales and Marketing Representative and Branch Manager.
Ms. Connie Cook, a U.S. citizen, received her BBA Degree in Accounting from Lamar University in 1991 and is a CPA. She was the Accounting Manager of TOCCO from 1991-96. She has been the Controller of TOCCO from 1996 to the present and was the Assistant Secretary of TOCCO from 1992-2004. In 2004 Ms. Cook became the Secretary/Treasurer of TOCCO and continues to hold those titles. She was the Assistant Secretary of the Company from 2007-08. In 2008 Ms. Cook became the Secretary/Treasurer of the Company and continues to hold those titles. In January 2011 she was named Chief Financial Officer.
Mr. Ronald Franklin, a U.S. citizen, received his BS Degree in Electrical Engineering from Lamar University in 1982 and his Master’s of Engineering Management from Lamar University in 1994. He has over 30 years of petrochemical process experience at Texaco Chemical Company, Huntsman Corporation and Flint Hills Resources. The highest positions reached were Director of Operations for Surfactants and Director of Operations for PO/MTBE. He also worked as a process industry consultant specializing in merger and acquisition due diligence prior to joining South Hampton in November 2009 as Manager of Business Development. He was subsequently promoted to Vice President of Manufacturing in August 2010.
There are no family relationships among our directors and executive officers.
Section 16(a) Beneficial Ownership Reporting Compliance
Section 16(a) of the Securities Exchange Act 1934 requires the Company’s officers and directors, and persons who own more than 10% of a registered class of the Company’s equity securities, to file reports of ownership and changes in ownership with the SEC. Officers, directors and greater than 10% stockholders are required by SEC regulation to furnish the Company with copies of all Section 16(a) forms they file. To the best of the Company’s knowledge, during the fiscal year ended December 31, 2010, all Section 16(a) filing requirements applicable to its officers, directors and greater than 10% beneficial owners were complied with.
The Company has adopted a Code of Ethics that applies to the Company’s principal executive officer, principal financial officer, principal accounting officer and controller, and to persons performing similar functions. A copy of the Code of Ethics has been filed as an exhibit to the Annual Report and is available on our website.
Executive Compensation Philosophy
This Compensation Discussion and Analysis presents information about the compensation of our officers named in the Summary Compensation Table on page 46(the “Named Executive Officers” or “NEOs”). Our executive compensation program is designed to promote a strong culture of leadership development, aligned with performance improvement (focused on both growth and productivity) and integrity, which in turn drives financial performance that provides value to our shareholders. The main components of our executive compensation program include base salary and annual and long-term incentives (total direct compensation). By having two of the three main components of executive pay based upon corporate performance our incentive program is designed to emphasize a pay-for-performance relationship.
|
•
|
Annual incentive awards consist of cash bonuses generated under our new annual incentive program and our legacy profit sharing. Cash awards under our annual incentive plan are tied to financial results (Operating Income) and to a lesser extent individual performance. Our profit sharing program is available to all petrochemical segment employees (including our NEOs) and is based on cash flow from the petrochemical segment of the business. Our NEOs have historically participated in the profit sharing program with all of our petrochemical employees. We have seen a connection between our executives and our other employees when everyone gathers for a quarterly meeting to discuss Company performance. The checks that are handed out to each participant in attendance reflect the operating results of the previous quarter. Everyone from our lowest hourly rate petrochemical employee to our CEO feel the excitement or disappointment with the size of their respective profit sharing checks. We feel that it is important to continue this practice and do not want to disrupt this employee-wide participation and personal connection and identification with corporate’s quarterly results. For reasons stated below, we implemented a new annual incentive program for our NEOs in 2010 which could have eliminated the need for NEO participation in our profit sharing program. However, rather than eliminate NEO participation from the profit sharing plan we simply net out any quarterly payment made throughout the year from the bonus generated under the new annual incentive program. By doing this we maintain the connection between our executives and other employees. Both bonuses and profit sharing awards are paid in cash and provide a strong link between pay and performance as they are directly determined by operating income and profitability.
|
|
•
|
The 2008 long-term incentive program currently issues equity to our executives in the form of stock options. The equity-based reward to our executives is therefore highly correlated to the investment success of our shareholders as options hold value only as our stock price increases above the strike price.
|
Our long-term success depends on our people. We strive to ensure that our employees’ contribution and performance are recognized and rewarded through a competitive compensation program. We target an executive compensation package that is competitive against the market in which we compete for talent. A substantial portion of any of our executives’ annual total compensation package is variable compensation tied to performance (i.e., Operating Income and individual performance). We have designed our incentive program in such a way that if performance is at or above targeted levels, the executive’s total compensation will be at or above targeted levels. Conversely, if performance is below targeted levels, the executive’s compensation will be below targeted levels.
Executive Compensation Program Design
Base Salary. Base salaries provide for competitive pay based on the market value of the position and meet the objective of attracting and retaining talent needed to run the business. Salaries are reviewed by the Compensation Committee (the “Committee”) annually. Salary increases may be given based on individual factors, such as competencies, skills, experience, performance and market practices. There are no specific weightings assigned to these individual factors. Annual salary increases are generally effective in January. Increases may also be given when executives assume new roles or are promoted.
Annual Cash Incentive Plan. We use Operating Income as the financial metric for annual executive bonus awards. The Committee believes that this is the best financial metric to use as a company performance indicator because it excludes items outside of management’s control such as tax and interest rates. In addition, Operating Income is easily
determinable because it is a line item on the Company’s Consolidated Statements of Operations shown on page F-6 and is equal to Revenues less Operating Costs and Expenses and General Administrative Expenses.
Once financials are available at the conclusion of the fiscal year, the Committee will review our Operating Income results and may choose to exclude or adjust certain items to ensure that award payments reflect the core operating performance of the business. Examples include scenarios where the Company’s product prices decline by 50% or more or increase by 100% or more. Operating Income measures our ability to generate income after covering operating costs and general and administrative expenses. Operating Income represents a challenging performance metric because feedstock costs and product prices have been very volatile in recent years. Operating Income grows by not only increasing revenues through increased sales or improved product prices, but also by maintaining product margins, reducing costs and managing assets. The primary challenge lies in maintaining reasonable product margins, especially when feedstock prices are rapidly changing from one month to the next.
Thus annual cash bonuses are designed to motivate and reward NEOs and all other executives on the achievement of company and individual goals for the performance year. Our annual incentive plan is designed to allow NEOs and other executives to earn up to 200% of their target bonus based upon performance achieved. Each executive’s target bonus is expressed as a percentage of base salary. The bonus levels below were adopted by the Committee.
|
Participant Title
|
Target Bonus
(as % of Base Salary)
|
Max
|
Maximum Bonus
(as % of Base Salary)
|
|
President and CEO
|
80%
|
2X
|
160%
|
|
Chief Accounting Officer
|
45%
|
2X
|
90%
|
|
Vice President of Marketing
|
45%
|
2X
|
90%
|
|
Vice President of Manufacturing
|
50%
|
2X
|
100%
|
Bonus payouts are determined by measuring performance on both a corporate and personal level.
|
•
|
20% of the target bonus is based upon individual performance. Each of the goals are equally weighted in this portion of a participant’s target bonus (i.e., if there are two individual performance goals then 10% of the target bonus each). The Committee is responsible for determining the President/CEO’s performance relative to any individual goals. The President/CEO determines the performance of his direct reports and makes a recommendation for approval to the Committee.
|
|
•
|
80% of the target bonus is based upon corporate performance and is determined by the achievement of a pre-established Operating Income goal. Actual Operating Income relative to the Operating Income goal determines the multiple to be applied to this portion of a participant’s bonus. For example, if 100% (“Target” Performance) of the Operating Income goal is met, then a 1.00X multiple is applied to 80% of the participant’s target bonus. Threshold payouts will occur when 80% of the Operating Income goal is met (“Threshold” Performance). In this case a 0.50X multiple is applied to 80% of the participant’s Target bonus. Performance below Threshold (80% Target of Operating Income) results in a zero dollar payout. The Maximum payout occurs when actual Operating Income is greater than or equal to 140% of the Operating Income goal (“Maximum” Performance). When Maximum Performance is achieved, a 2.25X multiple is applied to 80% of the participant’s Target bonus (a 2.25X multiple applied to the corporate portion of the Target bonus allows a participant to earn up to two times the Target bonus, assuming the participant successfully achieved his or her individual performance goals). Payouts are scaled linearly between Threshold and Target for performance levels between 80% and 100% of Target Performance, and between Target and Maximum for performance levels between 100% and 140% of Target Performance.
|
Examples of bonus payout calculations for the President/CEO are as follows:
|
Base Salary: $250,000
|
|
|
|
|
Target Bonus as % of Base Salary: 80%
|
|
$ |
200,000 |
|
|
Maximum Bonus as % of Base Salary: 160%
|
|
$ |
400,000 |
(1) |
|
TARGET BONUS
|
|
|
|
Status
|
|
Multiple
|
|
|
Payout
|
|
|
Individual Goals
|
|
|
20 |
% |
Achieved
|
|
|
1 |
X |
|
$ |
40,000 |
|
|
Corporate Performance
|
|
|
80 |
% |
Target
|
|
|
1 |
X |
|
$ |
160,000 |
|
| |
|
|
100 |
% |
|
|
|
|
|
|
$ |
200,000 |
|
|
MAXIMUM BONUS
|
|
|
|
|
Status
|
|
Multiple
|
|
|
2X Target
|
|
|
|
Individual Goals
|
|
|
10 |
% |
(3) |
Achieved
|
|
|
1 |
X |
|
$ |
40,000 |
|
|
|
Corporate Performance
|
|
|
90 |
% |
|
Target
|
|
|
2.25 |
X |
|
$ |
360,000 |
|
(2) |
| |
|
|
100 |
% |
|
|
|
|
|
|
|
$ |
400,000 |
|
(1) |
| |
|
|
|
|
|
|
|
|
|
|
|
|
|
|
|
|
(1)
|
$400,000 = 2X the Target Bonus
|
|
(2)
|
$360,000 = $200,000 X 80% X 2.25
|
|
(3)
|
There is only a “target” payout related to Individual Goals; therefore, this payout remains the same even in a maximum performance scenario and only accounts for 10% of the total payout; 90% of the maximum award payout is based upon Corporate Operating Income performance
|
The following payout schedule is applied to 80% of the participant’s target bonus which is tied to corporate performance in the form of Operating Income.
|
Payout level
|
Corporate Performance
Bonus Multiple
|
Performance Achievement
|
|
Maximum
|
2.25X(1)
|
140% of Operating Income goal
|
|
Target
|
1.00X
|
100% of Operating Income goal
|
|
Threshold
|
0.50X
|
80% of Operating Income goal
|
|
(1)
|
Applying a multiple of 2.25X the Corporate Performance portion of the target bonus is necessary to allow our participants an opportunity to earn 200% of their target bonus because it is being applied to only 80% of the targeted bonus payout. The amount of the target bonus paid for achieving individual goals does not change in a maximum corporate performance scenario.
|
Payouts are scaled linearly between Threshold and Target, and then between Target and Maximum for performance levels between 80% and 140% of Target Performance. Payouts will be interpolated for actual performance between these points.
Profit Sharing Program. South Hampton’s profit sharing program is available to all employees, including NEOs, based upon South Hampton’s quarterly performance. Since South Hampton is located about an hour north of a larger petrochemical sector, competition for qualified, intelligent and conscientious employees is high. Base pay for employees is typically about 20% less than larger facilities; however, the profit sharing program allows South Hampton to compensate employees with additional pay when profits are sound. It also enables South Hampton the ability to forego payments during times of economic slowdown. Profit sharing is done on a quarterly basis when cash flow permits. There is no set formula for calculating or allocating profit sharing as it is based upon several factors including profit, cash flow, expectations and special cash needs of South Hampton and the Company. In 2010 the Committee adopted a written policy governing employee profit sharing. Pursuant to this policy, the pool of funds available for profit sharing during any particular calendar quarter cannot exceed 12% of South Hampton’s estimated earnings before interest, depreciation, taxes and amortization (“EBITDA”) for that quarter. In addition, the President and CEO must submit a recommended level of profit sharing with proposed employee allocations to the Committee for approval. The amount of the total award allocated to each executive officer and to each employee is based on (i) current base salary and pay levels, (ii) instances of individual superior performance, and (iii) instances of individual sub-standard performance. South Hampton has a wide range of salary and pay levels, and in general employees at the lower end of the pay scale will be granted higher awards as a percentage of their base pay. Under the policy, the Committee has authority to revise the amount of funding available for profit sharing, as well as, to adjust individual allocations. As previously explained, all profit sharing awards to NEOs and other participants in our new, annual incentive program are netted out of any annual incentives paid out under the Company’s annual incentive program.
As an incentive for safe work performance, a safety award program is incorporated into the profit sharing program. As part of this program, South Hampton pays every employee, including NEOs and other executives, a $500 net award at the end of each calendar quarter in which there are no lost-time or recordable accidents. This program has been very successful in encouraging employees to watch out for one another and to work safely. Consistent with profit sharing awards, all safe work awards are netted out of any annual bonuses paid to the NEOs and other executives under the Company’s annual incentive program. The Committee is currently considering whether the safety award program should be eliminated for NEOs in 2011 and future years because safety will be included as an individual goal for each NEO.
Long-Term Incentive – Stock Options. Stock options align our executives’ interests with those of our shareholders since the options have realizable value only if the price of Arabian American Development Company stock increases after the options are granted. The size of future awards is evaluated and determined annually based on a consideration of competitive compensation practices and changes in our stock price year over year, as well as the number of shares remaining under our long-term incentive plan. NEOs and other executives receive nonqualified option grants with the following characteristics:
|
•
|
An exercise price equal to closing price of Arabian American Development Company stock on the grant date
|
|
•
|
Annual vesting in approximately equal installments over a specified period
|
|
•
|
Expiration seven to ten years after the grant date
|
Perquisites. We provide benefits to all employees that we believe are standard in the industry. These benefits consist of a group medical and dental insurance program for employees and their qualified dependents, group life insurance for employees and their spouses, accidental death and dismemberment coverage for employees, a Company sponsored cafeteria plan and a 401(k) employee savings and investment plan. The Company matches employee deferral amounts, including amounts deferred by named executive officers, up to a total of 6% of the employee’s eligible salary, excluding annual cash bonuses, subject to certain regulatory limitations. Starting in late 2010, we provided our President/CEO with a company vehicle for business and personal travel. Our use of perquisites as an element of compensation is very limited. We do not view perquisites as a significant element of our comprehensive compensation structure.
Governance of Pay Setting Process
In setting total direct compensation, a consistent approach is applied for all executives:
|
•
|
We benchmark our NEOs to comparable positions within the market in terms of specific duties, responsibilities, and job scope.
|
|
•
|
Each position has an established target annual incentive award opportunity, executive benefits and perquisites. These incentive levels and benefits are reviewed by the Committee on an annual basis to determine their relative level of competitiveness with the market.
|
|
•
|
We generally target all elements of pay and total direct compensation to be positioned between the 25th to 50th percentiles of our peer group.
|
|
•
|
Individual executive pay positioning will vary based on the requirements of the job (competencies and skills), the executive’s experience and performance, and the organizational structure (internal alignment and pay relationships).
|
|
•
|
We also consider internal pay equity when establishing compensation levels. Currently, we believe that our compensation level for each of our NEOs reflects his or her job responsibility and scope appropriately and scale down from the CEO in a reasonable manner.
|
|
•
|
Exceptions to normal practice may be made based on critical business and people needs.
|
|
|
Role of the Compensation Committee in Establishing Pay Levels
|
|
•
|
The Compensation Committee, comprised of only independent directors, establishes, reviews and approves all elements of the executive compensation program. A copy of the Compensation Committee Charter is available on our website. During 2010 the Committee engaged Pearl Meyer & Partners (“PM&P”) to serve as its independent outside executive compensation consultant. PM&P’s primary role is to provide advice and perspective regarding market compensation trends that may impact decisions we make about our executive compensation program and practices. PM&P was instrumental in assisting the Committee in a complete overhaul of our executive compensation program in the latter half of 2010. The Company incurred expenses during 2010 payable to PM&P in the amount of $47,660. Management has the responsibility for effectively implementing the executive compensation program. Additional responsibilities of the Committee, management and the consultant include:
|
|
•
|
The Committee reviews and approves business goals and objectives relevant to executive compensation, evaluates the performance of the President/CEO in light of these goals and objectives, and determines and establishes the President/CEO’s compensation level.
|
|
•
|
Based on review of market data, individual performance and internal pay comparisons, the Committee independently sets the pay for our President/CEO and reviews and approves all NEO and other executive pay arrangements.
|
|
|
Role of Management in Establishing Pay Levels
|
|
•
|
The President/CEO makes recommendations on program design and pay levels, where appropriate, and oversees the implementation of such programs and directives approved by the Committee.
|
|
•
|
The President/CEO develops pay recommendations for his direct reports and other key executives. This includes all of our NEOs (with the exception of our CEO himself).
|
|
•
|
Our Chief Accounting Officer provides the financial information used by the Committee to make decisions with respect to incentive compensation goals and related payouts.
|
|
|
Role of the Compensation Consultant in Establishing Pay Levels
|
|
•
|
The compensation consultant is responsible for gathering, analyzing and presenting peer group pay practices and relevant data to the Committee. They do not have the authority to determine pay.
|
|
•
|
The consultant provides periodic updates to the Committee regarding various tax, accounting and regulatory issues that could have an impact on executive compensation design, administration and/or disclosure.
|
|
•
|
In 2010 the consultant assisted the Committee in revamping the executive compensation program.
|
|
|
Regulatory Considerations
|
We account for the equity compensation expense for our executives under the rule of Financial Accounting Standards Board (FASB) Accounting Standards Codification (ASC) Topic 718 (“ASC 718”), which requires us to estimate and record an expense for each award of equity compensation over the service period of the award. Accounting rules also require us to record cash compensation as an expense at the time the obligation is accrued.
Employment Arrangements
We have not entered into definitive employment agreements with any of our executives. All executives serve at the discretion of the Board with no fixed term of employment.
Benchmarking Against Our Peer Group
We benchmark executive compensation against a peer group. The peer group shown below was developed by the consultant in close consultation with the Committee and was approved the President/CEO. Peer group proxy data provides sufficient benchmarks for the executives, but because the companies are structured differently, not all peers have incumbents in the respective benchmarked positions. Some jobs have no peer benchmarks available from proxy data, such as Vice President of Marketing, which necessitates the use of industry specific and general industry related surveys as an additional data source. The consultant’s survey data provides expanded data to benchmark our executives’ positions. Peer group and survey data provides a focal point in our examination of compensation trends across the petrochemical and chemical processing industry. Each year the Committee reviews the peer group and determines whether any changes should be made. Based on the 2010 review, six companies, Crosstex Energy, Global Partners, Syntroleum, Adams Resources, Synthesis Energy and Sulphco, were removed and replaced with American Vanguard Corp., Quaker Chemical Corp., Rogers Corp., and TPC Group Inc. The 2010 peer group, inclusive of these changes, consisted of the following nine companies:
American Pacific Corp. American Vanguard Corp. KMG Chemicals Inc.
Penford Corp. Quaker Chemical Corp. Rentech Inc.
Rogers Corp. Sterling Chemicals Inc. TPC Group Inc.
Peer group benchmarking is one of several factors considered in the pay setting process. Peer group practices are analyzed annually for the pay element making up total direct compensation, and periodically for other elements (such as executive benefits and perquisites). In addition to peer group benchmarking, we also used surveys from the consultant in the pay setting process. We used a combination of proxy and survey data, weighted 50% each, to develop market values. All data was summarized to relevant statistics (e.g., median, 25th percentile and 75th percentile), and where applicable, survey data was regressed because it provides a reliable method for size adjusting cash compensation data and is the standard methodology used for analyzing executive pay. The strategy behind the sources of data is to promote the best mix of authorities for competitive positions, utilize industry data for line operations and line executives and some general industry mix to staff executive positions, and balance the proxy data with published authorities to help smooth the volatility of executive changes in the peer group. Market values of cash compensation were correlated to company size as measured by revenue and the data the Committee considered was size-adjusted where possible to reflect our current revenue level ($120 million). This process made the market data points directly applicable to the company.
After the consultant’s completion of peer group and survey data benchmarking, it was apparent that our overall executive compensation program was below market. Specifically, our executives were at the 17th percentile for base salary, the 11th percentile for target total cash levels, the 13th percentile for long-term incentive awards, and the 10th percentile for total direct compensation. The Committee used this information to begin moving the executives’ pay to levels more in line with our compensation philosophy (e.g., paying between the 25th and 50th percentiles of the market data). The Committee adopted the philosophy of targeting pay between the 25th to 50th percentile range of market data based on several factors such as the lower cost of living in southeast Texas as compared to more urban areas and the relatively limited number of competing employment opportunities available to executives in southeast Texas. Our current philosophy of at or below market median pay levels in no way reflects on the qualifications or performance of our executives. It is primarily a function of location.
The table below sets forth the 2010 annualized targeted compensation elements for each of our NEOs and the amount of each element at the target level based market data presented by our compensation consultant.
|
Executive
|
|
Annualized
Base Salary
|
|
|
Annual
Incentive Plan Target
(Profit Sharing, Cash Bonus and
Commissions)
|
|
|
Long-Term Incentive Compensation(1)
|
|
|
Annualized
Total Direct Compensation
Target
|
|
|
Nicholas N. Carter
President & CEO
Compensation Amount
|
|
$ |
250,000 |
|
|
$ |
200,000 |
|
|
$ |
66,300 |
|
|
$ |
516,300 |
|
|
Market Targeted Range
|
|
|
|
|
|
|
|
|
|
|
|
|
|
|
|
|
|
Minimum
|
|
$ |
353,000 |
|
|
$ |
396,000 |
|
|
$ |
146,000 |
|
|
$ |
878,900 |
|
|
Maximum
|
|
$ |
434,000 |
|
|
$ |
481,000 |
|
|
$ |
315,000 |
|
|
$ |
1,104,200 |
|
|
Connie J. Cook
Chief Accounting Officer
Compensation Amount
|
|
$ |
145,000 |
|
|
$ |
65,250 |
|
|
$ |
33,150 |
|
|
$ |
243,400 |
|
|
Market Targeted Range
|
|
|
|
|
|
|
|
|
|
|
|
|
|
|
|
|
|
Minimum
|
|
$ |
189,000 |
|
|
$ |
203,000 |
|
|
$ |
57,000 |
|
|
$ |
351,900 |
|
|
Maximum
|
|
$ |
218,000 |
|
|
$ |
246,000 |
|
|
$ |
89,000 |
|
|
$ |
413,200 |
|
|
Mark D. Williamson
Vice President of Marketing
Compensation Amount
|
|
$ |
253,900 |
(2 |
|
$ |
74,300 |
|
|
$ |
44,200 |
|
|
$ |
372,400 |
|
|
Market Targeted Range
|
|
|
|
|
|
|
|
|
|
|
|
|
|
|
|
|
|
Minimum
|
|
$ |
148,000 |
|
|
$ |
173,000 |
|
|
$ |
41,000 |
|
|
$ |
266,300 |
|
|
Maximum
|
|
$ |
181,000 |
|
|
$ |
215,000 |
|
|
$ |
72,000 |
|
|
$ |
312,200 |
|
|
Ron Franklin
Vice President of Manufacturing
Compensation Amount
|
|
$ |
186,000 |
|
|
$ |
93,000 |
|
|
$ |
24,700 |
|
|
$ |
303,700 |
|
|
Market Targeted Range
|
|
|
|
|
|
|
|
|
|
|
|
|
|
|
|
|
|
Minimum
|
|
$ |
229,000 |
|
|
$ |
262,000 |
|
|
$ |
60,000 |
|
|
$ |
442,200 |
|
|
Maximum
|
|
$ |
265,000 |
|
|
$ |
332,000 |
|
|
$ |
104,000 |
|
|
$ |
495,700 |
|
|
(1)
|
The compensation amount for each NEO shown reflects the value of options granted to the NEOs by the Compensation Committee in the first quarter of 2010 based on the Company’s performance in 2009.
|
|
(2)
|
Includes commissions of $89,000 earned in 2010. Beginning January 1, 2011, the Vice President of Marketing will no longer receive commissions. However, his base salary for 2011 will be increased proportionately to account for the difference.
|
The charts below illustrate that a large portion of our NEOs’ pay is performance based (e.g., approximately 52% of our President/CEO’s pay is performance based and approximately 36% of our other NEOs’ pay is performance based).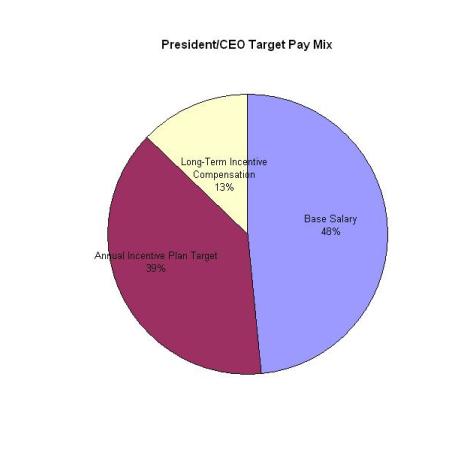
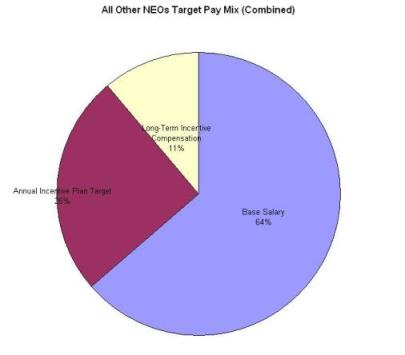 Determination of Performance Targets
Operating Income Targets are set taking into account business conditions, expectations regarding the probability of achievement, and historical financial performance. Consistent with our philosophy and approach to setting goals, incentive payouts that are above target will be for superior performance (results that exceed our business plan). Targets are set at the beginning of the performance period. The process is summarized below:
|
Beginning of the
Performance Period
|
During the Performance Period
|
End of the Performance Period
|
|
Operating Income goals are developed by the Committee and management and ultimately approved by the Committee
|
Operating Income performance is monitored relative to goals
Operating Income goals cannot be changed during the performance period
|
Management presents actual Operating Profit results relative to goals and the Committee reviews actual performance to determine any payouts
The Committee may exclude or adjust certain items that are outside the normal course of business, unusual and/or infrequent, and not reflective of our core operating performance for that period
|
Any adjustments at the end of the performance period will be at the Committee’s discretion.
Individual Performance Goals for the President/ CEO. The individual performance goals for the President/CEO for 2010 as determined by the Committee were employee safety and investor relations. In the Committee’s opinion, the President/CEO attained both of these goals because: (i) there were zero lost-time and recordable accidents, and (ii) the President/CEO attended numerous trade shows and investor conferences in 2010 which significantly increased investor awareness about the Company.
Company Goal (Operating Income). The Committee set a Target of $10 million of Operating Income for 2010 which resulted in a Threshold of $8.0 million. The Committee determined that a Target of $10 million for Operating Income (which is approximately $2 million less than average Operating Income for fiscal years 2005, 2006, 2007 and 2009) was a reasonable goal in light of the adverse economic conditions facing U.S. companies in calendar year 2010. Operating
Income for 2008 was excluded from the average due to its large deviation from the norm resulting from hedging losses. Because the Company’s actual Operating Income of $5.6 million did not equal or exceed the Threshold level of $8.0 million (i.e., 80% of Target), none of our executives qualified for a bonus under our annual incentive program.
Report of the Compensation Committee
Management has prepared the Compensation Discussion and Analysis of the compensation program for NEOs (beginning on page 33). The Committee has reviewed and discussed the Compensation Discussion and Analysis for fiscal year 2010 with management. Based on this review and discussion, the Committee recommended to the Board of Directors that the Compensation Discussion and Analysis be included in this Form 10-K for the year ended December 31, 2010, for filing with the Securities and Exchange Commission.
2010 Members of the Compensation Committee
Allen P. McKee, Chairman
Robert Kennedy
Ghazi Sultan
Mohammed Al-Omair
Compensation Committee Interlocks and Insider Participation
During 2010 no member of the Committee had a relationship that required disclosure as a Compensation Committee interlock.
Compensation and Risk
We believe that our performance-based compensation program creates appropriate incentives to increase long-term shareholder value. This program has been designed and administered in a manner that discourages undue risk-taking by employees. Relevant features of this program include:
|
•
|
limits on annual incentive and long-term performance awards, thereby defining and capping potential payouts;
|
|
•
|
application of an annual incentive metric that aligns employees with the common goal of increasing Operating Income;
|
|
•
|
use of a long-term incentive vehicle—stock option—that vests over a number of years, thereby providing strong incentives for sustained operational and financial performance;
|
|
•
|
Committee discretion to adjust payouts under the annual incentive plan to reflect the core operating performance of the company but prohibits discretion for payouts above stated maximum awards;
|
|
•
|
annual bonuses to executives are awarded after the Company’s Operating Income for the fiscal year is determined which means that 100 percent of annual bonus is delayed and at risk to the executives based on the actual company wide net operating performance of the Company; and
|
|
•
|
no awards of annual bonuses and stock option grants for a given year are based on matrices such as revenue or operating results of particular transactions or units, which would create the potential that personnel might take actions that benefit that matrix in the short-term while exposing the Company to inappropriate risk.
|
|
|
Executive Compensation Program for 2010 and 2011
|
Results - Company Performance Highlights
Highlights of our 2010 performance year are:
|
•
|
2010 Target Operating Income of $10 million; therefore Threshold level of $8 million; As noted previously, our 2010 actual Operating Income is $5,589,269 which is less than the Threshold level of $8 million; Consequently, no executive bonuses were earned in 2010.
|
|
•
|
2010 South Hampton EBITDA of $11,296,809
|
The Committee increased executive base salaries for 2011 as our salary survey indicated that we were at the 17th percentile compared to peer group and survey data as discussed below. Below is a table comparing 2010 and 2011 executive base salary. The increases approved by the Committee move our executives closer to our stated philosophy of being between the 25th and 50th percentiles of the market.
|
Position
|
|
Base Salary
2010
|
|
|
Base Salary
2011
|
|
|
Increase
|
|
|
President and CEO
|
|
$ |
250,000 |
|
|
$ |
350,000 |
|
|
$ |
100,000 |
|
|
Chief Accounting Officer
|
|
$ |
145,000 |
|
|
|
160,000 |
|
|
|
15,000 |
|
|
Vice President of Marketing (1)
|
|
$ |
165,000 |
|
|
|
255,000 |
|
|
|
90,000 |
|
|
Vice President of Manufacturing
|
|
$ |
185,600 |
|
|
|
225,000 |
|
|
|
39,400 |
|
(1) As mentioned above, our VP of Marketing will no longer be eligible to receive commission; therefore, his base salary was adjusted to compensate for this change.
The Compensation Committee is currently considering the elimination of Individual Performance goals from the annual incentive plan for 2011 and beyond. The rationale behind this consideration is a desire for 100% of annual incentive payouts to be based upon corporate performance at this senior level within the organization. This would also simplify the annual incentive program.
Related to the annual incentive plan the Compensation Committee approved the Target level of Operating Income for 2011. The approved target of $13.0 represents an increase compared to $10.0 million set for 2010. The $13 million Target was selected by the Committee for 2011 because it increases Operating Income by an approximate $1 million above the average Operating Income of $12 million for years 2005, 2006, 2007 and 2009. In the Committee’s opinion, this Target is both realistic and achievable when considering the petrochemical segment’s expanded production capabilities and the anticipated overall recovery of the U.S and worldwide economies in general.
On January 12, 2011, in an effort to bring executive long-term incentive compensation more in line with that of the market, the Committee approved the grant of 391,000 stock options to the NEOs and other executives under the Company’s Stock Option Plan for Key Employees. These options have an exercise price equal to the closing price of the stock on January 12, 2011, as reported by Nasdaq, and vest in 25% increments over a 4 year period. Below is table showing the allocation of these options to our NEOs and other executives.
|
Employee Name
|
Title
|
|
Total Options Granted
|
|
|
Vesting Period #1
1/12/11-
1/11/12
|
|
|
Vesting Period #2
1/12/12-
1/11/13
|
|
|
Vesting Period #3
1/12/13-
1/11/14
|
|
|
Vesting Period #4
1/12/14-
1/11/15
|
|
|
Nicholas Carter
|
President /CEO
|
|
|
129,030 |
|
|
|
32,257 |
|
|
|
32,258 |
|
|
|
32,257 |
|
|
|
32,258 |
|
|
Ron Franklin
|
VP Mfg.
|
|
|
58,650 |
|
|
|
14,662 |
|
|
|
14,663 |
|
|
|
14,662 |
|
|
|
14,663 |
|
|
Connie Cook
|
Sec/Treas/CAO
|
|
|
58,650 |
|
|
|
14,662 |
|
|
|
14,663 |
|
|
|
14,662 |
|
|
|
14,663 |
|
|
Mark Williamson
|
VP Marketing
|
|
|
50,830 |
|
|
|
12,707 |
|
|
|
12,708 |
|
|
|
12,707 |
|
|
|
12,708 |
|
|
Turner Evans
|
Mgr. of Log.
|
|
|
31,280 |
|
|
|
7,820 |
|
|
|
7,820 |
|
|
|
7,820 |
|
|
|
7,820 |
|
|
Merf Kaufman
|
Plant Mgr.
|
|
|
31,280 |
|
|
|
7,820 |
|
|
|
7,820 |
|
|
|
7,820 |
|
|
|
7,820 |
|
|
Darren Smith
|
IT Mgr.
|
|
|
31,280 |
|
|
|
7,820 |
|
|
|
7,820 |
|
|
|
7,820 |
|
|
|
7,820 |
|
|
Total
|
|
|
|
391,000 |
|
|
|
|
|
|
|
|
|
|
|
|
|
|
|
|
|
Total options granted of 391,000 represents the balance of authorized but un-issued options remaining in the Stock Option Plan for Key Employees that was approved by our shareholders in 2008. The Committee in consultation with our President/CEO determined the allocation of options to our key employees listed above.
Summary Compensation Table
The following table sets forth information regarding 2010 compensation for each NEO; 2009 and 2008 compensation is presented for executives who were also NEOs in 2009 and 2008. This table should be read in conjunction with the explanations provided above. It sets forth summary compensation information for the year ended December 31, 2010 for the Company’s (i) chief executive officer, (ii) chief accounting officer, and (iii) each of the Company’s three most
highly compensated executives other than the chief executive officer and the chief financial officer who were serving as executive officers of the Company as of December 31, 2010.
Summary Compensation Table
|
Name and
Principal Position
|
Year
|
|
Salary
($) (1)
|
|
|
Bonus
($)(2)
|
|
|
Stock
Award(s)
($)
|
|
|
Option Award(s)
($)(3)
|
|
|
Non-Equity
Incentive Plan
Compensation
($)
|
|
|
Change in Pension Value and Non-Qualified Deferred Compensation Earnings
($)
|
|
|
All Other
Compensation
($)(4)(5)(6)(7)(8)
|
|
|
Total
($)
|
|
|
Nicholas N. Carter President and Chief
Executive Officer since July 1, 2009; previously
Executive Vice President and Chief Operating Officer
|
2010
|
|
$ |
250,000 |
|
|
|
-- |
|
|
|
-- |
|
|
$ |
66,300 |
|
|
|
-- |
|
|
|
-- |
|
|
$ |
35,515 |
|
|
$ |
351,815 |
|
|
2009
|
|
$ |
234,837 |
|
|
$ |
60,000 |
|
|
|
-- |
|
|
|
-- |
|
|
|
-- |
|
|
|
-- |
|
|
$ |
56,642 |
|
|
$ |
351,479 |
|
|
2008
|
|
$ |
209,918 |
|
|
|
-- |
|
|
$ |
99,800 |
|
|
|
-- |
|
|
|
-- |
|
|
|
-- |
|
|
$ |
41,260 |
|
|
$ |
350,978 |
|
|
Connie J. Cook
Chief Accounting Officer
|
2010
|
|
$ |
144,997 |
|
|
|
-- |
|
|
|
-- |
|
|
$ |
33,150 |
|
|
|
-- |
|
|
|
-- |
|
|
$ |
27,209 |
|
|
$ |
205,356 |
|
|
2009
|
|
$ |
142,208 |
|
|
$ |
30,000 |
|
|
|
-- |
|
|
|
-- |
|
|
|
-- |
|
|
|
-- |
|
|
$ |
41,248 |
|
|
$ |
213,456 |
|
|
2008
|
|
$ |
133,009 |
|
|
|
-- |
|
|
$ |
49,900 |
|
|
|
-- |
|
|
|
-- |
|
|
|
-- |
|
|
$ |
34,124 |
|
|
$ |
217,033 |
|
|
Mark D. Williamson
Vice President of Marketing, Petrochemical Company
|
2010
|
|
$ |
253,904 |
|
|
|
-- |
|
|
|
-- |
|
|
$ |
44,200 |
|
|
|
-- |
|
|
|
-- |
|
|
$ |
35,861 |
|
|
$ |
333,965 |
|
|
2009
|
|
$ |
227,500 |
|
|
$ |
40,000 |
|
|
|
-- |
|
|
|
-- |
|
|
|
-- |
|
|
|
-- |
|
|
$ |
46,302 |
|
|
$ |
313,802 |
|
|
2008
|
|
$ |
240,705 |
|
|
|
-- |
|
|
$ |
49,900 |
|
|
|
-- |
|
|
|
-- |
|
|
|
-- |
|
|
$ |
40,585 |
|
|
$ |
331,190 |
|
|
Gerardo Maldonado,
Account Representative,
Petrochemical
Company
|
2010
|
|
$ |
194,404 |
|
|
|
-- |
|
|
|
-- |
|
|
|
-- |
|
|
|
-- |
|
|
|
-- |
|
|
$ |
25,673 |
|
|
$ |
220,077 |
|
|
2009
|
|
$ |
192,543 |
|
|
|
-- |
|
|
|
-- |
|
|
|
-- |
|
|
|
-- |
|
|
|
-- |
|
|
$ |
35,990 |
|
|
$ |
228,533 |
|
|
2008
|
|
$ |
179,158 |
|
|
|
-- |
|
|
|
-- |
|
|
|
-- |
|
|
|
-- |
|
|
|
-- |
|
|
$ |
25,389 |
|
|
$ |
204,547 |
|
|
Hatem El Khalidi
President and Chief
Executive Officer until June 30, 2009
|
2010
|
|
|
-- |
|
|
|
-- |
|
|
|
-- |
|
|
|
-- |
|
|
|
-- |
|
|
|
-- |
|
|
|
-- |
|
|
|
-- |
|
|
2009
|
|
$ |
36,000 |
|
|
$ |
31,500 |
|
|
|
-- |
|
|
$ |
186,288 |
|
|
|
-- |
|
|
|
-- |
|
|
$ |
40,000 |
|
|
$ |
293,788 |
|
|
2008
|
|
$ |
72,000 |
|
|
|
-- |
|
|
|
-- |
|
|
|
-- |
|
|
|
-- |
|
|
|
-- |
|
|
$ |
8,000 |
|
|
$ |
80,000 |
|
|
Ron Franklin
Vice President of Manufacturing, Petrochemical Company
|
2010
|
|
$ |
185,577 |
|
|
|
-- |
|
|
|
-- |
|
|
|
24,700 |
|
|
|
-- |
|
|
|
-- |
|
|
$ |
26,009 |
|
|
$ |
236,286 |
|
|
2009
|
|
$ |
22,115 |
|
|
|
-- |
|
|
|
-- |
|
|
|
-- |
|
|
|
-- |
|
|
|
-- |
|
|
$ |
742 |
|
|
$ |
22,857 |
|
|
2008
|
|
|
-- |
|
|
|
-- |
|
|
|
-- |
|
|
|
-- |
|
|
|
-- |
|
|
|
-- |
|
|
|
-- |
|
|
|
-- |
|
|
(a)
|
$88,904, $77,694, and $106,763 in sales commission earned by Mr. Williamson for each of the fiscal years 2010, 2009 and 2008, respectively;
|
|
(b)
|
$56,916, $57,699, and $49,773 in sales commission earned by Mr. Maldonado for each of the fiscal years 2010, 2009 and 2008, respectively;
|
|
(2)
|
Includes $31,500 in retirement bonus compensation awarded in 2009 to Mr. El Khalidi that was deferred.
|
|
(3)
|
Restricted stock option awards for fiscal year ended 2010 were granted to the participants based on their performance in fiscal year ended 2009. Restricted stock option awards include the aggregate grant date fair value of such awards granted in the fiscal year indicated computed in accordance with ASC 718. For a discussion of the assumptions we made in valuing the stock and option awards, see “Note 2—Significant Accounting Policies—Share-Based Compensation” and “Note 14—Share-Based Compensation” in the notes to our consolidated financial statements contained in our Annual Report on Form 10-K for the fiscal year ended December 31, 2010.
|
|
(4)
|
Includes $4,000 and $8,000 in termination benefits for each of the fiscal years ended December 31, 2009 and 2008, respectively, that was accrued for Mr. El Khalidi in accordance with Saudi Arabian employment laws. The total amount of accrued termination benefits due to Mr. El Khalidi as of December 31, 2010, was $42,878.
|
|
(5)
|
Includes $36,000 in accrued retirement benefits for the fiscal year ended December 31, 2009 that was deferred at the election of Mr. El Khalidi.
|
|
(a)
|
$15,000, $14,090, and $12,595 in 401(k) contributions made on behalf of Nicholas N. Carter for each of the fiscal years 2010, 2009 and 2008, respectively;
|
|
(b)
|
$8,700, $8,533, and $7, in 401(k) contributions made on behalf of Connie J. Cook for each of the fiscal years ended 2010, 2009 and 2008, respectively;
|
|
(c)
|
$15,234, $13,650, and $14,442 in 401(k) contributions made on behalf of Mark D. Williamson for each of the fiscal years ended 2010, 2009 and 2008, respectively;
|
|
(d)
|
$11,664, $11,553, and $10,749 in 401(k) contributions made on behalf of Gerardo Maldonado for each of the fiscal years ended 2010, 2009 and 2008, respectively; and
|
|
|
(e) $7,500 in 401(k) contributions made on behalf of Ron Franklin for the fiscal year ended 2010.
|
|
(a)
|
$19,884, $42,552, and $28,665 in profit sharing for Nicholas N. Carter for each of the fiscal years 2010, 2009 and 2008, respectively;
|
|
(b)
|
$18,509, $32,715, and $26,143 in profit sharing for Connie J. Cook for each of the fiscal years ended 2010, 2009 and 2008, respectively;
|
|
(c)
|
$20,446, $32,652, and $26,143 in profit sharing for Mark D. Williamson for each of the fiscal years ended 2010, 2009 and 2008, respectively;
|
|
(d)
|
$14,009, $24,437, and $14,640 in profit sharing for Gerardo Maldonado for each of the fiscal years ended 2010, 2009 and 2008, respectively; and
|
|
|
(e) $18,509 in profit sharing for Ron Franklin for the fiscal year ended 2010.
|
|
(8)
|
Includes $631 for the vehicle provided to Nicholas N. Carter in fiscal year 2010.
|
|
|
Grants of Plan-Based Awards
|
The following table presents information concerning plan-based awards granted to each of the named executive officers during 2010.
| |
|
Estimated Future Payouts
Under Non-Equity Incentive
Plan Awards
|
Estimated Future
Payouts under
Equity Incentive
Plan Awards
|
|
|
|
|
|
|
|
|
|
|
|
|
Name
|
Grant
Date
|
Threshold
($)
|
Target
($)
|
Maximum
($)
|
Threshold
(#)
|
Target
(#)
|
Maximum
(#)
|
All Other Stock Awards: Number of Shares of Stock or
Units (#)
|
|
All Other Options Awards: Number of Securities
(#)
|
|
|
Exercise Price of Options ($/sh)
|
|
|
Closing Market Price on Date of Option Grant ($/sh)
|
|
Grant Date Fair Value of Stock Awards
|
|
Nicholas
Carter (1)
|
01/28/10
|
|
|
|
|
|
|
|
|
|
30,000 |
|
|
$ |
2.21 |
|
|
$ |
2.21 |
|
|
|
Mark Williamson (1)
|
01/28/10
|
|
|
|
|
|
|
|
|
|
20,000 |
|
|
$ |
2.21 |
|
|
$ |
2.21 |
|
|
|
Connie
Cook (1)
|
01/28/10
|
|
|
|
|
|
|
|
|
|
15,000 |
|
|
$ |
2.21 |
|
|
$ |
2.21 |
|
|
|
Gerardo Maldonado (1)
|
01/28/10
|
|
|
|
|
|
|
|
|
|
7,500 |
|
|
$ |
2.21 |
|
|
$ |
2.21 |
|
|
|
Ronald Franklin (2)
|
06/22/10
|
|
|
|
|
|
|
|
|
|
10,000 |
|
|
$ |
2.47 |
|
|
$ |
2.47 |
|
|
|
(1)
|
Represents stock option grants made on January 28, 2010, to officers and key employees in the amounts shown with an exercise price equal to the closing sale price of such a share on even date. The options vest over a 2 year period with 50% vesting each year. The option life is 7 years.
|
|
(2)
|
Represents a stock option grant made on June 22, 2010 to Mr. Franklin with an exercise price equal to the closing sale price of such a share on even date. The options vest over a 2 year period with 50% vesting each year. The option life is 7 years.
|
Pension Benefits
|
Name
|
Plan name
|
|
Number of years credited service
|
|
|
Present value of accumulated benefit
($)
|
|
|
Payments during last year
($)
|
|
|
Hatem El Khalidi
President and Chief Executive Officer until June 30, 2009
|
Retirement Agreement (1)
|
|
|
42 |
|
|
$ |
851,000 |
|
|
$ |
0 |
|
|
Retirement Agreement (2)
|
|
|
42 |
|
|
$ |
31,500 |
|
|
$ |
0 |
|
|
Saudi Arabian Termination Benefits (3)
|
|
|
42 |
|
|
$ |
42,876 |
|
|
$ |
0 |
|
|
Total
|
|
|
|
|
|
|
$ |
925,376 |
|
|
$ |
0 |
|
|
(1)
|
In January 2008 the retirement agreement entered into in February 2007 with Mr. El Khalidi, then president of the Company, was modified. The new agreement provides for $6,000 per month in benefits to Mr. El Khalidi upon his retirement for the remainder of his life. Additionally, upon his death $4,000 per month will be paid to his surviving spouse for the remainder of her life. A health insurance benefit is also provided. An additional $382,000 was accrued in January 2008 for the increase in benefits. A short-term liability of $36,000 is included in accrued liabilities and a long-term liability of approximately $815,000 based upon an annuity single premium value contract was outstanding as of December 31, 2009, and is included in post retirement benefits. Assumptions used for the amortization of post retirement benefits were a life expectancy of 6.8 years for Mr. El Khalidi and 15.8 years for Ms. El Khalidi with a discount rate of 1.62%. Life expectancies were taken from the 2004 Life Table for the total U.S. population as published under the National Vital Statistics Reports. In June 2009 the Company’s Board of Directors voted to amend the retirement benefit by allowing a yearly cost of living adjustment to be applied to the agreement based upon the Consumer Price Index which is published annually. Expense recognized in relation to this adjustment was approximately $21,000 based upon the Consumer Price Index published on January 15, 2010, of 2.7%. See Note 21 – Post Retirement Obligations in our annual report on Form 10-K.
|
|
(2)
|
While there is no written policy regarding retirement bonus compensation, the Company has historically awarded all employees (regardless of job position) a retirement bonus equal to $750 for each year of service. Since Mr. El Khalidi was employed by the Company for 42 years, the Board of Directors voted to award him a $31,500 retirement bonus, consistent with that provided to all other retired employees.
|
|
(3)
|
Employer termination benefits required by the Saudi Labor and Workman Law provide for termination benefits equal to one-half month’s total compensation for each year of service for the first five years and one month’s total compensation for each subsequent year of service. Since Mr. El Khalidi was employed by the Company in Saudi Arabia for 42 years, under Saudi law the total accrued termination benefits due were $320,000 of which approximately $43,000 remained outstanding to Mr. El Khalidi as of December 31, 2010.
|
Outstanding Equity Awards at 2010 Fiscal Year-End
The following table presents information concerning outstanding equity awards held by the named executive officers as of December 31, 2010.
| |
|
Option awards
|
Stock awards
|
|
Name
|
|
Number of Securities Underlying Unexercised Options
(#) Exercisable
|
|
|
Number of Securities Underlying Unexercised Options
(#) Unexercisable
|
|
|
Equity incentive plan awards: number of securities underlying unexercised unearned options
(#)
|
|
|
Option exercise price
($)
|
|
Option Expiration date
|
Number of Shares or units of stock that have not vested
(#)
|
Market value of shares or unites of stock that have not vested
(#)
|
Equity incentive plan awards: number of unearned shares, units or other rights that have not vested (#)
|
Equity incentive plan awards: market or payout value of unearned shares, units or other rights that have not vested
($)
|
|
Hatem
El Khalidi
|
|
|
-- |
|
|
|
200,000 |
|
|
|
-- |
|
|
$ |
3.40 |
|
06/30/12
|
|
|
|
|
|
Hatem
El Khalidi
|
|
|
-- |
|
|
|
200,000 |
|
|
|
-- |
|
|
$ |
3.40 |
|
06/30/19
|
|
|
|
|
|
Nicholas
Carter
|
|
|
-- |
|
|
|
30,000 |
|
|
|
-- |
|
|
$ |
2.21 |
|
01/27/17
|
|
|
|
|
|
Mark Williamson
|
|
|
-- |
|
|
|
20,000 |
|
|
|
-- |
|
|
$ |
2.21 |
|
01/27/17
|
|
|
|
|
|
Connie
Cook
|
|
|
-- |
|
|
|
15,000 |
|
|
|
-- |
|
|
$ |
2.21 |
|
01/27/17
|
|
|
|
|
|
Gerardo Maldonado
|
|
|
-- |
|
|
|
7,500 |
|
|
|
-- |
|
|
$ |
2.21 |
|
01/27/17
|
|
|
|
|
|
Ronald Franklin
|
|
|
-- |
|
|
|
10,000 |
|
|
|
-- |
|
|
$ |
2.47 |
|
06/22/17
|
|
|
|
|
Director Compensation
The following table provides a summary of compensation earned by members of our Board during the year ended December 31, 2010.
2010 Non-Employee Director Compensation
|
Name
|
|
Fees Earned or Paid in Cash
($)(1)
|
|
|
Stock Awards
($)(2)
|
|
|
Option
Awards
($)(3)(4)
|
|
|
Total
($)
|
|
| |
|
|
|
|
|
|
|
|
|
|
|
|
|
Robert Kennedy
|
|
$ |
63,000 |
|
|
$ |
7,020 |
|
|
$ |
71,870 |
|
|
$ |
141,890 |
|
|
Ghazi Sultan
|
|
|
55,000 |
|
|
|
7,020 |
|
|
|
71,870 |
|
|
|
133,890 |
|
|
Mohammed Al Omair
|
|
|
5,000 |
|
|
|
7,020 |
|
|
|
15,470 |
|
|
|
27,490 |
|
|
Charles Goehringer, Jr.
|
|
|
18,000 |
|
|
|
7,020 |
|
|
|
71,870 |
|
|
|
96,890 |
|
|
Allen McKee
|
|
|
79,500 |
|
|
|
4,680 |
|
|
|
66,714 |
|
|
|
150,894 |
|
|
(1)
|
Includes committee fees for 2010 in the amount of $95,000, Company board fees in the amount of $60,000, subsidiary board fees for 2010 in the amount of $40,000 and per diem amounts for 2010 in the amount of $25,500.
|
|
(2)
|
Represents 3,000 shares of restricted stock granted to each non-employee director except Mr. McKee who received 2,000 shares for 2009 Board service at $2.34 per share based upon the closing price of the Company’s common stock on the restriction date lapse of July 28, 2010, with a grant date of January 28, 2010.
|
|
(3)
|
Represents 32,667 shares of stock options granted to non-employee directors for 2009 Board service at an exercise price of $2.21 per share based upon the closing price of the Company’s common stock on the grant date of January 28, 2010, and 20,000 shares of stock options granted to each non-employee director except Mr. Al Omair for 2010 Board service at an exercise price of $2.82 per share based upon the closing price of the Company’s common stock on the grant date of February 23, 2010.
|
|
(4)
|
Stock option awards include the aggregate grant date fair value of such awards granted in the fiscal year indicated computed in accordance with ASC 718. For a discussion of the assumptions we made in valuing the stock and option awards, see Note 2—Significant Accounting Policies—Share-Based Compensation and Note 14—Share-Based Compensation in the notes to our consolidated financial statements contained herein.
|
The following table presents information concerning outstanding equity awards held by the directors as of December 31, 2010.
| |
|
Option awards
|
Stock awards
|
|
Name
|
|
Number of Securities Underlying Unexercised Options
(#) Exercisable
|
|
|
Number of Securities Underlying Unexercised Options
(#) Unexercisable
|
|
|
Equity incentive plan awards: number of securities underlying unexercised unearned options
(#)
|
|
|
Option exercise price
($)
|
|
Option Expiration date
|
Number of Shares or units of stock that have not vested
(#)
|
Market value of shares or unites of stock that have not vested
(#)
|
Equity incentive plan awards: number of unearned shares, units or other rights that have not vested (#)
|
Equity incentive plan awards: market or payout value of unearned shares, units or other rights that have not vested
($)
|
|
Ghazi Sultan
|
|
|
7,000 |
|
|
|
-- |
|
|
|
-- |
|
|
$ |
1.39 |
|
01/01/19
|
|
|
|
|
|
Mohammed Al Omair
|
|
|
7,000 |
|
|
|
-- |
|
|
|
-- |
|
|
$ |
1.39 |
|
01/01/19
|
|
|
|
|
|
Robert Kennedy
|
|
|
7,000 |
|
|
|
-- |
|
|
|
-- |
|
|
$ |
1.39 |
|
01/01/19
|
|
|
|
|
|
Charles Goehringer, Jr.
|
|
|
7,000 |
|
|
|
-- |
|
|
|
-- |
|
|
$ |
1.39 |
|
01/01/19
|
|
|
|
|
|
Ghazi Sultan
|
|
|
7,000 |
|
|
|
-- |
|
|
|
-- |
|
|
$ |
2.21 |
|
01/27/20
|
|
|
|
|
|
Mohammed Al Omair
|
|
|
7,000 |
|
|
|
-- |
|
|
|
-- |
|
|
$ |
2.21 |
|
01/27/20
|
|
|
|
|
|
Robert Kennedy
|
|
|
7,000 |
|
|
|
-- |
|
|
|
-- |
|
|
$ |
2.21 |
|
01/27/20
|
|
|
|
|
|
Charles Goehringer, Jr.
|
|
|
7,000 |
|
|
|
-- |
|
|
|
-- |
|
|
$ |
2.21 |
|
01/27/20
|
|
|
|
|
|
Allen P. McKee
|
|
|
4,667 |
|
|
|
-- |
|
|
|
-- |
|
|
$ |
2.21 |
|
01/27/20
|
|
|
|
|
|
Ghazi Sultan
|
|
|
-- |
|
|
|
20,000 |
|
|
|
80,000 |
|
|
$ |
2.82 |
|
02/22/20
|
|
|
|
|
|
Mohammed Al Omair
|
|
|
-- |
|
|
|
-- |
|
|
|
80,000 |
|
|
$ |
2.82 |
|
02/22/20
|
|
|
|
|
|
Robert Kennedy
|
|
|
-- |
|
|
|
20,000 |
|
|
|
80,000 |
|
|
$ |
2.82 |
|
02/22/20
|
|
|
|
|
|
Charles Goehringer, Jr.
|
|
|
-- |
|
|
|
20,000 |
|
|
|
80,000 |
|
|
$ |
2.82 |
|
02/22/20
|
|
|
|
|
|
Allen P. McKee
|
|
|
-- |
|
|
|
20,000 |
|
|
|
80,000 |
|
|
$ |
2.82 |
|
02/22/20
|
|
|
|
|
General
A director who is one of our employees receives no additional compensation for his service as a director or as a member of a committee of the Board. A director who is not one of our employees (a non-employee director) receives compensation for his or her services as described in the following paragraphs per the current policy and upon recommendation by the Compensation Committee and approval by the Board. Directors are reimbursed for reasonable expenses incurred in connection with attendance at Board and Committee meetings.
Board Compensation
The 2010 directors’ fees policy as recommended by the Compensation Committee proposed annual cash stipends for members of the AADC Board in the amount of $15,000/year and subsidiary boards of the Company in the amount of $5,000/year for U.S. subsidiaries and $10,000/year for AMAK’s Board. These amounts are to be prorated based upon time of service. These payments were approved by the Board on February 23, 2010.
Approximately $6,900 was accrued as directors’ compensation expense for 2009.
Committee Compensation
The 2010 directors’ fees policy as recommended by the Compensation Committee proposed annual cash stipends for members of the Audit Committee in the amount of $15,000, the Compensation Committee in the amount of $10,000, and the Nominating Committee in the amount of $5,000. These amounts are to be prorated based upon time of service. These payments were approved by the Board on February 23, 2010.
Approximately $92,000 was accrued as directors’ compensation expense for 2009.
Equity Compensation
The 2010 directors’ fees policy as recommended by the Compensation Committee proposed the grant of 100,000 stock options (20,000 per year) – to be vested over 5 years and to be awarded in the quarter following the end of the year to non-employee directors who had attended at least 75% of all called meetings during the year and were serving in full capacity on December 31st of that year. This grant is to be prorated based upon time of service. This grant was approved on February 23, 2010 by the Board of Directors.
Per Diem Compensation
The 2010 directors’ fees policy allowed per diem payments of $500 per day for non-employee directors who travel to conduct Board business. Approximately $25,500 was paid for directors’ compensation expense related to per diem in 2010.
Approximately $10,500 was paid for directors’ compensation expense related to per diem in 2009.
Potential Payments upon Termination or Change in Control
There are no potential payments owed to our executives based upon termination of employment or change in control of the Company.
Compensation Committee Interlocks and Insider Participation
No member of the Compensation Committee is or has been an executive officer of our Company or had any relationships requiring disclosure by us under the SEC’s rules requiring disclosure of certain relationships and related-party transactions. None of our executive officers served as a director or a member of a compensation committee (or other committee serving an equivalent function) of any other entity, the executive officers of which served as a director or member of the Compensation Committee during the fiscal year ended December 31, 2010.
Security Ownership of Certain Beneficial Owners
The following table sets forth, as of December 31, 2010, information regarding each person, or group of affiliated persons, we know to be a beneficial owner of more than five percent of the Company’s Common Stock.
|
Name and Address
Of Beneficial Owner
|
|
Amount and Nature of
Beneficial
Ownership (1)(2)
|
|
Percent
of Class
|
|
Fahad Mohammed Saleh Al Athel
c/o Saudi Fal
P. O. Box 4900
Riyadh, Saudi Arabia 11412
|
|
3,995,745
|
|
16.7%
|
|
Wellington Trust Company, NA
Wellington Management Company, LP
75 State Street
Boston, MA 02109
|
|
2,049,524
|
|
8.6%
|
|
Prince Talal Bin Abdul Aziz
P. O. Box 930
Riyadh, Saudi Arabia
|
|
1,272,680
|
|
5.3%
|
| |
|
|
|
|
|
(1)
|
Unless otherwise indicated, to the knowledge of the Company, all shares are owned directly and the owner has sole voting and investment power.
|
|
(2)
|
Wellington Trust Company, NA and Wellington Management Company, LP filed with the Commission on February 14, 2011, reporting that they or certain of their affiliates beneficially owned an aggregate of 2,049,524 shares and that they had shared voting power and shared dispositive power with respect to those shares.
|
Based on its stock ownership records, the Company believes that, as of December 31, 2010, Saudi Arabian stockholders held approximately 40% of the Company’s outstanding Common Stock, without giving effect to the exercise of presently exercisable stock options held by certain of such stockholders. Accordingly, if all or any substantial part of the Saudi Arabian stockholders were considered as a group, they could be deemed to “control” the Company as that term is defined in regulations promulgated by the SEC.
The management of the Company has welcomed the substantial stock investment by its Saudi stockholders. Saudi investors have contributed vitally needed capital to the Company since 1974. Whether the Company’s Saudi stockholders will be a continuing source of future capital is unknown at this time. In confronting the need for additional funds, management of the Company will follow the policy of considering all potential sources consistent with prudent business practice and the best interests of all its stockholders. In the course of considering methods of future financing and other matters relating to the operations of the Company, management of the Company anticipates that in the ordinary course of business it will receive recommendations and suggestions from its principal stockholders.
Security Ownership of Management
The following table sets forth, as of December 31, 2010, information concerning the beneficial ownership of the Company’s common stock by each director, each executive officer named in the Summary Compensation Table and by all executive officers and directors as a group, based on information furnished by them to us.
Beneficial ownership as reported in the table below has been determined in accordance with SEC regulations and includes shares of common stock which may be acquired within 60 days after December 31, 2010, upon the exercise of outstanding stock options. As of December 31, 2010, Mr. Carter beneficially owned 1% or more of our common stock.
|
Name of Beneficial Owner
|
|
Amount and Nature of
Beneficial
Ownership (1)
|
|
Percent
of Class
|
|
Ghazi Sultan
|
|
130,000 (2)(3)
|
|
0.5%
|
|
Nicholas N. Carter
|
|
472,768(3)
|
|
2.0%
|
|
Charles W. Goehringer, Jr.
|
|
73,967(2)(3)
|
|
0.3%
|
|
Robert E. Kennedy.
|
|
50,000(2)(3)
|
|
0.2%
|
|
Mohammed O. Al Omair.
|
|
41,667(2)(3)
|
|
0.2%
|
|
Allen P. McKee.
|
|
49,667(2)(3)
|
|
0.2%
|
|
Connie J. Cook.
|
|
40,350(3)
|
|
0.2%
|
|
Mark Williamson.
|
|
30,000(3)
|
|
0.1%
|
|
Gerardo Maldonado.
|
|
3,750(3)
|
|
0.0%
|
|
Ronald Franklin.
|
|
2,028
|
|
0.0%
|
|
All directors and executive officers as a group (10 persons)
|
|
894,197(3)
|
|
3.7%
|
|
(1)
|
Unless otherwise indicated, to the knowledge of the Company, all shares are owned directly and the owner has sole voting and investment power. Includes shares of restricted stock.
|
|
(2)
|
Includes 71,667 shares which these directors have the right to acquire through the exercise of presently exercisable stock options.
|
|
(3)
|
Includes 196,917 shares which certain directors and executive officers have the right to acquire through the exercise of stock options or other rights exercisable presently or within 60 days.
|
We are unaware of any arrangements which may at a subsequent date result in a change in control.
Transactions with Related Persons
The Company directly owns approximately 55% of the outstanding capital stock of PEVM. Mr. Carter is currently a director and President of PEVM, and Mr. Charles Goehringer, Jr. is currently a director of PEVM. The Company is providing funds necessary to cover the PEVM operations. During 2010 and 2009, the Company advanced approximately $18,000 and $34,000, respectively, for such purposes. As of December 31, 2010, PEVM owed the Company $319,794 as a result of advances made by the Company. The indebtedness is secured by real estate but bears no interest.
On November 30, 2010, the Company entered into a Letter of Intent and Agreement and Plan of Reorganization with STTC owned by Nicholas N. Carter, the President and CEO of the Company, pursuant to which SHTI, a Delaware
corporation and an indirectly wholly owned subsidiary of the Company, acquired 100% of the common stock of STTC. The acquisition was completed on November 30, 2010 and the Company plans in 2011 to merge STTC into South Hampton, an indirectly wholly owned subsidiary of the Company with South Hampton as the surviving corporation. Prior to the acquisition of STTC, South Hampton leased transportation related equipment from STTC pursuant to a Master Lease Agreement dated February 3, 2009, which was set to expire in May 2014. The purpose of the acquisition of STTC was the acquisition of various transportation related assets from STTC that are important to South Hampton’s operations and termination of a related-party transaction and lease agreement. The Company acquired STTC in exchange for the payment to Mr. Carter of (i) cash of $250,000, (ii) a note payable in the amount of $300,000 and (iii) 232,170 shares of the Company’s common stock having a fair value of $775,448.
During 2010 South Hampton incurred product transportation and equipment costs of approximately $848,000 with STTC, a private equipment leasing provider in which Mr. Carter, President and CEO of the Company, had a 100% equity interest until November 30, 2010, at which time STTC was purchased by the Company. Pursuant to the lease agreement, South Hampton leased transportation equipment from STTC. Lease payments during 2010 were approximately $79,178 per month through November. Under the lease arrangement, STTC provided transportation equipment and all normal maintenance on such equipment and South Hampton provided drivers, fuel, management of transportation operations and insurance on the transportation equipment. Approximately 95% of STTC’s income was derived from such lease arrangement. South Hampton entered into a new lease agreement with STTC on February 3, 2009 which was subsequently cancelled as the result of the Company’s November 30, 2010 acquisition of STTC as discussed above.
Ghazi Sultan, a member of the Company's Board, was paid $18,000 during 2010 for serving as the Company's Saudi branch representative in 2010.
Review, Approval or Ratification of Transactions with Management and Others
The Company’s Code of Ethics for Senior Financial Officers addresses conflicts of interest and is available on our website. Our principal executive officer, principal financial officer, principal accounting officer and controller, and persons performing similar functions are required to abide by this code by avoiding activities that conflict with, or are reasonably likely to conflict with, the best interests of the Company and its stockholders. Personal activities, interests, or relationships that would or could negatively influence judgment, decisions, or actions must be disclosed to the Board with prompt and full disclosure for Board review and/or action. We also solicit information from our directors and executive officers annually in connection with preparation of disclosures in our proxy statement. These questionnaires specifically seek information pertaining to any “related-person” transaction.
The Company’s Amended and Restated Audit Committee Charter provides that the Audit Committee, comprised of independent directors, will review and if appropriate approve all related party transactions. During 2010 the Audit Committee adopted a written policy addressing related party transactions. A copy of this policy is contained on our website.
Director Independence
The Board presently has one member of management, Nicholas Carter (CEO, President, and Chairman of the Board), and 5 non-management directors. The Company has implemented a policy that a majority of the Board will consist of independent directors as required by the NASDAQ Stock Market Rule 5605(b)(1). The Board determined that the following directors met the independence standard; Ghazi Sultan, Mohammed Al Omair, Robert Kennedy, and Allen McKee.
The Board’s Audit, Compensation and Nominating Committees are composed entirely of directors who meet the independence requirements. Each member of the Audit Committee also meets the additional independence standards for Audit Committee members set forth in regulations of the SEC.
On June 21, 2010, the Audit Committee approved changing from Travis Wolff, LLP to BKM Sowan Horan, LLP as the Company’s new auditors. The table below sets forth the fees that BKM Sowan Horan, LLP and Travis Wolff, LLP billed the Company for the audit of its financial statements for the fiscal years ended December 31, 2010 and 2009 and the review of its financial statements for the quarterly periods in the year ended December 31, 2010, and 2009, and all
other fees BKM Sowan Horan, LLP and Travis Wolff, LLP billed the Company for services rendered during the fiscal years ended December 31, 2010 and December 31, 2009, respectively:
| |
|
2010
|
|
|
2009
|
|
|
Audit Fees
|
|
$ |
262,117 |
|
|
$ |
258,477 |
|
|
Audit-Related Fees
|
|
$ |
0 |
|
|
$ |
0 |
|
|
Tax Fees
|
|
$ |
30,649 |
|
|
$ |
41,884 |
|
|
All Other Fees *
|
|
$ |
135,777 |
|
|
$ |
45,232 |
|
*Includes fees for providing consent on Form S-3 registration filing, auditing the Company’s 401(k) plan, and reviewing Company responses to SEC comment letters.
Under its charter, the Audit Committee must pre-approve all auditing services and permitted non-audit services (including the fees and terms thereof) to be performed for the Company by its independent auditor, subject to the de minimis exceptions for non-audit services under the Securities Exchange Act of 1934, as amended, which are approved by the Audit Committee prior to the completion of the audit. The Audit Committee may delegate authority to grant pre-approvals of audit and permitted non-audit services to subcommittees, provided that decisions of the subcommittee to grant pre-approvals must be presented to the full Audit Committee at its next scheduled meeting. During 2010 each new engagement of BKM Horan Sowan, LLP and Travis Wolff, LLP was approved in advance by the Audit Committee.
(a)1. The following financial statements are filed with this Report:
|
|
Reports of Independent Registered Public Accounting Firm
|
|
|
Consolidated Balance Sheets dated December 31, 2010 and 2009
|
|
|
Consolidated Statements of Operations for the three years ended December 31, 2010
|
|
|
Consolidated Statement of Stockholders’ Equity for the three years ended December 31, 2010
|
|
|
Consolidated Statements of Cash Flows for the three years ended December 31, 2010
|
|
|
Notes to Consolidated Financial Statements
|
2. The following financial statement schedules are filed with this Report:
|
|
Schedule II -- Valuation and Qualifying Accounts for the three years ended December 31, 2010.
|
3. The following documents are filed or incorporated by reference as exhibits to this Report. Exhibits marked with an asterisk (*) are management contracts or a compensatory plan, contract or arrangement.
|
Exhibit
Number
|
Description
|
|
3(a)
|
- Certificate of Incorporation of the Company as amended through the Certificate of Amendment filed with the Delaware Secretary of State on July 19, 2000 (incorporated by reference to Exhibit 3(a) to the Company’s Annual Report on Form 10-K for the year ended December 31, 2000 (File No. 0-6247))
|
|
3(b)
|
- Restated Bylaws of the Company dated April 26, 2007 (incorporated by reference to Item 5.03 to the Company’s Form 8-K dated April 26, 2007 (File No. 0-6247))
|
|
10(a)
|
- Loan Agreement dated January 24, 1979 between the Company, National Mining Company and the Government of Saudi Arabia (incorporated by reference to Exhibit 10(b) to the Company’s Annual Report on Form 10-K for the year ended December 31, 1999 (File No. 0-6247))
|
|
Exhibit
Number
|
Description
|
|
10(b)
|
- Mining Lease Agreement effective May 22, 1993 by and between the Ministry of Petroleum and Mineral Resources and the Company (incorporated by reference to Exhibit 10(c) to the Company’s Annual Report on Form 10-K for the year ended December 31, 1999 (File No. 0-6247))
|
|
10(c)
|
- Equipment Lease Agreement dated November 14, 2003, between Silsbee Trading and Transportation Corp. and South Hampton Refining Company (incorporated by reference to Exhibit 10(o) to the Company’s Annual Report on Form 10-K for the year ended December 31, 2003 (File No. 0-6247))
|
|
10(d)
|
- Addendum to Equipment Lease Agreement dated August 1, 2004, between Silsbee Trading and Transportation Corp. and South Hampton Refining Company (incorporated by reference to Exhibit 10(q) to the Company’s Quarterly Report on Form 10-Q for the quarter ended September 30, 2004 (File No. 0-6247))
|
|
10(e)
|
- Partnership Agreement dated August 6, 2006 between Arabian American Development Company, Thamarat Najran Company, Qasr Al-Ma’adin Corporation, and Durrat Al-Masani’ Corporation (incorporated by reference to Exhibit 10(i) to the Company’s Quarterly Report on Form 10-Q/A for the quarter ended September 30, 2006 (file No. 0-6247))
|
|
10(f)
|
- Financial Legal Service and Advice Agreement dated August 5, 2006 between Arabian American Development Company, Nassir Ali Kadasa, and Dr. Ibrahim Al-Mounif. (incorporated by reference to Exhibit 10(j) to the Company’s Quarterly Report on Form 10-Q for the quarter ended September 30, 2006 (file No. 0-6247))
|
|
10(g)*
|
- Retirement Awards Program dated January 15, 2008 between Arabian American Development Company and Hatem El Khalidi (incorporated by reference to Exhibit 10(h) to the Company’s Quarterly Report on Form 10-Q for the quarter ended March 31, 2008 (file No. 001-33926))
|
|
10(h)*
|
- Stock Option Plan of Arabian American Development Company for Key Employees adopted April 7, 2008 (incorporated by reference to Exhibit A to the Company’s Form DEF 14A filed April 30, 2008 (file No. 001-33926))
|
|
10(i)*
|
- Arabian American Development Company Non-Employee Director Stock Option Plan adopted April 7, 2008 (incorporated by reference to Exhibit B to the Company’s Form DEF 14A filed April 30, 2008 (file No. 001-33926))
|
|
10(j)
|
- Master Lease Agreement dated February 3, 2009, between Silsbee Trading and Transportation Corp. and South Hampton Resources, Inc. (incorporated by reference to Exhibit 10(j) to the Company’s Quarterly Report on Form 10-Q for the quarter ended March 31, 2009 (file No. 001-33926))
|
|
10(k)
|
- Memorandum of Understanding relating to formation of AMAK, dated May 21, 2006 (incorporated by reference to Exhibit 10(k) to the Company’s Annual Report on Form 10-K for the year ended December 31, 2009 (file No. 001-33926))
|
|
10(l)
|
- Memorandum of Understanding relating to formation of AMAK, dated June 10, 2006 (incorporated by reference to Exhibit 10(l) to the Company’s Annual Report on Form 10-K for the year ended December 31, 2009 (file No. 001-33926))
|
|
Exhibit
Number
|
Description
|
|
10(m)
|
- Articles of Association of Al Masane Al Kobra Mining Company, dated July 10, 2006 (incorporated by reference to Exhibit 10(m) to the Company’s Annual Report on Form 10-K for the year ended December 31, 2009 (file No. 001-33926))
|
|
10(n)
|
- Bylaws of Al Masane Al Kobra Mining Company (incorporated by reference to Exhibit 10(n) to the Company’s Annual Report on Form 10-K for the year ended December 31, 2009 (file No. 001-33926))
|
|
10(o)
|
- Letter Agreement dated August 5, 2009, between Arabian American Development Company and the other Al Masane Al Kobra Company shareholders named therein (incorporated by reference to Exhibit 10.1 to the Company’s Form 8-K filed on August 27, 2009 (file No. 001-33926))
|
|
10(p)
|
- Letter of Intent dated November 30, 2010, between South Hampton Transportation, Inc. and Silsbee Trading and Transportation Corp (incorporated by reference to Exhibit 10.1 to the Company’s Form 8-K filed on December 2, 2010 (file No. 001-33926))
|
|
10(q)
|
- Agreement and Plan of Reorganization dated November 30, 2010, between Arabian American Development Company and the Saudi Industrial Development Fund (incorporated by reference to Exhibit 10.1 to the Company’s Form 8-K filed on October 27, 2010 (file No. 001-33926))
|
|
10(r)
|
- Limited Guarantee dated October 24 30, 2010, between South Hampton Transportation, Inc. and Silsbee Trading and Transportation Corp (incorporated by reference to Exhibit 2.01 to the Company’s Form 8-K filed on December 2, 2010 (file No. 001-33926))
|
|
14
|
- Code of Ethics for Senior Financial Officers (incorporated by reference to Exhibit 14 to the Company’s Annual Report on Form 10-K for the year ended December 31, 2003 (File No. 0-6247))
|
|
16
|
- Letter re change in certifying accountant (incorporated by reference to Exhibit 16.1 to the Company’s Current Report on Form 8-K dated June 21, 2010 (File No. 001-33926))
|
|
21
|
- Subsidiaries
|
|
23.1
|
- Consents of Independent Registered Public Accounting Firms
|
|
24
|
- Power of Attorney (set forth on the signature page hereto).
|
|
31.1
|
- Certification of Chief Executive Officer pursuant to Rule 13A-14(A) of the Securities Exchange Act of 1934
|
|
31.2
|
- Certification of Chief Accounting Officer pursuant to Rule 13A-14(A) of the Securities Exchange Act of 1934
|
|
32.1
|
- Certification of Chief Executive Officer pursuant to 18 U.S.C. Section 1350, as adopted pursuant to Section 906 of the Sarbanes-Oxley Act of 2002
|
|
32.2
|
- Certification of Chief Accounting Officer pursuant to 18 U.S.C. Section 1350, as adopted pursuant to Section 906 of the Sarbanes-Oxley Act of 2002
|
|
(b)
|
Exhibits required by Regulation 601 S-K
|
See (a) 3 of this Item 15
|
(c)
|
Financial Statement Schedules
|
See (a) 2 of this Item 15
POWER OF ATTORNEY
KNOW ALL MEN BY THESE PRESENTS that each of Arabian American Development Company, a Delaware corporation, and the undersigned directors and officers of Arabian American Development Company, hereby constitutes and appoints Nicholas Carter its or his true and lawful attorney-in-fact and agent, for it or him and in its or his name, place and stead, in any and all capacities, with full power to act alone, to sign any and all amendments to this Report, and to file each such amendment to the Report, with all exhibits thereto, and any and all other documents in connection therewith, with the Securities and Exchange Commission, hereby granting unto said attorney-in-fact and agent full power and authority to do and perform any and all acts and things requisite and necessary to be done in and about the premises as fully to all intents and purposes as it or he might or could do in person, hereby ratifying and confirming all that said attorney-in-fact and agent may lawfully do or cause to be done by virtue hereof.
SIGNATURES
Pursuant to the requirements of Section 13 or 15(d) of the Securities Exchange Act of 1934, the Registrant has duly caused this Report to be signed on its behalf by the undersigned, thereunto duly authorized.
ARABIAN AMERICAN DEVELOPMENT COMPANY
Dated: March 18, 2011 By:/s/ Nicholas Carter
Nicholas Carter
President and Chief Executive Officer
Pursuant to the requirements of the Securities Exchange Act of 1934, this Report has been signed below by the following persons on behalf of the Registrant in the capacities indicated on March 18, 2011.
|
Signature
|
Title
|
|
/s/ Nicholas Carter
Nicholas Carter
|
President, Chief Executive Officer and Director (principal executive officer)
|
|
/s/ Connie Cook
Connie Cook
|
Chief Accounting Officer
(principal financial and accounting officer)
|
|
/s/ Charles Goehringer, Jr.
Charles Goehringer, Jr.
|
Director
|
|
/s/ Robert Kennedy
Robert Kennedy
|
Director
|
|
/s/ Ghazi Sultan
Ghazi Sultan
|
Director
|
|
/s/ Allen McKee
Allen McKee
|
Director
|
|
/s/ Mohammed Al Omair
Mohammed Al Omair
|
Director
|
|
/s/ John R. Townsend
John R. Townsend
|
Director
|
|
|
Page
|
|
|
F-2
|
| |
|
|
|
F-3
|
| |
|
|
|
F-4
|
| |
|
|
|
F-6
|
| |
|
|
|
F-7
|
| |
|
|
|
F-8
|
| |
|
|
|
F-10
|
| |
|
|
INDEX TO FINANCIAL STATEMENT SCHEDULES
|
|
| |
|
|
|
F-34
|
To the Board of Directors
Arabian American Development Company and Subsidiaries
We have audited the accompanying consolidated balance sheet of Arabian American Development Company and Subsidiaries (the Company) as of December 31, 2010, and the related consolidated statements of income, stockholders’ equity and comprehensive income, and cash flows for year then ended. Our audit also includes the financial statement schedule listed in the index at Item 15(a). These consolidated financial statements and schedule are the responsibility of the Company’s management. Our responsibility is to express an opinion on these consolidated financial statements based on our audit.
We conducted our audit in accordance with the standards of the Public Company Accounting Oversight Board (United States). Those standards require that we plan and perform the audit to obtain reasonable assurance about whether the financial statements are free of material misstatement. The Company is not required to have, nor were we engaged to perform, an audit of its internal control over financial reporting. Our audit included consideration of internal control over financial reporting as a basis for designing audit procedures that are appropriate in the circumstances, but not for the purpose of expressing an opinion on the effectiveness of the Company’s internal control over financial reporting. Accordingly, we express no such opinion. An audit also includes examining, on a test basis, evidence supporting the amounts and disclosures in the financial statements, assessing the accounting principles used and significant estimates made by management, as well as evaluating the overall financial statement presentation. We believe that our audit provides a reasonable basis for our opinion.
In our opinion, the consolidated financial statements referred to above present fairly, in all material respects, the financial position of Arabian American Development Company as of December 31, 2010, and the results of its operations and its cash flows for the year then ended in conformity with accounting principles generally accepted in the United States of America.
|
/s/ BKM Sowan Horan, LLP
Addison, Texas
March 18, 2010
|
Board of Directors
Arabian American Development Company
Dallas, Texas
We have audited the accompanying consolidated balance sheet of Arabian American Development Company and Subsidiaries (the Company) as of December 31, 2009, and the related consolidated statements of operations, stockholders’ equity, and cash flows for each of the years in the two-year period ended December 31, 2009. Our audits also included the financial statement schedule listed in the index at Item 15(a). These consolidated financial statements and schedule are the responsibility of the Company’s management. Our responsibility is to express an opinion on these consolidated financial statements and schedule based on our audits.
We conducted our audits in accordance with the standards of the Public Company Accounting Oversight Board (United States). Those standards require that we plan and perform the audit to obtain reasonable assurance about whether the financial statements and schedule are free of material misstatement. An audit includes examining, on a test basis, evidence supporting the amounts and disclosures in the financial statements. An audit also includes assessing the accounting principles used and significant estimates made by management, as well as evaluating the overall financial statement presentation. We believe that our audits provide a reasonable basis for our opinion.
In our opinion, the consolidated financial statements referred to above present fairly, in all material respects, the consolidated financial position of Arabian American Development Company and Subsidiaries as of December 31, 2009, and the consolidated results of its operations and its cash flows for each of the years in the two-year period ended December 31, 2009 in conformity with accounting principles generally accepted in the United States of America. Also in our opinion, the related financial statement schedule, when considered in relation to the basic financial statements taken as a whole, presents fairly, in all material respects, the information set forth therein.
/s/Travis Wolff, LLP
Dallas, Texas
March 15, 2010,
(except as to Note 8 which is as of May 11, 2010)
| |
|
December 31,
|
|
| |
|
2010
|
|
|
2009
|
|
|
ASSETS
|
|
|
|
|
|
|
|
CURRENT ASSETS
|
|
|
|
|
|
|
|
Cash and cash equivalents
|
|
$ |
7,609,943 |
|
|
$ |
2,451,614 |
|
|
Financial contracts
|
|
|
177,446 |
|
|
|
- |
|
|
Trade receivables, net of allowance for doubtful accounts of $155,000 and $126,500, respectively
|
|
|
11,212,290 |
|
|
|
12,302,955 |
|
|
Current portion of notes receivable, net of discount of $684 and $16,109, respectively (Note 6)
|
|
|
34,427 |
|
|
|
372,387 |
|
|
Prepaid expenses and other assets
|
|
|
669,367 |
|
|
|
739,989 |
|
|
Contractual based intangible assets (Note 1)
|
|
|
250,422 |
|
|
|
- |
|
|
Inventories (Note 5)
|
|
|
5,917,283 |
|
|
|
5,065,169 |
|
|
Deferred income taxes (Note 15)
|
|
|
487,513 |
|
|
|
640,057 |
|
|
Taxes receivable (Note 15)
|
|
|
216,461 |
|
|
|
4,726,708 |
|
| |
|
|
|
|
|
|
|
|
|
Total current assets
|
|
|
26,575,152 |
|
|
|
26,298,879 |
|
| |
|
|
|
|
|
|
|
|
|
PLANT, PIPELINE, AND EQUIPMENT – AT COST
|
|
|
54,703,710 |
|
|
|
50,082,441 |
|
|
LESS ACCUMULATED DEPRECIATION
|
|
|
(20,839,442 |
) |
|
|
(17,674,938 |
) |
| |
|
|
|
|
|
|
|
|
|
PLANT, PIPELINE, AND EQUIPMENT, NET (Note 7)
|
|
|
33,864,268 |
|
|
|
32,407,503 |
|
| |
|
|
|
|
|
|
|
|
|
INVESTMENT IN AMAK (Note 8)
|
|
|
30,883,657 |
|
|
|
31,146,157 |
|
|
MINERAL PROPERTIES IN THE UNITED STATES (Note 9)
|
|
|
588,311 |
|
|
|
588,311 |
|
|
NOTES RECEIVABLE, net of discount of $0 and $684, respectively, net of current portion (Note 6)
|
|
|
- |
|
|
|
35,001 |
|
|
CONTRACTUAL BASED INTANGIBLE ASSETS, net of current portion (Note 1)
|
|
|
605,185 |
|
|
|
- |
|
|
OTHER ASSETS
|
|
|
10,938 |
|
|
|
10,938 |
|
| |
|
|
|
|
|
|
|
|
|
TOTAL ASSETS
|
|
$ |
92,527,511 |
|
|
$ |
90,486,789 |
|
See notes to the consolidated financial statements.
ARABIAN AMERICAN DEVELOPMENT COMPANY AND SUBSIDIARIES
CONSOLIDATED BALANCE SHEETS - Continued
| |
|
December 31,
|
|
| |
|
2010
|
|
|
2009
|
|
|
LIABILITIES
|
|
|
|
|
|
|
|
CURRENT LIABILITIES
|
|
|
|
|
|
|
|
Accounts payable
|
|
$ |
2,778,161 |
|
|
$ |
3,617,043 |
|
|
Accrued interest
|
|
|
120,533 |
|
|
|
148,538 |
|
|
Current portion of derivative instruments (Notes 4 and 20)
|
|
|
396,527 |
|
|
|
436,203 |
|
|
Accrued liabilities (Note 11)
|
|
|
1,777,642 |
|
|
|
1,336,219 |
|
|
Accrued liabilities in Saudi Arabia (Note 12)
|
|
|
184,593 |
|
|
|
471,280 |
|
|
Notes payable
|
|
|
12,000 |
|
|
|
12,000 |
|
|
Current portion of post retirement benefit (Note 21)
|
|
|
246,605 |
|
|
|
31,500 |
|
|
Current portion of long-term debt (Note 10)
|
|
|
1,864,770 |
|
|
|
1,400,000 |
|
|
Current portion of other liabilities
|
|
|
199,939 |
|
|
|
579,500 |
|
| |
|
|
|
|
|
|
|
|
|
Total current liabilities
|
|
|
7,580,770 |
|
|
|
8,032,283 |
|
| |
|
|
|
|
|
|
|
|
|
LONG-TERM DEBT, net of current portion (Note 10)
|
|
|
20,836,098 |
|
|
|
23,439,488 |
|
|
POST RETIREMENT BENEFIT, net of current portion (Note 21)
|
|
|
680,196 |
|
|
|
815,378 |
|
| |
|
|
|
|
|
|
|
|
|
DERIVATIVE INSTRUMENTS, net of current portion (Notes 4 and 20)
|
|
|
719,693 |
|
|
|
838,489 |
|
|
OTHER LIABILITIES, net of current portion
|
|
|
390,232 |
|
|
|
562,011 |
|
|
DEFERRED INCOME TAXES (Note 15)
|
|
|
5,480,683 |
|
|
|
4,332,911 |
|
| |
|
|
|
|
|
|
|
|
|
Total liabilities
|
|
|
35,687,672 |
|
|
|
38,020,560 |
|
| |
|
|
|
|
|
|
|
|
|
COMMITMENTS AND CONTINGENCIES (Note 13)
|
|
|
|
|
|
|
|
|
| |
|
|
|
|
|
|
|
|
|
EQUITY
|
|
|
|
|
|
|
|
|
|
Common Stock - authorized 40,000,000 shares of $.10 par value; issued and outstanding, 23,682,915 and 23,433,995 shares
in 2010 and 2009, respectively
|
|
|
2,368,291 |
|
|
|
2,343,399 |
|
|
Additional Paid-in Capital
|
|
|
43,162,641 |
|
|
|
41,604,168 |
|
|
Accumulated Other Comprehensive Loss
|
|
|
(736,706 |
) |
|
|
(841,297 |
) |
|
Retained Earnings
|
|
|
11,756,390 |
|
|
|
9,070,736 |
|
|
Total Arabian American Development Company Stockholders’ Equity
|
|
|
56,550,616 |
|
|
|
52,177,006 |
|
|
Noncontrolling interest
|
|
|
289,223 |
|
|
|
289,223 |
|
|
Total equity
|
|
|
56,839,839 |
|
|
|
52,466,229 |
|
|
|
|
|
|
|
|
|
|
|
|
TOTAL LIABILITIES AND EQUITY
|
|
$ |
92,527,511 |
|
|
$ |
90,486,789 |
|
See notes to the consolidated financial statements.
For the years ended December 31,
| |
|
2010
|
|
|
2009
|
|
|
2008
|
|
|
Revenues
|
|
|
|
|
|
|
|
|
|
|
Petrochemical product sales
|
|
$ |
133,579,088 |
|
|
$ |
109,178,541 |
|
|
$ |
130,264,329 |
|
|
Transloading sales
|
|
|
853,636 |
|
|
|
4,624,681 |
|
|
|
20,238,841 |
|
|
Processing
|
|
|
4,677,470 |
|
|
|
3,783,457 |
|
|
|
4,127,064 |
|
| |
|
|
139,110,194 |
|
|
|
117,586,679 |
|
|
|
154,630,234 |
|
|
Operating costs and expenses
|
|
|
|
|
|
|
|
|
|
|
|
|
|
Cost of petrochemical product sales and Processing (including depreciation of $2,271,408, $2,246,309, and $1,299,580,
respectively)
|
|
|
121,894,912 |
|
|
|
95,688,819 |
|
|
|
159,226,896 |
|
|
Gross Profit (Loss)
|
|
|
17,215,282 |
|
|
|
21,897,860 |
|
|
|
(4,596,662 |
) |
| |
|
|
|
|
|
|
|
|
|
|
|
|
|
General and Administrative Expenses
|
|
|
|
|
|
|
|
|
|
|
|
|
|
General and administrative
|
|
|
10,930,141 |
|
|
|
9,144,710 |
|
|
|
9,034,366 |
|
|
Depreciation
|
|
|
433,372 |
|
|
|
443,538 |
|
|
|
331,703 |
|
| |
|
|
11,363,513 |
|
|
|
9,588,248 |
|
|
|
9,366,069 |
|
| |
|
|
|
|
|
|
|
|
|
|
|
|
|
Operating income (loss)
|
|
|
5,851,769 |
|
|
|
12,309,612 |
|
|
|
(13,962,731 |
) |
| |
|
|
|
|
|
|
|
|
|
|
|
|
|
Other income (expense)
|
|
|
|
|
|
|
|
|
|
|
|
|
|
Interest income
|
|
|
16,184 |
|
|
|
63,669 |
|
|
|
204,635 |
|
|
Interest expense
|
|
|
(1,132,968 |
) |
|
|
(1,327,530 |
) |
|
|
(605,254 |
) |
|
Equity in loss from AMAK (Note 8)
|
|
|
(262,500 |
) |
|
|
-- |
|
|
|
(1,856,250 |
) |
|
Miscellaneous income (expense)
|
|
|
(84,015 |
) |
|
|
(74,332 |
) |
|
|
4,165 |
|
| |
|
|
(1,463,299 |
) |
|
|
(1,338,193 |
) |
|
|
(2,252,704 |
) |
|
Income (loss) before income tax expense (benefit)
|
|
|
4,388,470 |
|
|
|
10,971,419 |
|
|
|
(16,215,435 |
) |
| |
|
|
|
|
|
|
|
|
|
|
|
|
|
Income tax expense (benefit)
|
|
|
1,702,816 |
|
|
|
4,343,968 |
|
|
|
(4,978,846 |
) |
|
|
|
|
|
|
|
|
|
|
|
|
|
|
|
Net income (loss)
|
|
|
2,685,654 |
|
|
|
6,627,451 |
|
|
|
(11,236,589 |
) |
| |
|
|
|
|
|
|
|
|
|
|
|
|
|
Net loss attributable to Noncontrolling Interest
|
|
|
-- |
|
|
|
-- |
|
|
|
505,424 |
|
| |
|
|
|
|
|
|
|
|
|
|
|
|
|
Net income (loss) attributable to Arabian
American Development Company
|
|
$ |
2,685,654 |
|
|
$ |
6,627,451 |
|
|
$ |
(10,731,165 |
) |
| |
|
|
|
|
|
|
|
|
|
|
|
|
|
Net income (loss) per common share
|
|
|
|
|
|
|
|
|
|
|
|
|
|
Basic earnings (loss) per share
|
|
$ |
0.11 |
|
|
$ |
0.28 |
|
|
$ |
(0.46 |
) |
|
Diluted earnings (loss) per share
|
|
$ |
0.11 |
|
|
$ |
0.28 |
|
|
$ |
(0.46 |
) |
| |
|
|
|
|
|
|
|
|
|
|
|
|
|
Weighted average number of common
|
|
|
|
|
|
|
|
|
|
|
|
|
|
shares outstanding
|
|
|
|
|
|
|
|
|
|
|
|
|
|
Basic
|
|
|
23,769,047 |
|
|
|
23,733,955 |
|
|
|
23,409,458 |
|
|
Diluted
|
|
|
23,780,303 |
|
|
|
23,800,499 |
|
|
|
23,409,458 |
|
See notes to the consolidated financial statements.
For the years ended December 31, 2010, 2009, and 2008
| |
|
ARABIAN AMERICAN DEVELOPMENT STOCKHOLDERS
|
|
|
|
|
|
|
|
|
|
|
| |
|
|
|
|
|
|
|
|
|
|
Accumulated
|
|
|
|
|
|
|
|
|
|
|
|
|
|
| |
|
|
|
|
|
|
|
Additional
|
|
|
Other
|
|
|
|
|
|
|
|
|
Non-
|
|
|
|
|
| |
|
Common Stock
|
|
|
Paid-In
|
|
|
Comprehensive
|
|
|
Retained
|
|
|
|
|
|
Controlling
|
|
|
Total
|
|
| |
|
Shares
|
|
|
Amount
|
|
|
Capital
|
|
|
Income (Loss)
|
|
|
Earnings
|
|
|
Total
|
|
|
Interest
|
|
|
Equity
|
|
| |
|
|
|
|
|
|
|
|
|
|
|
|
|
|
|
|
|
|
|
|
|
|
|
|
|
DECEMBER 31, 2007
|
|
|
22,601,994 |
|
|
$ |
2,260,199 |
|
|
$ |
37,183,206 |
|
|
$ |
- |
|
|
$ |
13,174,450 |
|
|
$ |
52,617,855 |
|
|
$ |
794,646 |
|
|
$ |
53,412,501 |
|
| |
|
|
|
|
|
|
|
|
|
|
|
|
|
|
|
|
|
|
|
|
|
|
|
|
|
|
|
|
|
|
|
|
|
Common Stock
Issued for Services in
connection with AMAK
|
|
|
750,000 |
|
|
|
75,000 |
|
|
|
3,637,500 |
|
|
|
- |
|
|
|
- |
|
|
|
3,712,500 |
|
|
|
- |
|
|
|
3,712,500 |
|
|
Issued to Directors
|
|
|
30,001 |
|
|
|
3,000 |
|
|
|
226,501 |
|
|
|
- |
|
|
|
- |
|
|
|
229,501 |
|
|
|
- |
|
|
|
229,501 |
|
|
Issued to Employees
|
|
|
40,000 |
|
|
|
4,000 |
|
|
|
278,000 |
|
|
|
- |
|
|
|
- |
|
|
|
282,000 |
|
|
|
- |
|
|
|
282,000 |
|
|
Unrealized Loss on
|
|
|
|
|
|
|
|
|
|
|
|
|
|
|
|
|
|
|
|
|
|
|
|
|
|
|
|
|
|
|
|
|
|
Interest Rate Swap
|
|
|
|
|
|
|
|
|
|
|
|
|
|
|
|
|
|
|
|
|
|
|
|
|
|
|
|
|
|
|
|
|
|
(net of income tax
|
|
|
|
|
|
|
|
|
|
|
|
|
|
|
|
|
|
|
|
|
|
|
|
|
|
|
|
|
|
|
|
|
|
benefit of $ 577,007)
|
|
|
- |
|
|
|
- |
|
|
|
- |
|
|
|
(1,120,072 |
) |
|
|
- |
|
|
|
(1,120,072 |
) |
|
|
- |
|
|
|
(1,120,072 |
) |
| |
|
|
|
|
|
|
|
|
|
|
|
|
|
|
|
|
|
|
|
|
|
|
|
|
|
|
|
|
|
|
|
|
|
Net Loss
|
|
|
|
|
|
|
|
|
|
|
|
|
|
|
|
|
|
|
(10,731,165 |
) |
|
|
(10,731,165 |
) |
|
|
(505,423 |
) |
|
|
(11,236,588 |
) |
|
Comprehensive Loss
|
|
|
- |
|
|
|
- |
|
|
|
- |
|
|
|
- |
|
|
|
- |
|
|
|
(11,851,237 |
) |
|
|
- |
|
|
|
- |
|
| |
|
|
|
|
|
|
|
|
|
|
|
|
|
|
|
|
|
|
|
|
|
|
|
|
|
|
|
|
|
|
|
|
|
DECEMBER 31, 2008
|
|
|
23,421,995 |
|
|
$ |
2,342,199 |
|
|
$ |
41,325,207 |
|
|
$ |
(1,120,072 |
) |
|
$ |
2,443,285 |
|
|
$ |
44,990,619 |
|
|
$ |
289,223 |
|
|
$ |
45,279,842 |
|
| |
|
|
|
|
|
|
|
|
|
|
|
|
|
|
|
|
|
|
|
|
|
|
|
|
|
|
|
|
|
|
|
|
|
Stock options
|
|
|
|
|
|
|
|
|
|
|
|
|
|
|
|
|
|
|
|
|
|
|
|
|
|
|
|
|
|
|
|
|
|
Issued to Directors
|
|
|
- |
|
|
|
- |
|
|
|
234,922 |
|
|
|
- |
|
|
|
- |
|
|
|
234,922 |
|
|
|
- |
|
|
|
234,922 |
|
|
Issued to Employees
|
|
|
- |
|
|
|
- |
|
|
|
4,439 |
|
|
|
- |
|
|
|
- |
|
|
|
4,439 |
|
|
|
- |
|
|
|
4,439 |
|
|
Stock issued to Directors
|
|
|
12,000 |
|
|
|
1,200 |
|
|
|
39,600 |
|
|
|
- |
|
|
|
- |
|
|
|
40,800 |
|
|
|
- |
|
|
|
40,800 |
|
|
Unrealized Gain on Interest Rate Swap (net
of income tax expense of $143,612)
|
|
|
- |
|
|
|
- |
|
|
|
- |
|
|
|
278,775 |
|
|
|
- |
|
|
|
278,775 |
|
|
|
- |
|
|
|
278,775 |
|
|
Net Income
|
|
|
- |
|
|
|
- |
|
|
|
- |
|
|
|
- |
|
|
|
6,627,451 |
|
|
|
6,627,451 |
|
|
|
- |
|
|
|
6,627,451 |
|
|
Comprehensive Income
|
|
|
- |
|
|
|
- |
|
|
|
- |
|
|
|
- |
|
|
|
- |
|
|
|
6,906,226 |
|
|
|
- |
|
|
|
- |
|
| |
|
|
|
|
|
|
|
|
|
|
|
|
|
|
|
|
|
|
|
|
|
|
|
|
|
|
|
|
|
|
|
|
|
DECEMBER 31, 2009
|
|
|
23,433,995 |
|
|
$ |
2,343,399 |
|
|
$ |
41,604,168 |
|
|
$ |
(841,297 |
) |
|
$ |
9,070,736 |
|
|
$ |
52,177,006 |
|
|
$ |
289,223 |
|
|
$ |
52,466,229 |
|
| |
|
|
|
|
|
|
|
|
|
|
|
|
|
|
|
|
|
|
|
|
|
|
|
|
|
|
|
|
|
|
|
|
|
Stock options
|
|
|
|
|
|
|
|
|
|
|
|
|
|
|
|
|
|
|
|
|
|
|
|
|
|
|
|
|
|
|
|
|
|
Issued to Directors
|
|
|
- |
|
|
|
- |
|
|
|
293,060 |
|
|
|
- |
|
|
|
- |
|
|
|
293,060 |
|
|
|
- |
|
|
|
293,060 |
|
|
Issued to Employees
|
|
|
- |
|
|
|
- |
|
|
|
102,403 |
|
|
|
- |
|
|
|
- |
|
|
|
102,403 |
|
|
|
- |
|
|
|
102,403 |
|
|
Issued to Former Director
|
|
|
- |
|
|
|
- |
|
|
|
372,576 |
|
|
|
- |
|
|
|
- |
|
|
|
372,576 |
|
|
|
- |
|
|
|
372,576 |
|
|
Common Stock
|
|
|
|
|
|
|
|
|
|
|
|
|
|
|
|
|
|
|
|
|
|
|
|
|
|
|
|
|
|
|
|
|
|
Issued to Directors
|
|
|
14,000 |
|
|
|
1,400 |
|
|
|
29,540 |
|
|
|
|
|
|
|
|
|
|
|
30,940 |
|
|
|
|
|
|
|
30,940 |
|
|
Issued to Employees
|
|
|
2,750 |
|
|
|
275 |
|
|
|
8,663 |
|
|
|
|
|
|
|
|
|
|
|
8,938 |
|
|
|
|
|
|
|
8,938 |
|
|
Issued for STTC purchase
|
|
|
232,170 |
|
|
|
23,217 |
|
|
|
752,231 |
|
|
|
|
|
|
|
|
|
|
|
775,448 |
|
|
|
|
|
|
|
775,448 |
|
|
Unrealized Gain on Interest Rate Swap (net
of income tax expense of $53,880)
|
|
|
- |
|
|
|
- |
|
|
|
- |
|
|
|
104,591 |
|
|
|
- |
|
|
|
104,591 |
|
|
|
- |
|
|
|
104,591 |
|
|
Net Income
|
|
|
|
|
|
|
|
|
|
|
|
|
|
|
|
|
|
|
2,685,654 |
|
|
|
2,685,654 |
|
|
|
|
|
|
|
2,685,654 |
|
|
Comprehensive Income
|
|
|
- |
|
|
|
- |
|
|
|
- |
|
|
|
- |
|
|
|
- |
|
|
|
2,790,245 |
|
|
|
- |
|
|
|
- |
|
| |
|
|
|
|
|
|
|
|
|
|
|
|
|
|
|
|
|
|
|
|
|
|
|
|
|
|
|
|
|
|
|
|
|
DECEMBER 31, 2010
|
|
|
23,682,915 |
|
|
$ |
2,368,291 |
|
|
$ |
43,162,641 |
|
|
$ |
(736,706 |
) |
|
$ |
11,756,390 |
|
|
$ |
56,550,616 |
|
|
$ |
289,223 |
|
|
$ |
56,839,839 |
|
See notes to the consolidated financial statements.
For the years ended December 31,
| |
|
2010
|
|
|
2009
|
|
|
2008
|
|
|
Operating activities
|
|
|
|
|
|
|
|
|
|
|
Net income (loss) attributable to Arabian
American Development Co.
|
|
$ |
2,685,654 |
|
|
$ |
6,627,451 |
|
|
$ |
( 10,731,165 |
) |
|
Adjustments to reconcile net income (loss)
|
|
|
|
|
|
|
|
|
|
|
|
|
|
to Arabian American Development Co. to Net cash provided by (used in) operating activities:
|
|
|
|
|
|
|
|
|
|
|
|
|
|
Depreciation
|
|
|
2,613,164 |
|
|
|
2,689,847 |
|
|
|
1,631,283 |
|
|
Accretion of notes receivable discounts
|
|
|
(16,109 |
) |
|
|
(53,628 |
) |
|
|
(101,619 |
) |
|
Unrealized (gain) loss on derivative instruments
|
|
|
(177,448 |
) |
|
|
(6,976,232 |
) |
|
|
5,485,914 |
|
|
Share-based compensation
|
|
|
807,917 |
|
|
|
280,161 |
|
|
|
282,000 |
|
|
Provision for doubtful accounts
|
|
|
28,500 |
|
|
|
111,154 |
|
|
|
465,000 |
|
|
Deferred income taxes
|
|
|
684,582 |
|
|
|
8,977,317 |
|
|
|
(5,528,129 |
) |
|
Postretirement obligation
|
|
|
- |
|
|
|
23,378 |
|
|
|
202,000 |
|
|
Impairment loss
|
|
|
- |
|
|
|
- |
|
|
|
496,306 |
|
|
Loss attributable to noncontrolling interest
|
|
|
- |
|
|
|
- |
|
|
|
(505,423 |
) |
|
Equity in loss from AMAK
|
|
|
262,500 |
|
|
|
- |
|
|
|
1,856,250 |
|
|
Changes in operating assets and liabilities:
|
|
|
|
|
|
|
|
|
|
|
|
|
|
(Increase) decrease in trade receivables
|
|
|
1,062,165 |
|
|
|
(510,083 |
) |
|
|
(58,465 |
) |
|
Decrease in notes receivable
|
|
|
389,070 |
|
|
|
582,177 |
|
|
|
711,396 |
|
|
(Increase) decrease in income tax receivable
|
|
|
4,510,247 |
|
|
|
(4,297,082 |
) |
|
|
640,781 |
|
|
(Increase) decrease in inventories
|
|
|
(852,114 |
) |
|
|
(2,618,969 |
) |
|
|
441,436 |
|
|
(Increase) decrease in prepaid expenses and other assets
|
|
|
70,622 |
|
|
|
59,353 |
|
|
|
(151,029 |
) |
|
(Increase) decrease in derivative instruments deposits
|
|
|
- |
|
|
|
3,950,000 |
|
|
|
(3,950,000 |
) |
|
Increase in other liabilities
|
|
|
- |
|
|
|
773,000 |
|
|
|
- |
|
|
Increase (decrease) in accounts payable and accrued liabilities
|
|
|
(504,088 |
) |
|
|
(2,146,279 |
) |
|
|
2,750,258 |
|
|
Increase (decrease) in accrued interest
|
|
|
(28,005 |
) |
|
|
1,077 |
|
|
|
61,909 |
|
|
Increase (decrease) in accrued liabilities in Saudi Arabia
|
|
|
(206,764 |
) |
|
|
(957,876 |
) |
|
|
22,355 |
|
|
Net cash provided by (used in) operating activities
|
|
|
11,329,893 |
|
|
|
6,514,766 |
|
|
|
(5,978,942 |
) |
| |
|
|
|
|
|
|
|
|
|
|
|
|
|
Investing activities
|
|
|
|
|
|
|
|
|
|
|
|
|
|
Additions to mineral properties in Saudi Arabia
|
|
|
- |
|
|
|
- |
|
|
|
(390,579 |
) |
|
Additions to property, pipeline and equipment
|
|
|
(2,898,752 |
) |
|
|
(3,184,140 |
) |
|
|
(15,030,593 |
) |
|
Purchase of STTC transportation company
|
|
|
(250,000 |
) |
|
|
- |
|
|
|
- |
|
|
Net cash used in investing activities
|
|
|
(3,148,752 |
) |
|
|
(3,184,140 |
) |
|
|
(15,421,172 |
) |
| |
|
|
|
|
|
|
|
|
|
|
|
|
|
Financing Activities
|
|
|
|
|
|
|
|
|
|
|
|
|
|
Additions to long-term debt
|
|
|
1,396,751 |
|
|
|
2,530,761 |
|
|
|
25,900,000 |
|
|
Repayment of long-term debt
|
|
|
(4,419,563 |
) |
|
|
(6,169,009 |
) |
|
|
(6,530,574 |
) |
|
Net cash provided (used) in financing activities
|
|
|
(3,022,812 |
) |
|
|
(3,638,248 |
) |
|
|
19,369,426 |
|
See notes to the consolidated financial statements.
ARABIAN AMERICAN DEVELOPMENT COMPANY AND SUBSIDIARIES
CONSOLIDATED STATEMENTS OF CASH FLOWS - continued
For the years ended December 31,
| |
|
2010
|
|
|
2009
|
|
|
2008
|
|
| |
|
|
|
|
|
|
|
|
|
|
Net increase (decrease) in cash
|
|
|
5,158,329 |
|
|
|
(307,622 |
) |
|
|
(2,030,688 |
) |
| |
|
|
|
|
|
|
|
|
|
|
|
|
|
Cash and cash equivalents at beginning of year
|
|
|
2,451,614 |
|
|
|
2,759,236 |
|
|
|
4,789,924 |
|
| |
|
|
|
|
|
|
|
|
|
|
|
|
|
Cash and cash equivalents at end of year
|
|
$ |
7,609,943 |
|
|
$ |
2,451,614 |
|
|
$ |
2,759,236 |
|
| |
|
2010
|
|
|
2009
|
|
|
2008
|
|
|
Supplemental disclosure of cash flow information:
|
|
|
|
|
|
|
|
|
|
|
Cash payments for interest
|
|
$ |
1,160,972 |
|
|
$ |
1,334,453 |
|
|
$ |
918,845 |
|
|
Cash payments (net of refunds) for taxes
|
|
$ |
(3,547,394 |
) |
|
$ |
(278,622 |
) |
|
$ |
4,814 |
|
| |
|
|
|
|
|
|
|
|
|
|
|
|
|
Supplemental disclosure of non-cash items:
|
|
|
|
|
|
|
|
|
|
|
|
|
|
Capital expansion amortized to depreciation expense
|
|
$ |
551,340 |
|
|
$ |
621,864 |
|
|
$ |
630,731 |
|
|
Investment in AMAK
|
|
$ |
-- |
|
|
$ |
-- |
|
|
$ |
33,002,407 |
|
|
Issuance of common stock for settlement of accrued Directors’ compensation
|
|
$ |
-- |
|
|
$ |
-- |
|
|
$ |
229,501 |
|
|
Unrealized loss/(gain) on interest rate swap, net of tax benefit/expense
|
|
$ |
(104,591 |
) |
|
$ |
(278,775 |
) |
|
$ |
1,120,072 |
|
|
Net assets acquired in purchase of STTC Transportation Company
|
|
$ |
1,025,448 |
|
|
$ |
-- |
|
|
$ |
-- |
|
See notes to the consolidated financial statements.
|
|
NOTE 1 - BUSINESS AND OPERATIONS OF THE COMPANY
|
|
|
Business and Operations of the Company
|
The Company’s petrochemical operations are primarily conducted through a wholly-owned subsidiary, Texas Oil and Chemical Co. II, Inc. (“TOCCO”). TOCCO owns all of the capital stock of South Hampton Resources Inc. (“South Hampton”), and Silsbee Trading and Transportation Company (“STTC”). South Hampton owns all of the capital stock of Gulf State Pipe Line Company, Inc. (“Gulf State”). The Company also owns 100% of the capital stock of South Hampton Resources International, SL (“SHRI”) located in Spain which serves as a sales office for South Hampton. South Hampton owns and operates a specialty petrochemical product facility near Silsbee, Texas which manufactures high purity solvents used primarily in polyethylene, packaging, polypropylene, expandable polystyrene, poly-iso/urethane foams, and in the catalyst support industry. STTC provides transportation equipment to South Hampton for product delivery. Gulf State owns and operates three pipelines that connect the South Hampton facility to a natural gas line, to South Hampton’s truck and rail loading terminal and to a major petroleum pipeline owned by an unaffiliated third party.
On November 30, 2010, the Company entered into a Letter of Intent and Agreement and Plan of Reorganization with STTC owned by Nicholas N. Carter, the President and CEO of the Company, pursuant to which South Hampton Transportation, Inc. (“SHTI”), a Delaware corporation and a wholly owned subsidiary of the TOCCO, acquired 100% of the common stock of STTC. The acquisition was completed on November 30, 2010 and the Company plans in 2011 to merge STTC into South Hampton, with South Hampton as the surviving corporation. Prior to the acquisition of STTC, South Hampton leased transportation related equipment from STTC pursuant to a Master Lease Agreement dated February 3, 2009, which was set to expire in May 2014. The purpose of the acquisition of STTC was the acquisition of various transportation related assets from STTC that are important to South Hampton’s operations and termination of a related-party transaction and lease agreement (see Note 19).
The acquisition was accounted for by the purchase method of accounting and the fair value of the acquisition consideration was allocated to the fair value assets and liabilities as of the date of the acquisition as follows:
|
Fair value consideration given
|
|
|
|
Fair value assets acquired
|
|
|
|
|
Cash
|
|
$ |
250,000 |
|
Transportation equipment
|
|
$ |
1,651,516 |
|
|
Equity instruments (232,170 shares)
|
|
|
775,448 |
|
Real property
|
|
|
71,000 |
|
|
Note payable (Note 10)
|
|
|
300,000 |
|
Contractual based intangible asset
|
|
|
855,601 |
|
| |
|
|
|
|
Fair value liabilities assumed
|
|
|
|
|
| |
|
|
|
|
Deferred taxes
|
|
$ |
(561,855 |
) |
| |
|
|
|
|
Equipment debt
|
|
|
(584,186 |
) |
| |
|
|
|
|
Income tax payable
|
|
|
(106,628 |
) |
|
Total
|
|
$ |
1,325,448 |
|
Total
|
|
$ |
1,325,448 |
|
The contractual based intangible asset represented STTC’s right under its lease agreement lease equipment to and receive lease payments from South Hampton through May 2014. The amount recorded for this asset was based on the discounted net cash flows STTC would have received and represents South Hampton’s cost to cancel the lease by acquiring STTC.
The results of STTC’s operations and cash flows have been included in the consolidated results of operations and cash flows from the date the merger was completed. STTC’s only customer was South Hampton and it ceased generating revenues after the acquisition. Pro forma net income and net income per common share, computed as if the merger had been completed on January 1, 2009, would not have differed materially from the historical amounts.
NOTE 2 - SUMMARY OF SIGNIFICANT ACCOUNTING POLICIES
Principles of Consolidation – The consolidated financial statements include the financial position, results of operations, and cash flows of the Company, TOCCO, South Hampton, STTC, Gulf State, SHRI and PEVM. Other entities which are not controlled but over which the Company has the ability to exercise significant influence, are accounted for using the equity method of accounting. Investments in which the Company does not have significant influence are accounted for using the cost method of accounting.
In 2009 the Company determined that it did not have the ability to exert significant influence over the operations of AMAK, and as a result, changed its accounting for this investment from the equity method to the cost method. Under the cost method, earnings from AMAK are recognized only to the extent received or receivable (see Note 8).
Cash, Cash Equivalents and Short-Term Investments - The Company’s principal banking and short-term investing activities are with local and national financial institutions. Short-term investments with an original maturity of three months or less are classified as cash equivalents.
Inventories - Finished products and feedstock are recorded at the lower of cost, determined on the last-in, first-out method (LIFO); or market.
Accounts Receivable and Allowance for Doubtful Accounts – The Company evaluates the collectibility of its accounts receivable and adequacy of the allowance for doubtful accounts based upon historical experience and any specific customer financial difficulties of which the Company becomes aware. For the years ended December 31, 2010 and 2009, the allowance balance was increased by $28,500 and $111,000, respectively. The Company tracks customer balances and past due amounts to determine if customers may be having financial difficulties. This, along with historical experience and a working knowledge of each customer, helps determine accounts that should be written off. No amounts were written off in 2010 or 2008. Approximately $485,000 was written off in 2009.
Notes Receivable – The Company periodically makes changes in or expands its toll processing units at the request of the customer. The cost to make these changes is shared by the customer. Upon completion of the project a non-interest note receivable is recorded with an imputed interest rate. Interest rates used on outstanding notes at December 31, 2010, and 2009, were between 8% and 9%. The unearned interest is reflected as a discount against the note balance. The Company evaluates the collectibility of notes based upon a working knowledge of the customer. The notes are receivable from toll processing customers with whom the Company maintains a close relationship. Thus, all amounts due under the notes receivable are considered collectible, and no allowance has been recorded at December 31, 2010 and 2009.
Mineral Exploration and Development Costs - All costs related to the acquisition, exploration, and development of mineral deposits are capitalized until such time as (1) the Company commences commercial exploitation of the related mineral deposits at which time the costs will be amortized, (2) the related project is abandoned and the capitalized costs are charged to operations, or (3) when any or all deferred costs are permanently impaired. At December 31, 2010, and 2009, the Company’s remaining mining assets held by PEVM had not reached the commercial exploitation stage. No indirect overhead or general and administrative costs have been allocated to this project.
Plant, Pipeline and Equipment - Plant, pipeline and equipment are stated at cost. Depreciation is provided over the estimated service lives using the straight-line method. Gains and losses from disposition are included in operations in the period incurred. Maintenance and repairs are expensed as incurred. Major renewals and improvements are capitalized.
Interest costs incurred to finance expenditures during construction phase are capitalized as part of the historical cost of constructing the assets. Construction commences with the development of the design and ends when the assets are ready for use. Capitalized interest costs are included in property, pipeline and equipment and are depreciated over the service life of the related assets.
Platinum catalyst is included in property, pipeline and equipment at cost. Amortization of the catalyst is based upon cost less estimated salvage value of the catalyst using the straight line method over the estimated useful life (see Note 7).
Contractual Based Intangible Assets – The contractual based intangible asset represented STTC’s right under its lease agreement lease equipment to and receive lease payments from South Hampton through May 2014. The amount recoded for this asset was based on the discounted net cash flows STTC would have received, and represents South Hampton’s cost to cancel the lease by acquiring STTC (see Note 1). These costs will be amortized straight line over the remaining life of the lease at acquisition which at December 31, 2010, was 41 months.
Other Assets - Other assets include a license used in petrochemical operations and certain petrochemical assets.
Long-Lived Assets Impairment - Long-lived assets are reviewed for impairment whenever events or changes in circumstances indicate that the carrying amount may not be recoverable based on the undiscounted net cash flows to be generated from the asset’s use. The amount of the impairment loss to be recorded is calculated by the excess of the asset's carrying value over its fair value. Fair value is generally determined using a discounted cash flow analysis although other factors including the state of the economy are considered. Cost method investments are reviewed for impairment when events are identified, or there are changes in circumstances that may have an adverse effect on the fair value of the investment.
Revenue recognition – Revenue is recorded when (1) the customer accepts delivery of the product and title has been transferred or when the service is performed and the Company has no significant obligations remaining to be performed; (2) a final understanding as to specific nature and terms of the agreed upon transaction has occurred; (3) price is fixed and (4) collection is assured. For the Company’s petrochemical product sales these criteria are generally met, and revenue is recognized, when the product is delivered or title is transferred to the customer. Transloading sales and processing are service oriented and are recorded as services are rendered. Sales are presented net of discounts and allowances. Freight costs billed to customers are recorded as a component of revenue.
Shipping and handling costs - Shipping and handling costs are classified as cost of petrochemical product sales and processing and are expensed as incurred.
Retirement plan – The Company offers employees the benefit of participating in a 401(K) plan. The Company matches 100% up to 6% of pay with vesting occurring over 7 years. For years ended December 31, 2010, 2009, and 2008, matching contributions of $456,801, $413,497, and $385,501, respectively were made on behalf of employees.
Environmental Liabilities - Remediation costs are accrued based on estimates of known environmental remediation exposure. Ongoing environmental compliance costs, including maintenance and monitoring costs, are expensed as incurred.
Other Liabilities – The Company periodically makes changes in or expands its toll processing units at the request of the customer. The cost to make these changes is shared by the customer. Upon completion of the project a note receivable and a deferred liability are recorded to recover the project costs which are then capitalized (see Note 6). At times instead of a note receivable being established, the customer pays an upfront cost. The amortization of the deferred liability is recorded as a reduction to depreciation expense. As of December 31 of each year, depreciation expense had been reduced by $551,340 for 2010, $621,864 for 2009, and $630,731 for 2008.
Net Income Per Share - The Company computes basic income per common share based on the weighted-average number of common shares outstanding. Diluted income per common share is computed based on the weighted-average number of common shares outstanding plus the number of additional common shares that would have been outstanding if potential dilutive common shares, consisting of stock options and shares which could be issued upon conversion of debt, had been issued (see Note 17).
Foreign Currency - The functional currency for the Company and each of the Company’s subsidiaries is the US dollar. Transaction gains or losses as a result of transactions denominated and settled in currencies other than the US
dollar are reflected in the statements of income as a foreign exchange transaction gains or losses. The Company does not employ any practices to minimize foreign currency risks. As of December 31, 2010, 2009 and 2008, foreign currency translation adjustments were not significant.
Management Estimates - The preparation of consolidated financial statements in conformity with accounting principles generally accepted in the United States of America requires management to make estimates and assumptions that affect the reported amounts of assets and liabilities and disclosure of contingent assets and liabilities at the date of the consolidated financial statements and the reported amounts of revenues and expenses during the reporting period. Significant estimates include allowance for doubtful accounts receivable; assessment of impairment of the Company’s long-lived assets and investments, financial contracts, litigation liabilities, post retirement benefit obligations, guarantee obligations, environmental liabilities and deferred tax valuation allowances. Actual results could differ from these estimates.
Share-Based Compensation – The Company recognizes share-based compensation of employee stock options granted as the excess, if any, of the quoted market price of the Company’s common stock at the grant date over the amount the employee must pay to acquire the stock (see Note 14). Share-based compensation expense recognized during the period is based on the fair value of the portion of share-based payments awards that is ultimately expected to vest. Share-based compensation expense recognized in the consolidated statement of operations for the years ended December 31, 2010, 2009, and 2008 includes compensation expense based on the estimated grant date fair value for awards that are ultimately expected to vest, and accordingly has been reduced for estimated forfeitures. Estimated forfeitures at the time of grant are revised, if necessary, in subsequent periods if actual forfeitures differ from those estimates.
Guarantees – The Company enters into agreements which contain features that meet the definition of a guarantee under FASB ASC 460 “Guarantees” (see Note 13). These arrangements create two types of obligations for the Company:
|
a)
|
The Company has a non-contingent and immediate obligation to stand ready to make payments if certain future triggering events occur. For certain guarantees, a liability is recognized for the stand ready obligation at the inception of the guarantee; and
|
|
b)
|
The Company has an obligation to make future payments if those certain future triggering events do occur. A liability for the payment under the guarantee is recognized when 1) it becomes probably that one or more future events will occur triggering the requirement to make payments under the guarantee and 2) when the payment can be reasonably estimated.
|
Derivatives – The Company records derivative instruments on the balance sheet as either an asset or liability measured at fair value. Changes in the derivative instrument’s fair value are recognized currently in earnings unless specific hedge accounting criteria are met. Special accounting for qualifying hedges allows a derivative instrument’s gains and losses to offset related results on the hedged item in the income statement, to the extent effective, and requires that a company must formally document, designate and assess the effectiveness of transactions that receive hedge accounting.
Income Taxes – Deferred tax assets and liabilities are recognized for the future tax consequences attributable to differences between the financial statement carrying amounts of existing assets and liabilities and their respective tax bases. Deferred tax assets and liabilities are measured using enacted tax rates expected to apply to taxable income in the years in which those temporary differences are expected to be recovered or settled. The effect on deferred tax assets and liabilities of a change in tax rates is recognized in income in the period that includes the enactment date. A valuation allowance is recorded if there is uncertainty as to the realization of deferred tax assets.
Our estimate of the potential outcome of any uncertain tax issues is subject to management’s assessment of relevant risks, facts, and circumstances existing at that time. We use a more likely than not threshold for financial statement recognition and measurement of tax position taken or expected to be taken in a tax return. To the extent that our assessment of such tax position changes, the change in estimate is recorded in the period in which the determination is made. We report tax-related interest and penalties as a component of income tax expense. The Company
recognized no material adjustment in the liability for unrecognized income tax benefits. At the adoption date of January 1, 2007, and at December 31, 2010, there were no unrecognized tax benefits. As of December 31, 2010, and 2009, no interest related to uncertain tax positions had been accrued.
New Accounting Pronouncements
In January 2010 the FASB issued ASU No. 2010-06, Fair Value Measurements and Disclosures (Topic 820): Improving Disclosures about Fair Value Measurements. This ASU requires some new disclosures and clarifies some existing disclosure requirements about fair value measurement as set forth in Codification Subtopic 820-10. ASU 2010-06 amends Codification Subtopic 820-10 to now require a reporting entity to disclose separately the amounts of significant transfers in and out of Level 1 and Level 2 fair value measurements and describe the reasons for the transfers; and in the reconciliation for fair value measurements using significant unobservable inputs, a reporting entity should present separately information about purchases, sales, issuances and settlements. In addition, ASU 2010-06 clarifies the disclosures for reporting fair value measurement for each class of assets and liabilities and the valuation techniques and inputs used to measure fair value for both recurring and nonrecurring fair value measurements. ASU 2010-06 is effective for interim and annual reporting periods beginning after December 15, 2009, except for the disclosures about purchases, sales, issuances and settlements in the roll forward of activity in Level 3 fair value measurements. Those disclosures are effective for fiscal years beginning after December 15, 2010, and for interim periods within those fiscal years. Early application is permitted. The Company is currently evaluating the impact of the disclosures about purchases, sales, issuances and settlements in the roll forward of activity in Level 3 fair value measurements.
In February 2010 the FASB issued ASU No. 2010-09, Subsequent Events (Topic 855): Amendments to Certain Recognition and Disclosure Requirements. ASU 2010-09 reiterates that an SEC filer is required to evaluate subsequent events through the date that the financial statements are issued and eliminates the required disclosure of the date through which subsequent events have been evaluated. The updated guidance was effective upon issuance and its adoption had no impact on the Company’s consolidated financial statements.
In April 2010 the FASB issued ASU No. 2010-17, Revenue Recognition—Milestone Method (Topic 605) — Revenue Recognition (ASU 2010-17). ASU 2010-17 provides guidance on defining the milestone and determining when the use of the milestone method of revenue recognition for research or development transactions is appropriate. Consideration that is contingent on achievement of a milestone in its entirety may be recognized as revenue in the period in which the milestone is achieved only if the milestone is judged to meet certain criteria to be considered substantive. Milestones should be considered substantive in their entirety and may not be bifurcated. An arrangement may contain both substantive and nonsubstantive milestones, and each milestone should be evaluated individually to determine if it is substantive. ASU 2010-17 is effective on a prospective basis for milestones achieved in fiscal years, and interim periods within those years, beginning on or after June 15, 2010. The adoption of this ASU had no impact on the Company’s consolidated financial statements.
In July 2010 the FASB issued ASU No. 2010-20, Disclosures about the Credit Quality of Financing Receivables and the Allowance for Credit Losses (ASU 2010-20). ASU 2010-20 requires enhanced disclosures about the credit quality of financing receivables and the allowance for credit losses. Entities will be required to provide a greater level of disaggregated information about the credit quality of their financing receivables and their allowances for credit losses. In addition, entities will be required to disclose credit quality indicators, past due information, and modifications of financing receivables. The required disclosures as of the end of a reporting period are effective for interim and annual reporting periods ending on or after December 15, 2010. The required disclosures about activity that occurs during a reporting period are effective for interim and annual reporting periods beginning on or after December 15, 2010. Adoption of this ASU had no impact on the Company’s consolidated financial statements.
In December 2010 the FASB has issued ASU No. 2010-28, Intangibles - Goodwill and Other (Topic 350): When to Perform Step 2 of the Goodwill Impairment Test for Reporting Units with Zero or Negative Carrying Amounts. The amendments in this ASU modify Step 1 of the goodwill impairment test for reporting units with zero or negative carrying amounts. For those reporting units, an entity is required to perform Step 2 of the goodwill impairment test if
it is more likely than not that a goodwill impairment exists. In determining whether it is more likely than not that goodwill impairment exists, an entity should consider whether there are any adverse qualitative factors indicating that impairment may exist. The qualitative factors are consistent with the existing guidance and examples, which require that goodwill of a reporting unit be tested for impairment between annual tests if an event occurs or circumstances change that would more likely than not reduce the fair value of a reporting unit below its carrying amount. For public entities, the amendments in this ASU are effective for fiscal years, and interim periods within those years, beginning after December 15, 2010. Early adoption is not permitted. The Company is currently evaluating the impact adoption of this update may have on the consolidated financial statements.
In December 2010 the FASB has issued ASU No. 2010-29, Business Combinations (Topic 805): Disclosure of Supplementary Pro Forma Information for Business Combinations. The amendments in this ASU affect any public entity as defined by Topic 805, Business Combinations that enters into business combinations that are material on an individual or aggregate basis. The amendments in this ASU clarify certain aspects of the computation and disclosure of the pro forma net income and earnings per share required to be disclosed in connection with business combinations. The amendments are effective prospectively for business combinations for which the acquisition date is on or after the beginning of the first annual reporting period beginning on or after December 15, 2010. Early adoption is permitted. The Company does not expect that the adoption of this update will have a material effect on the consolidated financial statements.
NOTE 3 - CONCENTRATIONS OF REVENUES AND CREDIT RISK
Our Petrochemical operation sells its products and services to companies in the chemical and plastics industries. It performs periodic credit evaluations of its customers and generally does not require collateral from its customers. For the year ended December 31, 2010, two customers accounted for 18.2% and 21.3% of total product sales. For the year ended December 31, 2009, two customers accounted for 13.8% and 12.8% of total product sales. For the year ended December 31, 2008, two customers accounted for 13.2% and 10.6% of total product sales. The associated accounts receivable balances for those customers were approximately $1.5 million and $1.0 million and $1.6 million and $1.4 million as of December 31, 2010 and 2009, respectively. The carrying amount of accounts receivable approximates fair value at December 31, 2010.
Accounts receivable serving as collateral for the Company’s line of credit with a domestic bank was $9.4 million and $9.3 million at December 31, 2010 and 2009, respectively (see Note 10).
South Hampton markets its products in many foreign jurisdictions. For the years ended December 31, 2010, 2009 and 2008, sales in foreign jurisdictions accounted for approximately 18.5%, 15.4%, and 21.4%, respectively. The large percentage in 2008 was due to the transloading contract that was in effect from April 2008 until April 2009.
South Hampton utilizes one major supplier for its feedstock supply. The feedstock is a commodity product commonly available from other suppliers if needed. The percentage of feedstock purchased from the supplier during 2010, 2009, and 2008 was 98%, 100% and 100%, respectively. At December 31, 2010, and 2009, South Hampton owed the supplier approximately $1,055,000 and $1,748,000, respectively for feedstock purchases.
The Company holds its cash with various financial institutions that are insured by the Federal Deposit Insurance Corporation up to $250,000. At times during the year, cash balances may exceed this limit. The Company has not experienced any losses in such accounts and does not believe it is exposed to any significant risk of loss related to cash.
NOTE 4 – FAIR VALUE MEASUREMENTS
The carrying value of cash and cash equivalents, taxes receivable, accrued interest, accrued liabilities, accrued liabilities in Saudi Arabia and other liabilities approximate fair value due to the immediate or short-term maturity of these financial instruments. The carrying value of notes receivable approximates the fair value due to their short-term nature and historical collectability. The fair value of variable rate long term debt and notes payable reflect recent market transactions and approximate carrying value. The fair value of the derivative instruments are described below.
The Company adopted Statement of Financial Accounting Standards No. 157 (“SFAS 157”), Fair Value Measurements effective January 1, 2008, which is codified into Topic 820 in the ASC. ASC Topic 820 defines fair value, establishes a framework for measuring fair value, and expands disclosures about fair value measurements. ASC Topic 820 applies to reported balances that are required or permitted to be measured at fair value under existing accounting pronouncements; accordingly, the standard amends numerous accounting pronouncements but does not require any new fair value measurements of reported balances. ASC Topic 820 emphasizes that fair value, among other things, is based on exit price versus entry price, should include assumptions about risk such as nonperformance risk in liability fair values, and is a market-based measurement, not an entity-specific measurement. When considering the assumptions that market participants would use in pricing the asset or liability, ASC Topic 820 establishes a fair value hierarchy that distinguishes between market participant assumptions based on market data obtained from sources independent of the reporting entity (observable inputs that are classified within Levels 1 and 2 of the hierarchy) and the reporting entity’s own assumptions about market participant assumptions (unobservable inputs classified within Level 3 of the hierarchy). The fair value hierarchy prioritizes inputs used to measure fair value into three broad levels.
|
Level 1 inputs
|
Level 1 inputs utilize quoted prices (unadjusted) in active markets for identical assets or liabilities that the Company has the ability to access.
|
|
Level 2 inputs
|
Level 2 inputs are inputs other than quoted prices included in Level 1 that are observable for the asset or liability, either directly or indirectly. Level 2 inputs may include quoted prices for similar assets and liabilities in active markets, as well as inputs that are observable for the asset or liability (other than quoted prices), such as interest rates, foreign exchange rates, and yield curves that are observable at commonly quoted intervals.
|
|
Level 3 inputs
|
Level 3 inputs are unobservable inputs for the asset or liability, which is typically based on an entity’s own assumptions, as there is little, if any, related market activity.
|
In instances where the determination of the fair value measurement is based on inputs from different levels of the fair value hierarchy, the level in the fair value hierarchy within which the entire fair value measurement falls is based on the lowest level input that is significant to the fair value measurement in its entirety. The Company’s assessment of the significance of a particular input to the fair value measurement in its entirety requires judgment and considers factors specific to the asset or liability.
Commodity Financial Instruments
South Hampton periodically enters into financial instruments to hedge the cost of natural gasoline (the primary feedstock) and natural gas (used as fuel to operate the plant). South Hampton uses financial swaps on feedstock and options on natural gas to limit the effect of significant fluctuations in price on operating results. In the third quarter of 2008 the Company also began using crude oil options as a method of hedging feedstock prices over longer periods of time. South Hampton did not designate these financial instruments as hedging transactions under ASC Topic 815 (see Note 20).
South Hampton assesses the fair value of the financial swaps on feedstock using quoted prices in active markets for identical assets or liabilities (Level 1 of fair value hierarchy). South Hampton assesses the fair value of the options held to purchase crude oil and natural gas using a pricing valuation model. This valuation model considers various assumptions, including publicly available forward prices for crude, time value, volatility factors and current market and contractual prices for the underlying instrument, as well as other relevant economic measures (Level 2 of fair value hierarchy).
Interest Rate Swaps
In March 2008 South Hampton entered into an interest rate swap agreement with Bank of America related to the $10.0 million term loan secured by property, pipeline and equipment. The interest rate swap was designed to minimize the effect of changes in the LIBOR rate. South Hampton designated the interest rate swap as a cash flow hedge under ASC Topic 815 (see Note 20).
South Hampton assesses the fair value of the interest rate swap using a present value model that includes quoted LIBOR rates and the nonperformance risk of the Company and Bank of America based on the Credit Default Swap Market (Level 2 of fair value hierarchy).
The following items are measured at fair value on a recurring basis subject to disclosure requirements of ASC Topic 820 at December 31, 2010 and 2009.
| |
|
|
|
|
Fair Value Measurements Using
|
|
|
December 31, 2010
|
|
|
|
|
Level 1
|
|
|
Level 2
|
|
|
Level 3
|
|
|
Assets:
|
|
|
|
|
|
|
|
|
|
|
|
|
|
Financial swaps on feedstock
|
|
$ |
177,446 |
|
|
$ |
177,446 |
|
|
|
- |
|
|
|
- |
|
| |
|
|
|
|
|
|
|
|
|
|
|
|
|
|
|
|
|
Liabilities:
|
|
|
|
|
|
|
|
|
|
|
|
|
|
|
|
|
|
Interest Rate Swap
|
|
$ |
1,116,220 |
|
|
|
- |
|
|
$ |
1,116,220 |
|
|
|
- |
|
| |
|
|
|
|
Fair Value Measurements Using
|
|
|
December 31, 2009
|
|
|
|
|
Level 1
|
|
|
Level 2
|
|
|
Level 3
|
|
|
Liabilities:
|
|
|
|
|
|
|
|
|
|
|
|
|
|
Interest Rate Swap
|
|
$ |
1,274,692 |
|
|
|
- |
|
|
$ |
1,274,692 |
|
|
|
- |
|
The Company has consistently applied valuation techniques in all periods presented and believes it has obtained the most accurate information available for the types of derivative contracts it holds.
NOTE 5 – INVENTORIES
Inventories include the following at December 31:
| |
|
2010
|
|
|
2009
|
|
| |
|
|
|
|
|
|
|
Raw material
|
|
$ |
4,023,324 |
|
|
$ |
3,376,943 |
|
|
Finished products
|
|
|
1,893,959 |
|
|
|
1,688,226 |
|
| |
|
|
|
|
|
|
|
|
|
Total inventory
|
|
$ |
5,917,283 |
|
|
$ |
5,065,169 |
|
Inventory serving as collateral for the Company’s line of credit with a domestic bank was $4.08 million and $3.33 million at December 31, 2010 and 2009, respectively (see Note 10).
At December 31, 2010, current cost exceeded the LIFO value by approximately $2,274,000. During the year ended December 31, 2009, the Company recorded a charge of approximately $1,098,000 to reduce certain inventory to net realizable value.
NOTE 6 – NOTES RECEIVABLE
Notes receivable balances at December 31 were:
| |
|
2010
|
|
|
2009
|
|
| |
|
|
|
|
|
|
|
Note with processing customer (A)
|
|
$ |
35,111 |
|
|
$ |
424,181 |
|
|
Less discount
|
|
|
(684 |
) |
|
|
(16,793 |
) |
| |
|
|
34,427 |
|
|
|
407,388 |
|
| |
|
|
|
|
|
|
|
|
|
Less current portion
|
|
|
34,427 |
|
|
|
372,387 |
|
|
Total long-term notes receivable, less current portion
|
|
$ |
- |
|
|
$ |
35,001 |
|
(A) The Company has notes receivable from a long term processing customer for capital costs incurred in making adjustments to the processing unit at their request. The payment term is 5 years with interest imputed at a rate of 8%. Payments of $7,137 are due monthly.
Payments from long-term notes for the next five years ending December 31 are as follows:
|
Year Ending December 31,
|
|
Long-Term Notes Receivable
|
|
|
2011
|
|
$ |
35,111 |
|
|
Less: discount
|
|
|
684 |
|
| |
|
$ |
34,427 |
|
NOTE 7 – PLANT, PIPELINE AND EQUIPMENT
| |
|
December 31,
|
|
| |
|
2010
|
|
|
2009
|
|
|
Platinum catalyst
|
|
$ |
1,497,285 |
|
|
$ |
1,497,285 |
|
|
Land
|
|
|
727,363 |
|
|
|
689,363 |
|
|
Plant, pipeline and equipment
|
|
|
52,469,062 |
|
|
|
47,885,793 |
|
|
Construction in progress
|
|
|
10,000 |
|
|
|
10,000 |
|
|
Total plant, pipeline and equipment
|
|
|
54,703,710 |
|
|
|
50,082,441 |
|
|
Less accumulated depreciation
|
|
|
(20,839,442 |
) |
|
|
(17,674,938 |
) |
|
Net plant, pipeline and equipment
|
|
$ |
33,864,268 |
|
|
$ |
32,407,503 |
|
Plant, pipeline and equipment serve as collateral for a $14.0 million term loan with a domestic bank (see Note 10).
Interest capitalized for construction for 2010, 2009 and 2008 was approximately $26,000, $8,000 and $375,500, respectively.
Catalyst amortization relating to the platinum catalyst which is included in cost of sales was $12,736, $13,122 and $2,980 for 2010, 2009 and 2008, respectively.
NOTE 8 - INVESTMENT IN AL MASANE AL KOBRA MINING COMPANY (“AMAK”)
Until December 2008 the Company had direct investments in mining projects in the Al Masane area of Saudi Arabia. These investments included (i) the Al Masane Project, and (ii) investments in the exploration of the Wadi Qatan and Jebel Harr areas which are near the Al Masane Project.
AMAK was formed in late 2007 by the Company and eight Saudi investors, and was granted a commercial license from the Ministry of Commerce in January 2008. The Company formed AMAK with the Saudi investors because the Company recognized that the only way to obtain exploration permits from the Saudi government for the Al Masane, Wadi Qatan and Jebel Harr properties would be to form a joint venture with a Saudi company.
In December, 2008 the Company contributed to AMAK (i) its interests in its Saudi mining properties and (ii) $3,750,000 of costs the Company incurred in connection with the formation of AMAK and the obtaining of necessary licenses for AMAK. AMAK treated such costs as a contribution from the Company and as organizational costs, which it charged to expense. AMAK assumed from the Company the liability for the repayment of the $11 million loan from the Saudi Arabia Ministry of Finance and National Economy, and the Saudi Arabia Ministry of Finance and National Economy released the Company from liability for the loan. The company received a 50% interest in AMAK. The eight Saudi investors contributed $60 million in cash to AMAK for a 50% interest. Under the by-laws of AMAK, the Company was entitled to appoint four of eight members of AMAK’s board of directors and the Saudi investors were entitled to appoint the remaining four members of AMAK’s board of directors. However, the by-laws provided that the chairman of AMAK’s board, who is appointed by the Saudi investors, casts an extra vote in the event of a tie vote among the eight board members.
The Company accounted for its contribution of these assets to AMAK, net of the $11 million liability, as the contribution of non-monetary assets to a joint venture, and recorded the transfer based on the lower of the cost or market value of the transferred assets. The Company determined that cost was less than market value, with market value being based on the contribution of cash of $60 million by the other investors in AMAK in exchange for their 50% interest. In addition, the Company confirmed that market value was greater than cost based on the cash flow projections based on the proven reserves and market mineral prices. The Company’s initial investment in AMAK was comprised of the following:
| |
|
|
|
|
Accumulated costs of mineral Interests in Saudi Arabia
|
|
$ |
40,289,907 |
|
|
Contribution of AMAK organization costs
|
|
|
3,712,500 |
|
|
Loan payable assumed by AMAK
|
|
|
(11,000,000 |
) |
|
Net initial investment in AMAK
|
|
$ |
33,002,407 |
|
Initially, the Company accounted for its investment using the equity method of accounting under the presumption that since it owned more than 20% of AMAK, the Company would have the ability to exercise significant influence over the operating and financial policies of AMAK.
AMAK’s by-laws require that audited financial statements for each year ended December 31 be submitted to its stockholders by June 30 of the following year. As a result, the Company had expected to obtain the audited 2008 financial statements of AMAK by June 30, 2009, and in addition the Company expected to be able to secure the cooperation of AMAK and its auditors in converting those financial statements from generally accepted accounting principles in Saudi Arabia (“Saudi GAAP”) to U.S. generally accepted accounting principles (“U.S. GAAP”). However, by August of 2009 no financial statements of AMAK for 2008 had been produced.
In addition, during an April 2009 meeting of the Board of Directors of AMAK, a Saudi director, who is also an AMAK shareholder, questioned the validity of the agreements between the Company and several of the Saudi investors which had been relied upon by the Company as the operating document for AMAK since it was signed. The issues raised included: discrepancies between the terms of the original memorandum of understanding and the executed AMAK partnership agreement; an allegation that various signatures for one or more of the Saudi investors on the AMAK partnership agreement were not authorized; that the Saudi attorney that prepared the AMAK partnership agreement exceeded his authority; and whether the Company’s capital contribution for its 50% interest in AMAK was fully paid or whether the Company was subject to a call for a $30 million cash contribution to AMAK’s capital. The Company had relied upon the AMAK partnership agreement since December 2008.
To settle these disputes, in August 2009 AMAK’s shareholders (the Company and the Saudi investors) agreed to amend the articles of association and by-laws for AMAK that provided that (i) the Company would convey nine percent or 4,050,000 shares of AMAK stock to the other AMAK shareholders pro rata, such that the Company’s interest in AMAK was now 41%, (ii) the Company has fully and completely paid the subscription price for 18,450,000 shares of AMAK stock (or 41% of the issued and outstanding shares), (iii) neither AMAK nor the other AMAK shareholders may require the Company to make an additional capital contribution without the Company’s written consent, (iv) the Company’s right to retain seats on the AMAK Board equal in number to that of the Saudi Arabian shareholders would be limited to the three year period beginning August 25, 2009; (v) AMAK has assumed the $11 million promissory note to the Saudi Arabian Ministry of Finance and National Economy, and AMAK will indemnify and defend the Company against any and all claims related to that note, and (vi) for a three year period commencing August 25, 2009, the Company has the option to repurchase from the Saudi Arabian shareholders 4,050,000 shares of AMAK stock at a price equal to the then fair market value of said shares less ten percent.
In May 2010 the Company received a draft of the 2009 financial statements of AMAK prepared under Saudi GAAP. At that time, the Company introduced a resolution at a meeting of the AMAK board of directors that would have required AMAK to produce the annual and quarterly financial statements prepared in accordance with U.S. GAAP that the Company required in order to apply the equity method of accounting for its investment. The resolution was defeated as the result of the casting of the tie breaking vote described above.
As the result of the events described above the Company concluded since August 2009 that it no longer had significant influence over the operating and financial policies of AMAK, and the Company changed to the cost method of accounting for its investment in AMAK. The Company recorded its cost method investment in AMAK at the carrying amount of its equity method investment at the date the method of accounting was changed.
While the Company has been unable to obtain 2008 or 2009 U.S. GAAP financial information for AMAK, based on the Saudi GAAP information it has received it believes that its share of any net income or loss for AMAK for the period from January 1, 2009 to August, 2009 would not be material as AMAK’s activities during that period were the construction of facilities to begin the commercial development of the interests. Additionally, because the Company was unable to obtain U.S. GAAP financial information for 2008 or 2009, the Company did not, while it was using the equity method of accounting, record any adjustments for the difference between its investment in AMAK and its share of the book value of AMAK’s net assets. For 2008, on the basis of the information the Company was able to obtain, AMAK’s activities were limited to the receipt of the contributed assets, and its net loss was comprised solely of the expensing of the $3,712,500 of organizational costs incurred on its behalf by the Company. During 2010 the Company learned that AMAK had recorded Zakat tax expense in 2008 of SR 1,965,000 (approximately USD $525,000). This tax is not an income tax but rather a tax on equity. This expense also related to the time period when the investment in AMAK was accounted for under the equity method. The Company recorded a charge for its 50% share of this expense ($262,500) during 2010 on the basis that its receipt of the information was during 2010. This information was unavailable when the 2008 and 2009 financial statements were issued; and therefore, caused a revision to the original estimate of the Company’s share of AMAK’s 2008 net loss. There was no Zakat for 2009. The Company’s investment in AMAK was as follows:
|
Initial investment in AMAK
|
|
$ |
33,002,407 |
|
|
Share of net loss of AMAK
|
|
|
(1,856,250 |
) |
|
Investment in AMAK at December 31, 2009 and 2008
|
|
|
31,146,157 |
|
|
Share of 2008 Zakat Tax
|
|
|
(262,500 |
) |
|
Investment in AMAK at December 31, 2010
|
|
$ |
30,883,657 |
|
As discussed in Note 13, the Company has guaranteed certain of AMAK’s bank debt.
NOTE 9 - MINERAL PROPERTIES IN THE UNITED STATES
The principal assets of PEVM are an undivided interest in 48 patented and 5 unpatented mining claims totaling approximately 1,500 acres, and a 300 ton-per-day mill located on the aforementioned properties in the PEVM Mining District in southeast Nevada. In August 2001, 75 unpatented claims were abandoned since they were deemed to have no future value to PEVM. Due to the lack of capital, the properties held by PEVM have not been commercially operated for approximately 35 years. The Company recorded an impairment loss through December 31, 2008 of $496,000 due to the decline in real estate values of the asset.
NOTE 10 - NOTES PAYABLE, LONG-TERM DEBT AND LONG-TERM OBLIGATIONS
Notes payable, long-term debt and long-term obligations at December 31 are summarized as follows:
| |
|
2010
|
|
|
2009
|
|
|
Notes payable:
|
|
|
|
|
|
|
|
Other
|
|
|
12,000 |
|
|
|
12,000 |
|
|
Total
|
|
$ |
12,000 |
|
|
$ |
12,000 |
|
| |
|
|
|
|
|
|
|
|
|
Long-term debt:
|
|
|
|
|
|
|
|
|
|
Revolving note to domestic bank (A)
|
|
|
10,489,488 |
|
|
|
12,489,488 |
|
|
Term notes to domestic bank (B)
|
|
|
10,950,000 |
|
|
|
12,350,000 |
|
|
Term notes to domestic bank (C)
|
|
|
564,628 |
|
|
|
- |
|
|
Term note to CEO (D)
|
|
|
300,000 |
|
|
|
- |
|
|
Term note to domestic bank (E)
|
|
|
396,752 |
|
|
|
- |
|
| |
|
|
|
|
|
|
|
|
|
Total long-term debt
|
|
|
22,700,868 |
|
|
|
24,839,488 |
|
| |
|
|
|
|
|
|
|
|
|
Less current portion
|
|
|
1,864,770 |
|
|
|
1,400,000 |
|
| |
|
|
|
|
|
|
|
|
|
Total long-term debt, less current portion
|
|
$ |
20,836,098 |
|
|
$ |
23,439,488 |
|
|
(A)
|
On May 25, 2006 South Hampton entered into a $12.0 million revolving loan agreement with a domestic bank secured by accounts receivable and inventory. The loan was originally due to expire on October 31, 2008, but has been amended to extend the termination date to June 30, 2012. Additional amendments were entered into during 2008 and 2009 which ultimately increased the availability of the line to $18,000,000 based upon the Company’s accounts receivable and inventory. At December 31, 2010, and 2009, there was a long-term amount outstanding of $10,489,488 and $12,489,488, respectively. The credit agreement contains a sub-limit of $3.0 million available to be used in support of the hedging program. The interest rate on the loan varies according to several options and the amount outstanding. At December 31, 2010 the rate was 2.75%, and approximately $2.9 million was available to be drawn. A commitment fee of 0.25% is due quarterly on the unused portion of the loan. If the amount outstanding surpasses the amount calculated by the borrowing base, a principal payment would be due to reduce the amount outstanding to the calculated base. Interest is paid monthly. Covenants that must be maintained include EBITDA, capital expenditures, dividends payable to parent, and leverage ratio.
|
|
(B)
|
On September 19, 2007 South Hampton entered into a $10.0 million term loan agreement with a domestic bank to finance the expansion of the petrochemical facility. An amendment was entered into on November 26, 2008 which increased the term loan to $14.0 million due to the increased cost of the expansion. This note is secured by property, pipeline and equipment. The agreement expires October 31, 2018. At December 31, 2010, and 2009, there was a short-term amount of $1,400,000 and $1,400,000 and a long-term amount of $9,550,000 and $10,950,000 outstanding, respectively. The interest rate on the loan varies according to several options. At December 31, 2010 the variable interest rate under the loan was 2.75%. However, as discussed in Note 20, effective August 2008 the Company entered into a pay-fixed, receive-variable interest rate swap with the lending bank which has the effect of converting the interest rate on $10.0 million of the loan to a fixed rate. Principal payments of $350,000 are paid quarterly with interest being paid monthly.
|
|
(C)
|
On November 30, 2010 as part of the acquisition of STTC, various notes payable by STTC to JPMorgan Chase bank were assumed. Principal and interest are due monthly on each note for a total of approximately $23,000. The total notes assumed equaled $584,186. Interest rates vary on these notes between 6.6% and 10%. At December 31, 2010, there was a short-term amount of $271,526 and a long-term amount of $293,102 outstanding.
|
|
(D)
|
On November 30, 2010, as part of the consideration paid for the acquisition of STTC, a note payable issued to Nicholas Carter, previous owner of STTC, for $300,000. Principal of $100,000 plus accrued interest at 4.0% per annum is payable annually on November 30th of each year. At December 31, 2010, there was a short-term amount of $100,000 and a long-term amount of $300,000 outstanding.
|
|
(E)
|
On December 7, 2010, STTC entered into a note agreement with JPMorgan Chase Bank for the purchase of transportation equipment. The amount of the note was $396,752 with principal and interest at 4.0% per annum payable monthly over 48 months at approximately $9,000 per month. At December 31, 2010, there was a short-term amount of $93,244 and a long-term amount of $303,508 outstanding.
|
Principal payments of long-term debt for the next five years and thereafter ending December 31 are as follows:
|
Year Ending December 31,
|
|
Long-Term Debt
|
|
|
2011
|
|
$ |
1,864,770 |
|
|
2012
|
|
|
12,268,247 |
|
|
2013
|
|
|
1,692,478 |
|
|
2014
|
|
|
1,525,373 |
|
|
2015
|
|
|
1,400,000 |
|
|
Thereafter
|
|
|
3,950,000 |
|
|
Total
|
|
$ |
22,700,868 |
|
NOTE 11 – ACCRUED LIABILITIES
Accrued liabilities at December 31 are summarized as follows:
| |
|
2010
|
|
|
2009
|
|
|
Accrued state taxes
|
|
$ |
109,779 |
|
|
$ |
103,573 |
|
|
Accrued payroll
|
|
|
656,139 |
|
|
|
546,720 |
|
|
Accrued directors’ fees
|
|
|
5,000 |
|
|
|
105,387 |
|
|
Accrued officers’ compensation
|
|
|
- |
|
|
|
76,001 |
|
|
Accrued environmental costs (Note 13)
|
|
|
350,000 |
|
|
|
- |
|
|
Other liabilities
|
|
|
656,724 |
|
|
|
504,538 |
|
| |
|
|
|
|
|
|
|
|
|
Total
|
|
$ |
1,777,642 |
|
|
$ |
1,336,219 |
|
NOTE 12 – ACCRUED LIABILITIES IN SAUDI ARABIA
After the contribution of the Company’s mining properties to AMAK as discussed in Note 8, the Company has closed the branch office in Saudi Arabia, started the legal process of terminating employees located there, and has begun to pay termination benefits and other liabilities. Accrued liabilities in Saudi Arabia at December 31 are summarized as follows:
| |
|
2010
|
|
|
2009
|
|
|
Salaries
|
|
$ |
20,798 |
|
|
$ |
202,920 |
|
|
Termination benefits
|
|
|
66,942 |
|
|
|
213,649 |
|
|
Other liabilities
|
|
|
96,853 |
|
|
|
54,711 |
|
| |
|
|
|
|
|
|
|
|
|
Total
|
|
$ |
184,593 |
|
|
$ |
471,280 |
|
NOTE 13 - COMMITMENTS AND CONTINGENCIES
Guarantees -
South Hampton, in 1977, guaranteed a $160,000 note payable of a limited partnership in which it has a 19% interest. Included in Accrued Liabilities at December 31, 2010 and 2009 is $66,570 related to this guaranty.
On October 24, 2010, the Company executed a limited Guarantee in favor of the Saudi Industrial Development Fund (“SIDF”) whereby the Company agreed to guaranty up to 41% of the SIDF loan to AMAK in the principal amount of 330,000,000 Saudi Riyals (US$88,000,000) (the “Loan”). The term of the loan is through June 2019. As a condition of the Loan, SIDF required all shareholders of AMAK to execute personal or corporate Guarantees; as a result, the Company’s guarantee is for approximately 135,300,000 Saudi Riyals (US$$36,080,000). The loan was necessary to continue construction of the AMAK facilities and provide working capital needs. The Company’s current assessment is that the probability of contingent performance was remote based on the Company’s analysis of the contingent portion of the guarantee which included but was not limited to the following: (1) the SIDF has historically not called guarantees, (2) the value of the assets exceeds the amount of the loan (3) the other shareholders have indicated that they would prioritize their personal guarantees ahead of the corporate guarantee, and (4) according to Saudi Arabian legal counsel, assets outside of Saudi Arabia are protected from the Saudi Court System. The Company received no consideration in connection with extending the guarantee and did so to maintain and enhance the value of its investment. The Company’s non-contingent and immediate obligation to stand ready to make payments if the events of default under the guarantee occur was not material to the financial statements.
Litigation -
On May 9, 2010 after numerous attempts to resolve certain issues with Mr. El Khalidi, the Board of Directors terminated the retirement agreement, options, retirement bonuses, and all outstanding directors’ fees due to Mr. El Khalidi, former CEO, President and Director of the Company., This action was taken in response to Mr. El Khalidi’s consistent and documented attempts to delay the Al Masane/AMAK mining project, damage the credibility of the Company with its shareholders in Saudi Arabia, and disrupt the relationship with the Saudi AMAK shareholders. In June 2010 Mr. El Khalidi filed suit against the Company in the labor courts of Saudi Arabia alleging additional compensation owed to him for time served. In September 2010 Mr. El Khalidi threatened suit against the Company in Texas alleging breach of contract under the above agreements and other claims. The Company believes that the claims are unsubstantiated and intend to vigorously defend against the claims. The liabilities owed to Mr. El Khalidi will remain recorded and the options will continue to accrue until the lawsuit is resolved.
On September 14, 2010, the Company received notice of a lawsuit filed in Jefferson County, Texas. The suit alleges that the plaintiff became ill from exposure to asbestos. There are approximately 44 defendants named in the suit. On October 18, 2010, the Company received notice of another lawsuit filed in Jefferson County, Texas. The suit alleges that the plaintiff became ill from benzene exposure during his employment from 1970 to 2008 with Goodyear Tire and Rubber Company, a customer of South Hampton. There are approximately 7 defendants named in the suit. The Company has placed its insurers on notice of the claims and plans to vigorously defend the cases. No amounts have been accrued for these claims.
Environmental Remediation -
In 2008 the Company learned of a claim by the U.S. Bureau of Land Management (“BLM”) against World Hydrocarbons, Inc. for contamination of real property owned by the BLM north of and immediately adjacent to the processing mill situated on property owned by PEVM. The BLM’s claim alleged that mine tailings from the processing mill containing lead and arsenic migrated onto BLM property during the first half of the twentieth century. World Hydrocarbons, Inc. responded to the BLM by stating that it does not own the mill and that PEVM is the owner and responsible party. PEVM subsequently commenced dialogue with the BLM in late 2008 to determine how best to remedy the situation. Communication with the BLM is continuing. PEVM has retained an environmental consultant to assist with the resolution of this matter and has accrued $350,000 for environmental remediation based on their estimates.
Amounts charged to expense for various activities related to environmental monitoring, compliance, and improvements were approximately $449,000 in 2010, $444,000 in 2009 and $518,000 in 2008.
NOTE 14 - SHARE-BASED COMPENSATION
Common Stock – In November 2010 the Company issued 232,170 shares of common stock to its President/CEO in connection with the purchase of STTC (see Note 1).
In January 2010 the Company issued 14,000 shares of common stock to non-employee directors for services rendered during 2009. Compensation expense recognized in connection with this issuance was $30,940.
In September 2009 the Company issued 12,000 shares of restricted common stock to non-employee Board members for services rendered. Compensation expense recognized in connection with this issuance was $40,800.
In January 2008 the Company issued 30,001 shares of its common stock to non-employee directors as settlement for accrued compensation at December 31, 2007 for services rendered in their capacity as directors. During the same time period, the Company issued 40,000 shares of its common stock to certain employees and executives of the Company for services rendered. Compensation expense recognized in connection with this issuance was $282,000. The Company also issued 750,000 shares of its common stock during 2008 for payment of certain formation costs of AMAK (see Note 8).
Stock Options – On April 7, 2008, the Board of Directors of the Company adopted the Stock Option Plan for Key Employees, as well as, the Non-Employee Director Stock Option Plan (hereinafter collectively referred to as the “Stock Option Plans”), subject to the approval of Company’s shareholders. Shareholders approved the Stock Option Plans at the 2008 Annual Meeting of Shareholders on July 10, 2008. The Company filed Form S-8 to register the 1,000,000 shares allocated to the Stock Option Plans on October 23, 2008.
A summary of all 2010 issuances is as follows:
In January 2010 the Company awarded fully vested options to its non-employee directors for 32,667 shares in total for their service during 2009. The exercise price of the options is $2.21 per share based upon the closing price on January 28, 2010. The options have a remaining life of 9.1 years as of December 31, 2010. Compensation expense recognized during 2010 in connection with this award was approximately $72,000. In January 2010 the Company also awarded 95,000 options to officers and key employees for their service during 2009. The exercise price of the options was also $2.21. These options vest over a 2 year period. Compensation expense recognized during 2010 in connection with this award was approximately $96,000.
In February 2010 the Company awarded 500,000 options to non-employee directors for their service during 2010 subject to attendance and service requirements. These options vest over a 5 year period. The exercise price of these options is $2.82 based upon the closing price on February 23, 2010. Directors’ fee expense recognized during 2010 in connection with this award was approximately $221,000.
In June 2010 the Company awarded a 7 year option to purchase 10,000 shares of restricted stock to a key employee with a vesting period of 2 years. The exercise price of the options is $2.47 per share based upon the closing price on June 22, 2010. The options have a remaining life of 6.5 years as of December 31, 2010. Compensation expense recognized in connection with this award was approximately $6,200. Additional expense will be recognized over the 2 year vesting period.
The fair value of the 2010 options granted was calculated using the Black-Scholes option valuation model with the following range of assumptions:
|
Expected volatility
|
338% to 467%
|
|
Expected dividends
|
None
|
|
Expected term (in years)
|
5-10
|
|
Risk free interest rate
|
2.37% to 3.68%
|
On January 2, 2009, the Company awarded fully vested options to its non-employee directors in the amount of 7,000 shares each for a total of 35,000 shares for their service during 2008. The exercise price of the options is $1.39 per share based upon the closing price on January 2, 2009. Compensation expense recognized in connection with this award was approximately $49,000 for the year ended December 31, 2009.
On January 26, 2009, the Company awarded fully vested options to two of its key employees in the amount of 2,000 shares each for a total of 4,000 shares for their continuing service. The exercise price of the options is $1.11 per share based upon the closing price on January 26, 2009. Compensation expense recognized in connection with this award was approximately $4,000 for the year ended December 31, 2009.
On July 2, 2009, the Company’s Board terminated Mr. El Khalidi’s option to purchase 400,000 shares of Company common stock with an exercise price of $1.00 per share (the “Option”) as had been authorized by a board resolution, dated October 10, 1995 (the “1995 Resolution”) and resolved that the Options granted by the Company to Hatem El Khalidi pursuant to the 1995 Resolution was officially terminated in all respects and should be removed from the Company’s books and records. The Board next considered Mr. El Khalidi’s efforts related to the mining project in southwestern Saudi Arabia in conjunction with his retirement as Chief Executive Officer of the Company on June 30, 2009, and after discussion, the Board documented its sincere appreciation of Mr. El Khalidi’s efforts related to the mining project and issued two stock options to Mr. El Khalidi and his wife, Ingrid El Khalidi, tied to the performance of AMAK as follows: (1) an option to purchase 200,000 shares of the Company’s common stock with an exercise price of $3.40 per share, equal to the closing sale price of such a share as reported on the Nasdaq National Market System on July 2, 2009, provided that said option may not be exercised until such time as the first shipment of ore from the Al Masane mining project is transported for commercial sale by AMAK, and further that said option shall terminate and be immediately forfeited if not exercised on or before June 30, 2012; and (2) an option to purchase 200,000 shares of the Company’s common stock with an exercise price equal to the closing sale price of such a share as reported on the Nasdaq Stock Market on July 2, 2009, provided that said option may not be exercised until such time as the Company receives its first cash dividend distribution from AMAK, and further that said option shall terminate and be immediately forfeited if not exercised on or before June 30, 2019. Compensation expense of approximately $373,000 and $186,000 was recognized during the years ended December 31, 2010, and 2009, related to the options awarded to Mr. El Khalidi. On May 9, 2010, the Board of Directors determined that Mr. El Khalidi forfeited these options and other retirement benefits when he made various demands against the Company and other AMAK Saudi shareholders which would benefit him personally and were not in the best interests of the Company and its shareholders. As discussed in Note 13 the Company is currently in certain disputes with Mr. El Khalidi and in connection therewith, the Company is currently reviewing its legal right to withdraw the options and benefits. However, as of December 31, 2010, these options and benefits continue to be shown as outstanding.
The fair value of the 2009 options granted was calculated using the Black-Scholes option valuation model with the following range of assumptions:
|
Expected volatility
|
139% to 402%
|
|
Expected dividends
|
None
|
|
Expected term (in years)
|
1.5-10
|
|
Risk free interest rate
|
0.50% to 3.14%
|
A summary of the status of the Company’s stock option awards is presented below:
| |
|
Stock Options
|
|
|
Weighted
Average
Exercise
Price
Per Share
|
|
|
Weighted
Average
Remaining
Contractual
Life
|
|
|
Intrinsic
Value
(in thousands)
|
|
|
Outstanding at December 31, 2008
|
|
|
500,000 |
|
|
$ |
1.20 |
|
|
|
|
|
|
|
|
Granted
|
|
|
439,000 |
|
|
|
3.22 |
|
|
|
|
|
|
|
|
Expired
|
|
|
(100,000 |
) |
|
|
2.00 |
|
|
|
|
|
|
|
|
Cancelled
|
|
|
(400,000 |
) |
|
|
1.00 |
|
|
|
|
|
|
|
|
Outstanding at December 31, 2009
|
|
|
439,000 |
|
|
$ |
3.22 |
|
|
|
6.3 |
|
|
|
-- |
|
|
Exercisable at December 31, 2009
|
|
|
39,000 |
|
|
$ |
1.36 |
|
|
|
9.0 |
|
|
|
|
|
| |
|
|
|
|
|
|
|
|
|
|
|
|
|
|
|
|
|
Outstanding at December 31, 2009
|
|
|
439,000 |
|
|
$ |
3.22 |
|
|
|
|
|
|
|
|
|
|
Granted
|
|
|
637,667 |
|
|
|
2.69 |
|
|
|
|
|
|
|
|
|
|
Expired
|
|
|
-- |
|
|
|
-- |
|
|
|
|
|
|
|
|
|
|
Cancelled
|
|
|
-- |
|
|
|
-- |
|
|
|
|
|
|
|
|
|
|
Outstanding at December 31, 2010
|
|
|
1,076,667 |
|
|
$ |
2.91 |
|
|
|
8.6 |
|
|
|
-- |
|
|
Exercisable at December 31, 2010
|
|
|
71,667 |
|
|
$ |
1.75 |
|
|
|
8.5 |
|
|
|
|
|
On August 27, 2009, outstanding options of 100,000 shares awarded to Mr. Ghazi Sultan expired.
The Company expects to issue shares upon exercise of the options from its authorized but unissued common stock.
The provision for (benefit from) income taxes consisted of the following:
| |
|
Year ended December 31,
|
|
| |
|
2010
|
|
|
2009
|
|
|
2008
|
|
|
Current federal provision (benefit)
|
|
$ |
1,021,949 |
|
|
$ |
(4,866,532 |
) |
|
$ |
376,030 |
|
|
Current state provision
|
|
|
5,549 |
|
|
|
89,571 |
|
|
|
173,323 |
|
| |
|
|
|
|
|
|
|
|
|
|
|
|
|
Deferred federal provision (benefit)
|
|
|
662,817 |
|
|
|
8,959,098 |
|
|
|
(5,388,895 |
) |
|
Deferred state provision (benefit)
|
|
|
12,501 |
|
|
|
161,831 |
|
|
|
(139,304 |
) |
| |
|
|
|
|
|
|
|
|
|
|
|
|
|
Income tax expense (benefit)
|
|
$ |
1,702,816 |
|
|
$ |
4,343,968 |
|
|
$ |
(4,978,846 |
) |
The difference between the effective tax rate in income tax expense (benefit) and the Federal statutory rate of 34% is as follows:
| |
|
2010
|
|
|
2009
|
|
|
2008
|
|
|
Income taxes at U.S. statutory rate
|
|
$ |
1,492,080 |
|
|
$ |
3,736,766 |
|
|
$ |
(5,513,248 |
) |
|
State taxes, net of federal benefit
|
|
|
96,144 |
|
|
|
230,187 |
|
|
|
(42,141 |
) |
|
Prior year overpayments
|
|
|
(14,566 |
) |
|
|
(13,998 |
) |
|
|
(49,872 |
) |
|
Permanent and other items
|
|
|
10,158 |
|
|
|
25,720 |
|
|
|
(4,710 |
) |
|
Increase in valuation allowance
|
|
|
119,000 |
|
|
|
365,293 |
|
|
|
631,125 |
|
|
Total tax expense (benefit)
|
|
$ |
1,702,816 |
|
|
$ |
4,343,968 |
|
|
$ |
(4,978,846 |
) |
The tax effects of temporary differences that give rise to significant portions of federal and state deferred tax assets and deferred tax liabilities were as follows:
| |
|
December 31,
|
|
| |
|
2010
|
|
|
2009
|
|
|
Deferred tax liabilities:
|
|
|
|
|
|
|
|
Plant, pipeline and equipment
|
|
$ |
(6,029,283 |
) |
|
$ |
(4,863,610 |
) |
|
Unrealized loss on swap agreements
|
|
|
(61,503 |
) |
|
|
- |
|
|
Total deferred tax liabilities
|
|
$ |
(6,090,786 |
) |
|
$ |
(4,863,610 |
) |
| |
|
|
|
|
|
|
|
|
|
Deferred tax assets:
|
|
|
|
|
|
|
|
|
|
Accounts receivable
|
|
|
162,250 |
|
|
|
148,174 |
|
|
Inventory
|
|
|
35,437 |
|
|
|
42,726 |
|
|
Mineral interests
|
|
|
365,293 |
|
|
|
365,293 |
|
|
Capital loss carry-forward
|
|
|
- |
|
|
|
1,228,090 |
|
|
Unrealized loss on interest rate swap
|
|
|
379,515 |
|
|
|
433,395 |
|
|
Environmental
|
|
|
119,000 |
|
|
|
- |
|
|
Post retirement benefits
|
|
|
351,911 |
|
|
|
314,758 |
|
| |
|
|
|
|
|
|
|
|
|
Investment in AMAK
|
|
|
631,125 |
|
|
|
631,125 |
|
|
Stock-based compensation
|
|
|
355,505 |
|
|
|
81,383 |
|
|
Acquisition costs
|
|
|
- |
|
|
|
135,597 |
|
|
Charitable contributions
|
|
|
- |
|
|
|
14,723 |
|
|
Gross deferred tax assets
|
|
|
2,400,036 |
|
|
|
3,395,264 |
|
|
Valuation allowance
|
|
|
(1,115,418 |
) |
|
|
(2,224,508 |
) |
|
Total net deferred tax assets
|
|
$ |
1,284,618 |
|
|
$ |
1,170,756 |
|
| |
|
|
|
|
|
|
|
|
|
Net deferred tax liabilities
|
|
$ |
(4,806,168 |
) |
|
$ |
(3,692,854 |
) |
The current and non-current classifications of the deferred tax balances are as follows:
| |
|
2010
|
|
|
2009
|
|
| |
|
|
|
|
|
|
|
Current deferred tax asset
|
|
$ |
487,513 |
|
|
$ |
640,057 |
|
| |
|
|
|
|
|
|
|
|
|
Non-current deferred tax liability:
|
|
|
|
|
|
|
|
|
| |
|
|
|
|
|
|
|
|
|
Deferred tax assets
|
|
|
1,822,834 |
|
|
|
2,755,207 |
|
|
Deferred tax liability
|
|
|
(6,001,097 |
) |
|
|
(4,863,610 |
) |
|
Valuation allowance
|
|
|
(1,115,418 |
) |
|
|
(2,224,508 |
) |
|
Non-current deferred tax liability, net
|
|
|
(5,293,681 |
) |
|
|
(4,332,911 |
) |
| |
|
|
|
|
|
|
|
|
|
Total deferred liabilities, net
|
|
$ |
(4,806,168 |
) |
|
$ |
(3,692,854 |
) |
The Company has provided a valuation allowance in 2010, 2009 and 2008 against certain deferred tax assets because of uncertainties regarding their realization. The net decrease in the valuation allowance of $1,109,090 in 2010 includes a decrease in the valuation allowance of $1,228,000 as the result of the offsetting write-off of the gross deferred tax asset for the Company’s capital loss carryovers which expired in 2010 unused. The valuation allowance increased $365,293 in 2009 from December 31, 2008.
The Company elected to carry-back the taxable loss for the year ended December 31, 2009 of approximately $13,900,000 to prior years. The Company had recorded $4,726,708 in taxes receivable as of December 31, 2009 related to the carry-back of which approximately $4,510,000 collected and adjusted in 2010. The remaining taxes receivable at December 31, 2010 is $216,461.
The Company has no Saudi Arabian tax liability.
The Company files an income tax return in the U.S. federal jurisdiction and Texas. Tax returns for various jurisdictions remain open for examination for the years 2007 through 2009. In early 2009 the Internal Revenue Service (IRS) commenced an examination of the Company’s 2007 tax return. In late 2010 the IRS opened an examination of the Company’s 2009 tax return. Both examinations were subsequently closed without change.
NOTE 16 - SEGMENT INFORMATION
Through the third quarter of 2008, the Company operated in two business segments. As a result of the contribution of our Saudi Arabian mining property to AMAK discussed in Note 8, the Company began operating in one segment. The Company measured segment profit or loss as operating income (loss), which represents income (loss) before interest, foreign exchange transaction gain and (loss), miscellaneous income and noncontrolling interest. Information on those segments is as follows:
| |
|
December 31, 2010
|
|
| |
|
Petrochemical
|
|
|
Mining***
|
|
|
Corporate
And Other**
|
|
|
Total
|
|
|
Continuing operations
|
|
|
|
|
|
|
|
|
|
|
|
|
|
Revenue from external customers
|
|
$ |
139,110,194 |
|
|
$ |
- |
|
|
$ |
- |
|
|
$ |
139,110,194 |
|
|
Depreciation*
|
|
|
2,703,952 |
|
|
|
- |
|
|
|
828 |
|
|
|
2,689,847 |
|
|
Operating income (loss)
|
|
|
8,819,580 |
|
|
|
- |
|
|
|
(2,967,811 |
) |
|
|
5,851,769 |
|
| |
|
|
|
|
|
|
|
|
|
|
|
|
|
|
|
|
|
Total assets
|
|
$ |
60,846,568 |
|
|
$ |
- |
|
|
$ |
31,680,943 |
|
|
$ |
92,527,511 |
|
| |
|
December 31, 2009
|
|
| |
|
Petrochemical
|
|
|
Mining***
|
|
|
Corporate
And Other**
|
|
|
Total
|
|
|
Continuing operations
|
|
|
|
|
|
|
|
|
|
|
|
|
|
Revenue from external customers
|
|
$ |
117,586,679 |
|
|
$ |
- |
|
|
$ |
- |
|
|
$ |
117,586,679 |
|
|
Depreciation*
|
|
|
2,688,705 |
|
|
|
- |
|
|
|
1,142 |
|
|
|
2,689,847 |
|
|
Operating income (loss)
|
|
|
14,255,160 |
|
|
|
- |
|
|
|
(1,945,548 |
) |
|
|
12,309,612 |
|
| |
|
|
|
|
|
|
|
|
|
|
|
|
|
|
|
|
|
Total assets
|
|
$ |
58,752,321 |
|
|
$ |
- |
|
|
$ |
31,734,468 |
|
|
$ |
90,486,789 |
|
| |
|
December 31, 2008
|
|
| |
|
Petrochemical
|
|
|
Mining***
|
|
|
Corporate
And Other**
|
|
|
Total
|
|
|
Continuing operations
|
|
|
|
|
|
|
|
|
|
|
|
|
|
Revenue from external customers
|
|
$ |
154,630,234 |
|
|
$ |
- |
|
|
$ |
- |
|
|
$ |
154,630,234 |
|
|
Depreciation*
|
|
|
1,630,428 |
|
|
|
- |
|
|
|
856 |
|
|
|
1,631,284 |
|
|
Operating income (loss)
|
|
|
(11,563,597 |
) |
|
|
(995,474 |
) |
|
|
(1,403,660 |
) |
|
|
(13,962,731 |
) |
| |
|
|
|
|
|
|
|
|
|
|
|
|
|
|
|
|
|
Total assets
|
|
$ |
64,555,422 |
|
|
$ |
588,311 |
|
|
$ |
31,146,157 |
|
|
$ |
96,289,890 |
|
*Depreciation includes cost of sales depreciation and is net of amortization of deferred revenue (other liabilities).
**Corporate and Other includes the Company’s $30,883,657 joint venture interest in AMAK at December 31, 2010 and $31,146,157 joint venture interest in AMAK at December 31, 2009 and 2008 (Note 8) and certain corporate expenses.
*** As of January 1, 2009, we operate in one segment.
The Company attributes revenues to countries based upon the origination of the transaction. All of our revenues for the years ended December 31, 2010, 2009, and 2008, originated in the United States. In addition, all of our long-lived assets are in the United States.
NOTE 17 - NET INCOME (LOSS) PER COMMON SHARE
| |
|
Year ended December 31,
|
|
| |
|
2010
|
|
|
2009
|
|
|
2008
|
|
| |
|
|
|
|
|
|
|
|
|
|
Net income (loss)
|
|
$ |
2,685,654 |
|
|
$ |
6,627,451 |
|
|
$ |
(10,731,165 |
) |
| |
|
|
|
|
|
|
|
|
|
|
|
|
|
Basic earnings (loss) per common share:
|
|
|
|
|
|
|
|
|
|
|
|
|
|
Weighted average shares outstanding
|
|
|
23,769,047 |
|
|
|
23,727,995 |
|
|
|
23,409,458 |
|
| |
|
|
|
|
|
|
|
|
|
|
|
|
|
Per share amount
|
|
$ |
0.11 |
|
|
$ |
0.28 |
|
|
$ |
(0.46 |
) |
|
Diluted earnings (loss) per common share:
|
|
|
|
|
|
|
|
|
|
|
|
|
|
Weighted average shares outstanding
|
|
|
23,780,303 |
|
|
|
23,800,449 |
|
|
|
23,409,458 |
|
| |
|
|
|
|
|
|
|
|
|
|
|
|
|
Per share amount
|
|
$ |
0.11 |
|
|
$ |
0.28 |
|
|
$ |
(0.46 |
) |
| |
|
Year ended December 31,
|
|
| |
|
2010
|
|
|
2009
|
|
|
2008
|
|
|
Weighted average shares-denominator
basic computation
|
|
|
23,769,047 |
|
|
|
23,727,995 |
|
|
|
23,409,458 |
|
|
Effect of dilutive stock options
|
|
|
11,256 |
|
|
|
72,454 |
|
|
|
- |
|
|
Weighted average shares, as adjusted
denominator diluted computation
|
|
|
23,780,303 |
|
|
|
23,800,449 |
|
|
|
23,409,458 |
|
Inclusion of the Company’s options in diluted loss per share for the year ended December 31, 2008, has an anti-dilutive effect because the Company incurred a loss from operations.
NOTE 18 - QUARTERLY RESULTS OF OPERATIONS (UNAUDITED)
The quarterly results of operations shown below are derived from unaudited financial statements for the eight quarters ended December 31, 2010 (in thousands, except per share data):
| |
|
Year Ended December 31, 2010
|
|
| |
|
First
Quarter
|
|
|
Second
Quarter
|
|
|
Third
Quarter
|
|
|
Fourth
Quarter
|
|
|
Total
|
|
| |
|
|
|
|
|
|
|
|
|
|
|
|
|
|
|
|
Revenues
|
|
$ |
31,995 |
|
|
$ |
36,542 |
|
|
$ |
37,050 |
|
|
$ |
33,523 |
|
|
$ |
139,110 |
|
|
Gross profit
|
|
|
3,726 |
|
|
|
3,717 |
|
|
|
5,418 |
|
|
|
4,354 |
|
|
|
17,215 |
|
|
Net income
|
|
|
404 |
|
|
|
2 |
|
|
|
1,671 |
|
|
|
609 |
|
|
|
2,686 |
|
|
Basic EPS
|
|
$ |
0.02 |
|
|
$ |
0.00 |
|
|
$ |
0.07 |
|
|
$ |
0.02 |
|
|
$ |
0.11 |
|
|
Diluted EPS
|
|
$ |
0.02 |
|
|
$ |
0.00 |
|
|
$ |
0.07 |
|
|
$ |
0.02 |
|
|
$ |
0.11 |
|
| |
|
Year Ended December 31, 2009
|
|
| |
|
First
Quarter
|
|
|
First
Quarter
|
|
|
First
Quarter
|
|
|
First
Quarter
|
|
|
First
Quarter
|
|
| |
|
|
|
|
|
|
|
|
|
|
|
|
|
|
|
|
Revenues
|
|
$ |
27,397 |
|
|
$ |
28,585 |
|
|
$ |
30,648 |
|
|
$ |
30,957 |
|
|
$ |
117,587 |
|
|
Gross profit
|
|
|
8,962 |
|
|
|
6,426 |
|
|
|
4,294 |
|
|
|
2,216 |
|
|
|
21,898 |
|
|
Net income (loss)
|
|
|
4,173 |
|
|
|
2,564 |
|
|
|
528 |
|
|
|
(638 |
) |
|
|
6,627 |
|
|
Basic EPS
|
|
$ |
0.18 |
|
|
$ |
0.11 |
|
|
$ |
0.02 |
|
|
$ |
(0.03 |
) |
|
$ |
0.28 |
|
|
Diluted EPS
|
|
$ |
0.18 |
|
|
$ |
0.11 |
|
|
$ |
0.02 |
|
|
$ |
( 0.03 |
) |
|
$ |
0.28 |
|
NOTE 19 - RELATED PARTY TRANSACTIONS
At December 31, 2010, and 2009, the Company had a liability to its former President and Chief Executive Officer of approximately $43,000 in accrued salary and termination benefits
On November 30, 2010, the Company entered into a Letter of Intent and Agreement and Plan of Reorganization with STTC owned by Nicholas N. Carter, the President and CEO of the Company, pursuant to which SHTI, a Delaware corporation and an indirectly wholly owned subsidiary of the Company, acquired 100% of the common stock of STTC. The acquisition was completed on November 30, 2010 and the Company plans in 2011 to merge STTC into South Hampton, an indirectly wholly owned subsidiary of the Company with South Hampton as the surviving corporation. Prior to the acquisition of STTC, South Hampton leased transportation related equipment from STTC pursuant to a Master Lease Agreement dated February 3, 2009, which was set to expire in May 2014. The purpose of the acquisition of STTC was the acquisition of various transportation related assets from STTC that are important to South Hampton’s operations and termination of a related-party transaction and lease agreement. The Company acquired STTC in exchange for the payment to Mr. Carter of (i) cash of $250,000, (ii) a note payable in the amount of $300,000 and (iii) 232,170 shares of the Company’s common stock having a fair value of $775,448.
South Hampton incurred product transportation and equipment costs of approximately $848,000, $961,000 and $757,000 in 2010, 2009 and 2008, respectively, with STTC while STTC was owned by the President of the Company. As discussed in Note 1, in December 2010 the Company acquired STTC. At December 31, 2010, and 2009, no liability was outstanding.
On August 1, 2004, South Hampton entered into a $136,876 capital lease with STTC for the purchase of a diesel powered manlift. The lease bore interest at 6.9% for a 5 year term with monthly payments in the amount of $3,250. Title transferred to South Hampton at the end of the term which was July 2009. In 2010, 2009, and 2008 gross payments of $0, $22,750 and $39,000, respectively were made. At December 31, 2010 and 2009, no liability remained.
Legal fees in the amount of $340,879, $216,671, and $81,705 were paid during 2010, 2009, and 2008, respectively to the law firm of Germer Gertz, LLP of which Charles Goehringer is a minority partner. Mr. Goehringer acts as corporate counsel for the Company and in November 2007 was appointed to the Board of Directors. At December 31, 2010, and 2009, we had a liability of approximately $20,000 and $34,000, respectively.
Robert E. Kennedy was paid $3,000 in consulting fees in 2008. No consulting fees were paid in 2009 or 2010 since the consulting arrangement ended in January 2008. Mr. Kennedy was appointed to the Board of Directors in January 2007. No liability remained at December 31, 2010 or 2009
Ghazi Sultan was paid $18,000 during 2010 for serving as the Company’s Saudi branch representative in 2010.
NOTE 20 – DERIVATIVE INSTRUMENTS
Feedstock, Crude and Natural Gas Contracts
Hydrocarbon based manufacturers such as TOCCO are significantly impacted by changes in feedstock and natural gas prices. Not considering derivative transactions, feedstock and natural gas used for the years ended December 31, 2010, 2009, and 2008, represented approximately 80.8%, 80.5% and 85.4% of TOCCO’s operating expenses, respectively.
On February 26, 2009, the Board of Directors rescinded its original commodity trading resolution from 1992 and replaced it with a new resolution. The 2009 resolution allows the Company to establish a commodity futures account for the purpose of maximizing Company resources and reducing the Company’s risk as pertaining to its purchases of natural gas and feedstock for operational purposes by employing a four step process. This process, in summary, includes, (1) education of Company employees who are responsible for carrying out the policy, (2) adoption of a derivatives policy by the Board explaining the objectives for use of derivatives including accepted risk limits, (3) implementation of a comprehensive derivative strategy designed to clarify the specific circumstances under which the Company will use derivatives, and (4) establishment and maintenance of a set of internal controls to ensure that all of
the derivatives transactions taking place are authorized and in accord with the policies and strategies that have been enacted. On August 31, 2009, the Company adopted a formal risk management policy which incorporates the above process, as well as, establishes a “hedge committee” for derivative oversight.
South Hampton endeavors to acquire feedstock and natural gas at the lowest possible cost. The primary feedstock (natural gasoline) is traded over the counter and not on organized futures exchanges. Financially settled instruments (fixed price swaps) are the principal vehicle used to give some predictability to feed prices. South Hampton does not purchase or hold any derivative financial instruments for trading purposes.
In July 2008 as petroleum prices were nearing record highs and there was discussion in the market of further dramatic increases, the Company, after several months of study, determined that crude oil options would provide better and longer term price protection for feedstock versus shorter term financial swaps normally used. The Company acquired crude oil options in the form of collars covering the period of August 2008 to December 2009. Collars generally limit the upside of price movements by utilizing a call with a strike at the desired level, and the premium for the call is paid by selling a put at a strike price which is deemed an acceptable floor price.
The initial floor of $120 was determined to be an appropriate point as current crude prices were about $133 per barrel for the period in question. A cap of $140 was established as the ceiling. The volume of crude options covered from 15% to 20% of the total expected volume of feedstock for the Company over the time period in question. Beginning in early and mid-August 2008, as it became apparent that the price declines might be more dramatic than normal, the Company began moving the strike price of the floor puts down to levels which seemed more reasonable and would appear to be out of the money in normal circumstances. Moving the floor puts required payment of a premium to buy back the established position and sale of another put to defer the cost of the buyback, with the new floor of the put at a reasonable level under the circumstances. In some cases puts were repurchased with no re-establishment of a new floor. As of mid-November 2008, the Company neutralized positions for all crude options by having the same number of puts and calls in place for a particular strike price thereby allowing the options to expire with no further cash effect. In August, September, and October 2008 margin calls were made on the financial derivatives for $10,250,000 due to the decrease in the price of natural gasoline and crude. The financial swaps for natural gasoline (covering approximately 30% of the feed requirements for the 4th quarter of 2008 and the 1st quarter of 2009) were ultimately bought out in several stages as prices continued to fall and the final loss was fixed. The Company exited that market entirely as of mid-November 2008.
As of December 31, 2010 and 2009, South Hampton had no crude option contracts outstanding.
The following tables detail (in thousands) the impact the feed stock, crude and natural gas instruments had on the financial statements:
| |
|
December 31,
|
|
| |
|
2010
|
|
|
2009
|
|
|
2008
|
|
| |
|
|
|
|
|
|
|
|
|
|
Realized gain (loss)
|
|
$ |
28 |
|
|
$ |
(5,856 |
) |
|
$ |
1,721 |
|
|
Write off derivative premiums
|
|
|
- |
|
|
|
- |
|
|
|
(14,103 |
) |
|
Unrealized gain (loss)
|
|
|
177 |
|
|
|
6,976 |
|
|
|
(6,793 |
) |
|
Net gain (loss)
|
|
$ |
205 |
|
|
$ |
1,120 |
|
|
$ |
(19,175 |
) |
| |
|
December 31,
|
|
| |
|
2010
|
|
|
2009
|
|
| |
|
|
|
|
|
|
|
Fair value of derivative asset
|
|
$ |
177 |
|
|
$ |
- |
|
Realized and unrealized gains/(losses) and the write offs of the derivative premiums are recorded in Cost of Petrochemical Product Sales and Processing for the years ended December 31, 2010, 2009, and 2008.
On March 21, 2008, South Hampton entered into a pay-fixed, receive-variable interest rate swap agreement with Bank of America related to the $10.0 million (later increased to $14 million) term loan secured by property, pipeline and equipment. The effective date of the interest rate swap agreement was August 15, 2008, and terminates on December 15, 2017. The notional amount of the interest rate swap was $7,750,000 at December 31, 2010. South Hampton receives credit for payments of variable rate interest made on the term loan at the loan’s variable rates, which are based upon the London InterBank Offered Rate (LIBOR), and pays Bank of America an interest rate of 5.83% less the credit on the interest rate swap. South Hampton designated the transaction as a cash flow hedge according to ASC Topic 815, Derivatives and Hedging. Beginning on August 15, 2008, the derivative instrument was reported at fair value with any changes in fair value reported within other comprehensive income (loss) in the Company’s Statement of Stockholders’ Equity. The Company entered into the interest rate swap to minimize the effect of changes in the LIBOR rate.
The following tables detail (in thousands) the impact the agreement had on the financial statements:
| |
|
December 31,
|
|
| |
|
2010
|
|
|
2009
|
|
|
2008
|
|
|
Other Comprehensive Loss
|
|
|
|
|
|
|
|
|
|
|
Cumulative loss
|
|
$ |
(1,116 |
) |
|
$ |
(1,275 |
) |
|
$ |
(1,697 |
) |
|
Deferred tax benefit
|
|
|
379 |
|
|
|
434 |
|
|
|
577 |
|
|
Net cumulative loss
|
|
$ |
(737 |
) |
|
$ |
(841 |
) |
|
$ |
(1,120 |
) |
| |
|
|
|
|
|
|
|
|
|
|
|
|
|
Interest expense reclassified from other
comprehensive loss
|
|
$ |
468 |
|
|
$ |
510 |
|
|
$ |
93 |
|
| |
|
December 31,
|
|
| |
|
2010
|
|
|
2009
|
|
| |
|
|
|
|
|
|
|
Fair value of derivative liability
|
|
$ |
1,116 |
|
|
$ |
1,275 |
|
The cumulative loss from the changes in the swap contract’s fair value that is included in other comprehensive loss will be reclassified into income when interest is paid. The unrealized gain on the interest rate swap for 2010 included in other comprehensive loss is $104,591 (net of $53,880 of income tax expense).
The net amount of pre-tax loss in other comprehensive income (loss) as of December 31, 2010, predicted to be reclassified into earnings within the next 12 months is approximately $397,000.
NOTE 21- POST RETIREMENT OBLIGATIONS
In January 2008 an amended retirement agreement, replacing the February 2007 agreement, was entered into with Hatem El Khalidi. The amended agreement provided $6,000 per month in benefits to Mr. El Khalidi upon his retirement for the remainder of his life. Additionally, upon his death $4,000 per month would be paid to his surviving spouse for the remainder of her life. A health insurance benefit was also to be provided. An additional $382,000 was accrued in January 2008 for the increase in benefits. A liability of approximately $680,000 based upon an annuity single premium value contract was outstanding at December 31, 2010, and was included in post retirement benefits and approximately $215,000 was included in accrued liabilities in Saudi Arabia. Mr. El Khalidi retired effective June 30, 2009. As of December 31, 2010, no payments have been made pursuant to this agreement.
In June 2009 the Company’s Board of Directors awarded Mr. El Khalidi a retirement bonus in the amount of $31,500 for 42 years of service. While there is no written policy regarding retirement bonus compensation, the Company has historically awarded all employees (regardless of job position) a retirement bonus equal to $750 for each year of service. Since Mr. El Khalidi was employed by the Company for 42 years, the Board of Directors voted to award him a $31,500 retirement bonus, consistent with that provided to all other retired employees. This amount was outstanding at December 31, 2010 and was included in post retirement benefits.
On May 9, 2010, the Board of Directors terminated the retirement agreement, options, retirement bonus, and any outstanding directors’ fees due to Mr. El Khalidi; however, due to the litigation discussed in Note 13, all amounts remain outstanding until a resolution is achieved.
VALUATION AND QUALIFYING ACCOUNTS
Three years ended December 31, 2010
|
Description
|
|
Beginning
balance
|
|
|
Charged
(credited)
to earnings
|
|
|
Deductions(a)
|
|
|
Ending
balance
|
|
|
ALLOWANCE FOR DEFERRED
TAX ASSET
|
|
|
|
|
|
|
|
|
|
|
|
|
| |
|
|
|
|
|
|
|
|
|
|
|
|
|
December 31, 2008
|
|
|
1,228,090 |
|
|
|
631,125 |
|
|
|
- |
|
|
|
1,859,215 |
|
|
December 31, 2009
|
|
|
1,859,215 |
|
|
|
365,293 |
|
|
|
- |
|
|
|
2,224,508 |
|
|
December 31, 2010
|
|
|
2,224,508 |
|
|
|
- |
|
|
|
(1,228,090 |
) |
|
|
996,418 |
|
(a) Utilization of carryforwards
|
Description
|
|
Beginning
balance
|
|
|
Charged
to earnings
|
|
|
Deductions
|
|
|
Ending
balance
|
|
|
ALLOWANCE FOR DOUBTFUL
ACCOUNTS
|
|
|
|
|
|
|
|
|
|
|
|
|
| |
|
|
|
|
|
|
|
|
|
|
|
|
|
December 31, 2008
|
|
|
35,000 |
|
|
|
465,000 |
|
|
|
- |
|
|
|
500,000 |
|
|
December 31, 2009
|
|
|
500,000 |
|
|
|
111,154 |
|
|
|
(484,654 |
) |
|
|
126,500 |
|
|
December 31, 2010
|
|
|
126,500 |
|
|
|
28,500 |
|
|
|
|
|
|
|
155,000 |
|